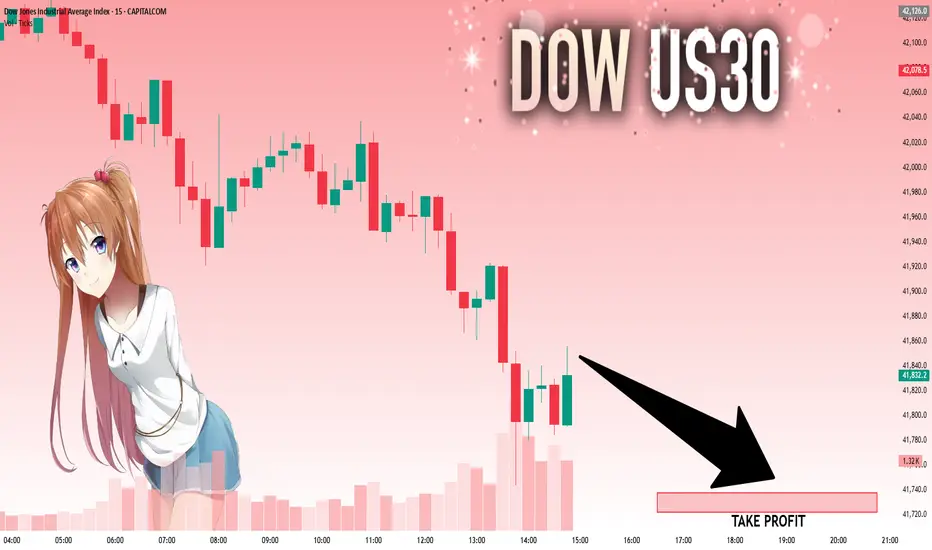
US30 TodayUS30 Today is still bearish
My SSM Reversal Pattern is comming.
This is just my view of course
US30USD trade ideas
US30 Potential Rebound from Key Support Zone
US30 Potential Rebound from Key Support Zone 🚀📊
📉 Analysis Overview:
The US30 (Dow Jones Index) is currently testing a major support zone near the 41,800–41,900 range, a level that has held firm multiple times in the past (highlighted with green arrows and orange circles). This area has acted as a demand zone, leading to strong bullish reactions previously.
🔍 Key Technical Highlights:
🔸 Support Zone: Clearly respected at ~41,800. Price is once again bouncing here.
🔸 Resistance Zone: Around 43,250–43,500. This area has acted as a ceiling, where price struggled to break through.
🟢 Reversal Indicators: Multiple successful defenses of the support zone suggest accumulation and possible bullish reversal.
📈 Target Projection: If support holds, the price may rally toward the target zone near 43,496.4, as shown by the purple arrow.
📌 Conclusion:
As long as the 41,800 support holds, US30 shows bullish potential toward the 43,500 resistance. A break below this zone would invalidate the bullish scenario and shift focus back to the lower support near 41,250.
🛑 Risk Management Tip: Watch for confirmation candles and volume before entering long positions. Always set a stop-loss below the support zone.

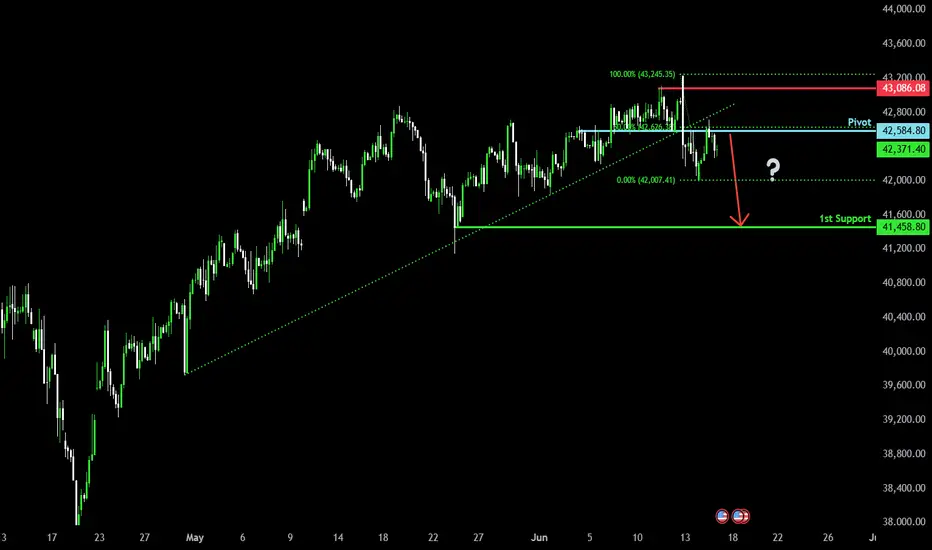
Potential bearish drop?Dow Jones (US30) has rejected off the pivot, which acts as an overlap resistance and could drop to the pullback support.
Pivot: 42,584.80
1st Support: 41,458.80
1st Resistance: 43,086.08
Risk Warning:
Trading Forex and CFDs carries a high level of risk to your capital and you should only trade with money you can afford to lose. Trading Forex and CFDs may not be suitable for all investors, so please ensure that you fully understand the risks involved and seek independent advice if necessary.
Disclaimer:
The above opinions given constitute general market commentary, and do not constitute the opinion or advice of IC Markets or any form of personal or investment advice.
Any opinions, news, research, analyses, prices, other information, or links to third-party sites contained on this website are provided on an "as-is" basis, are intended only to be informative, is not an advice nor a recommendation, nor research, or a record of our trading prices, or an offer of, or solicitation for a transaction in any financial instrument and thus should not be treated as such. The information provided does not involve any specific investment objectives, financial situation and needs of any specific person who may receive it. Please be aware, that past performance is not a reliable indicator of future performance and/or results. Past Performance or Forward-looking scenarios based upon the reasonable beliefs of the third-party provider are not a guarantee of future performance. Actual results may differ materially from those anticipated in forward-looking or past performance statements. IC Markets makes no representation or warranty and assumes no liability as to the accuracy or completeness of the information provided, nor any loss arising from any investment based on a recommendation, forecast or any information supplied by any third-party.
US30 (Dow Jones) Analysis – June 2025 Outlook📊 US30 (Dow Jones) Analysis – June 2025 Outlook
🔍 1. Fundamental Analysis
The US30 (Dow Jones Industrial Average) is currently navigating a complex environment shaped by macroeconomic shifts and geopolitical tensions. Below is an in-depth review of current factors influencing its price action:
🏦 Monetary Policy & Economic Indicators
Federal Reserve Stance:
After a series of rate hikes between 2022 and 2024, the Fed has adopted a more dovish tone in 2025.
Market consensus now expects the Fed to cut rates by Q3–Q4 2025 as inflation cools and growth moderates.
Inflation:
The May 2025 CPI came in lower than expected at 2.7% YoY, signaling disinflation.
Core CPI and PCE data also reflect a slowing pace of price increases, strengthening the case for easing.
Labor Market:
Non-farm payrolls have stabilized, but wage growth is slowing.
Unemployment remains low at 3.8%, but job creation is skewed toward lower-paying service sectors.
Growth Metrics:
ISM Manufacturing PMI remains below 50 (contraction), but Services PMI is resilient.
Consumer confidence dipped recently, reflecting uncertainty, yet consumer spending remains robust.
🌍 Geopolitical Climate
Iran–Israel Conflict Escalation (Mid 2025):
The recent Iran-Israel military clashes have rattled markets, briefly triggering risk-off flows.
The conflict has led to spikes in crude oil prices, pushing energy stocks higher but raising concerns about inflation re-acceleration.
US–China Relations:
Ongoing trade tensions over semiconductors and AI have led to sanctions on key Chinese tech firms.
Despite this, tech-heavy indices remain resilient due to domestic demand and AI sector optimism.
Global Monetary Policy Divergence:
While the Fed is dovish, the ECB has already started cutting rates, boosting global liquidity.
This divergence supports capital inflows into US equities, especially defensive and industrial sectors represented in the Dow.
📉 2. Technical Analysis (Smart Money Concepts)
The daily chart of US30, as annotated, reflects a clear transition from a bearish structure to a bullish regime, validated by Smart Money Concepts (SMC) methodology:
🔄 Market Structure Shift
Bearish Trend: Price was forming Lower Highs (LH) and Lower Lows (LL) into early 2025.
Change of Character (ChoCH): A significant bullish shift occurred with a closure above 42842, invalidating the prior LH and suggesting institutional buying.
Break of Structure (BOS): Followed by a clean higher high, reinforcing the bullish momentum.
🧱 Key SMC Levels & Zones
Buy Zone (Demand):
Between 41,600 and 41,800, this region aligns with:
A previous Higher Low (HL)
A visible Fair Value Gap (FVG)/Imbalance
Psychological support zone
Expected to be a strong institutional demand zone for a long setup.
IDM (Intermediate Demand Mitigation):
Minor liquidity grab possible before retest of buy zone.
An early sign of bullish intent may appear here.
Bearish Invalidation Level:
41,179 is the key structural level.
A daily closure below 41,179 would invalidate bullish bias and trigger a bearish BOS.
📈 Trend & Liquidity Outlook
Liquidity Pools:
Sell-side liquidity rests below recent HLs, particularly near IDM and the Buy Zone.
Buy-side liquidity above recent HH (~43,800) is the next target if price rebounds.
Trendline Support:
Ascending trendline from April continues to hold.
Acts as dynamic support intersecting the Buy Zone in late June.
Targets:
TP1: 43,000 (recent swing high)
TP2: 43,800–44,000 (liquidity magnet zone)
Final Supply Zone: 45,078 (historical resistance, visible on chart)
📌 Scenario Planning (SMC-Based)
Primary (Bullish) Scenario:
Price retraces into Buy Zone (41,600–41,800).
Forms bullish engulfing or displacement candle.
Entry long → Target 43,800+, SL below 41,179.
Alternate (Bearish) Scenario:
Price closes below 41,179 (breaks structure).
Bias flips to bearish.
Next support zone lies around 40,300–40,500.
NOTE: ONLY FOR EDUCATIONAL NOT A FINANCIAL ADVICE

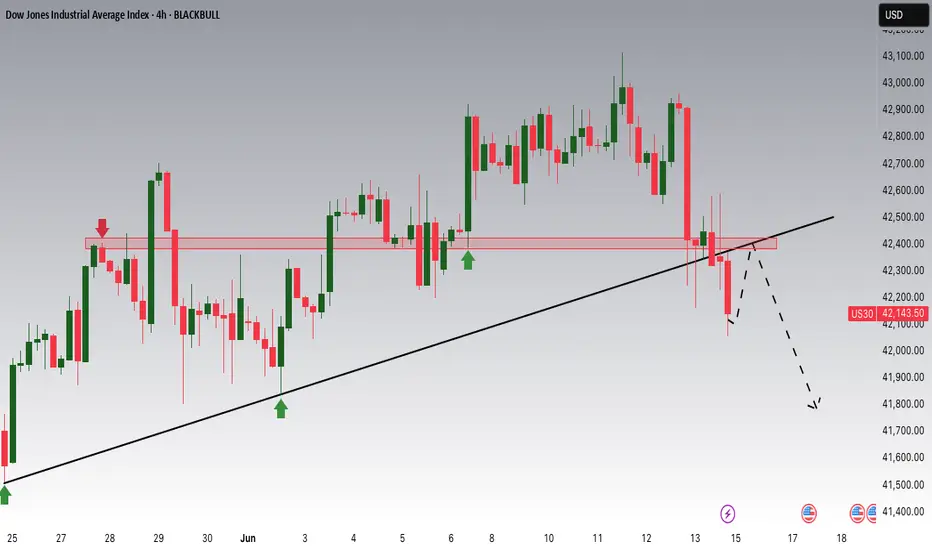
Dow Jones Breakout and Potential RetraceHey Traders, in the coming week we are monitoring US30 for a selling opportunity around 42,400 zone, Dow Jones was trading in an uptrend and successfully managed to break it out. Currently is in a corerction phase in which it is approaching the retrace area at 42,400 support and resistance area.
Trade safe, Joe.
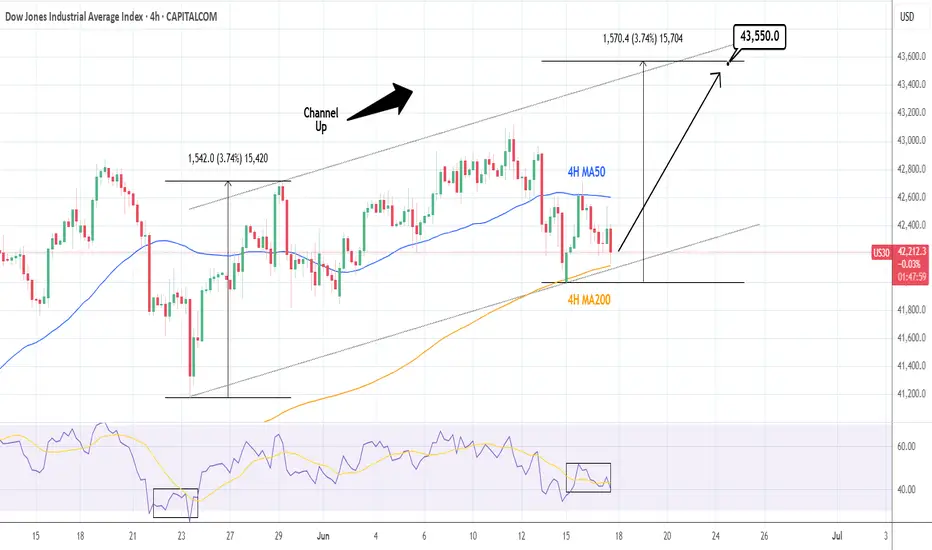
DOW JONES: Will the 4H MA200 produce a rally?Dow is neutral on its 1D technical outlook (RSI = 51.949, MACD = 356.820, ADX = 20.639), trading between its 4H MA50 and MA200 in the past 2 days. The price just hit the 4H MA200 for the 2nd time again at the bottom of the Channel Up. As long as it holds, the pattern can initiate the new bullish wave. We exepct it to repeat the +3.74% rise of the one before, TP = 43,550.
See how our prior idea has worked out:
## If you like our free content follow our profile to get more daily ideas. ##
## Comments and likes are greatly appreciated. ##
US30 on Track for 43KHappy Monday, traders.
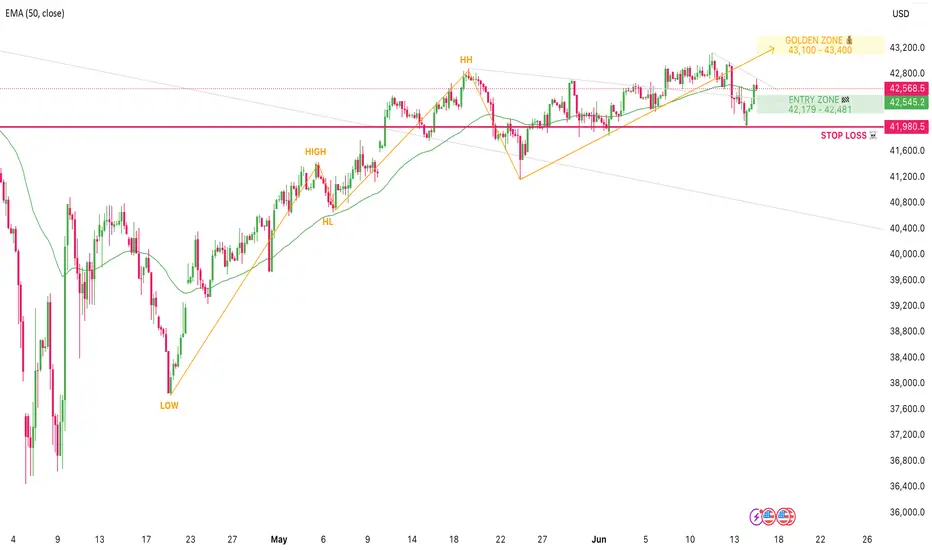
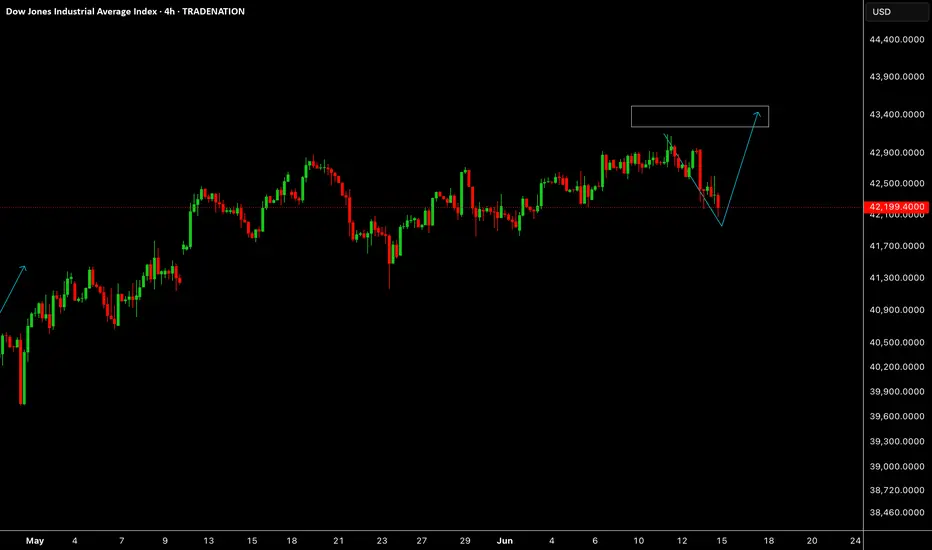
Here’s my latest analysis and trade idea for US30. Since April 6th, US30 has been in a strong bull run, breaking above the descending weekly trend line while continuing to print higher highs and higher lows.
Although price action has shown some uncertainty since May 22nd, the bigger picture remains bullish it’s just noise. The trend is intact, and we’re now pushing back above the 50 EMA.
Currently, US30 is forming a wedge between two descending trendlines I’ve marked on the chart. I expect some consolidation within this structure, with a potential pullback into my entry zone.
From there, I’m anticipating another short-term push higher, with a target in the Golden Zone between 43,100 and 43,400 . My entry range is between 42,179 and 42,481 , with a stop-loss just below the current swing low at 41,980.
I expect this move to develop sometime within the next couple weeks.
What do you think will it play out? Let me know in the comments.
PEPPERSTONE:US30
DOW JONES 15 year Cycles are coming to play.Dow Jones (DJI) is consolidating on its 1W MA50 (blue trend-line) for the past month. Based on a remarkable cyclical frequency as the Time Cycles show, every time this 1W MA50 consolidation takes place since October 2011, it turned into the long-term Support that supported rallies of at least +40.94%.
As their 1M RSI readings also sync, we can expect the current consolidation to end soon and drive the market to at least a +40.94% rise from the 1W MA50. Our long-term Target on this is 59000.
-------------------------------------------------------------------------------
** Please LIKE 👍, FOLLOW ✅, SHARE 🙌 and COMMENT ✍ if you enjoy this idea! Also share your ideas and charts in the comments section below! This is best way to keep it relevant, support us, keep the content here free and allow the idea to reach as many people as possible. **
-------------------------------------------------------------------------------
💸💸💸💸💸💸
👇 👇 👇 👇 👇 👇

Tuesday Outlook #us30Tuesday Outlook #US30. As we head into the Fed's Decision. Be careful trading today.
US30: Absolute Price Collapse Ahead! Short!
My dear friends,
Today we will analyse US30 together☺️
The recent price action suggests a shift in mid-term momentum. A break below the current local range around 41,858.0 will confirm the new direction downwards with the target being the next key level of 41,737.4 .and a reconvened placement of a stop-loss beyond the range.
❤️Sending you lots of Love and Hugs❤️
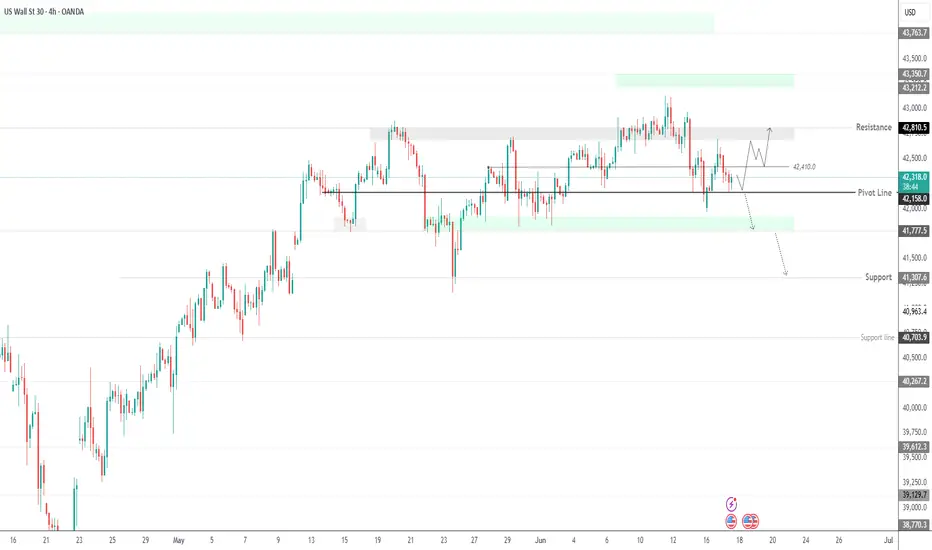
US30 Consolidates Amid Geopolitical UncertaintyUS30 Overview – Market Caught Between Geopolitical Risk and Technical Boundaries
The ongoing Middle East crisis continues to weigh on market sentiment, keeping US30 (Dow Jones) in a consolidation phase.
Technical Outlook:
Price is currently trading between 42160 and 42410.
As long as it holds above 42160, a move toward 42410 remains likely.
🔺 A break and stability above 42410 would confirm bullish momentum toward 42810.
🔻 A break below 42160 opens the door for a decline toward 41780, with further downside potential.
Key Levels:
• Pivot: 42410
• Support: 42160 / 41780 / 41310
• Resistance: 42610 / 42810 / 43210
DOW JONES Analysis This is U30 through my current lens, investigations of price action from W - D - 4H suggest Bullish.
factoring in the current fundamental conditions, I observe the US Dollar.
Monitor the US100 & US500 for any irregular correlation in price delivery between the 4H - 15M
I seek price to attack "Highs" and sustain strong "Lows".

Potential Long Setup on Bullish Flag BreakoutThe US30 is currently forming a bullish flag on the 4H chart. A double bottom has developed around the 61.8% Fibonacci retracement level, measured from the most recent bullish impulse — providing a strong point of confluence that adds validity to the pattern.
Should price break above the flag's upper boundary, it could trigger a continuation to the upside, offering a potential long entry.
On the higher timeframes, the daily chart continues to respect a long-term ascending wedge, further supporting the bullish outlook and the possibility of a move towards new all-time highs.
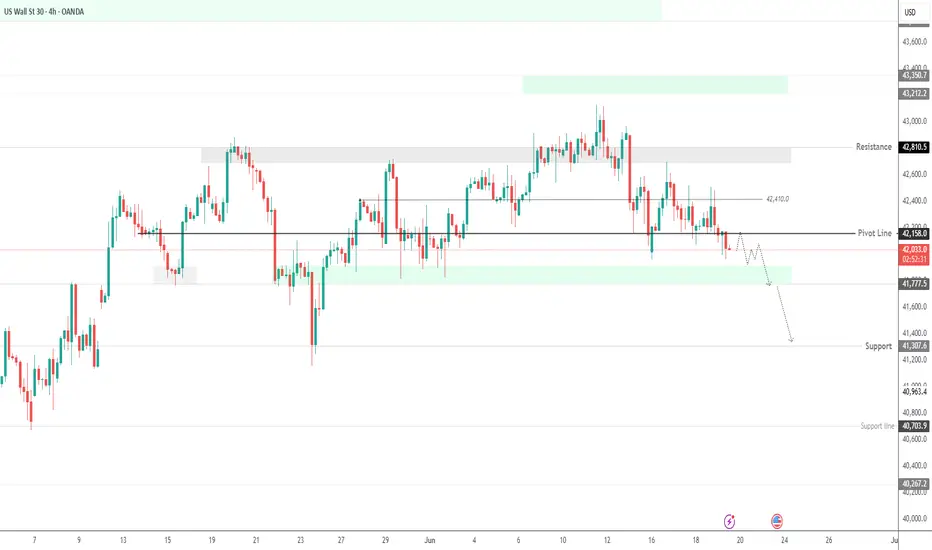
US30 Breaks Key Support as Geopolitical Risk Weighs on SentimentUS30 – Technical Overview
Amid rising Middle East tensions, the indices market remains under bearish pressure, with risk-off sentiment dominating.
US30 dropped to the 42160 level, as previously forecasted, and has now broken below it.
As long as the price trades below 42160, the bearish trend is expected to continue toward 41780, and potentially 41310 if that level fails to hold.
Key Levels:
• Pivot: 42160
• Support: 41900 / 41780 / 41310
• Resistance: 42310 / 42410 / 42580
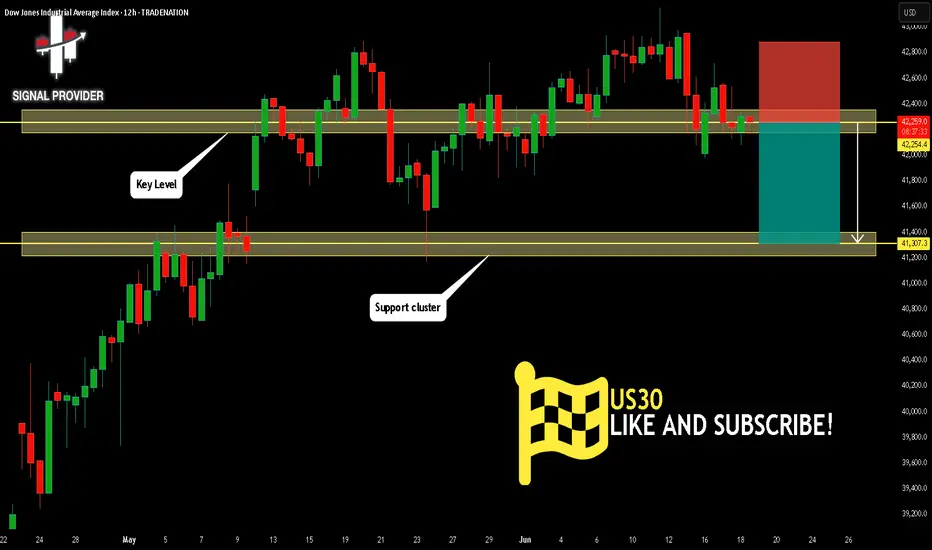
US30 Is Bearish! Sell!
Here is our detailed technical review for US30.
Time Frame: 12h
Current Trend: Bearish
Sentiment: Overbought (based on 7-period RSI)
Forecast: Bearish
The market is approaching a significant resistance area 42,254.4.
Due to the fact that we see a positive bearish reaction from the underlined area, I strongly believe that sellers will manage to push the price all the way down to 41,307.3 level.
P.S
Overbought describes a period of time where there has been a significant and consistent upward move in price over a period of time without much pullback.
Disclosure: I am part of Trade Nation's Influencer program and receive a monthly fee for using their TradingView charts in my analysis.
Like and subscribe and comment my ideas if you enjoy them!
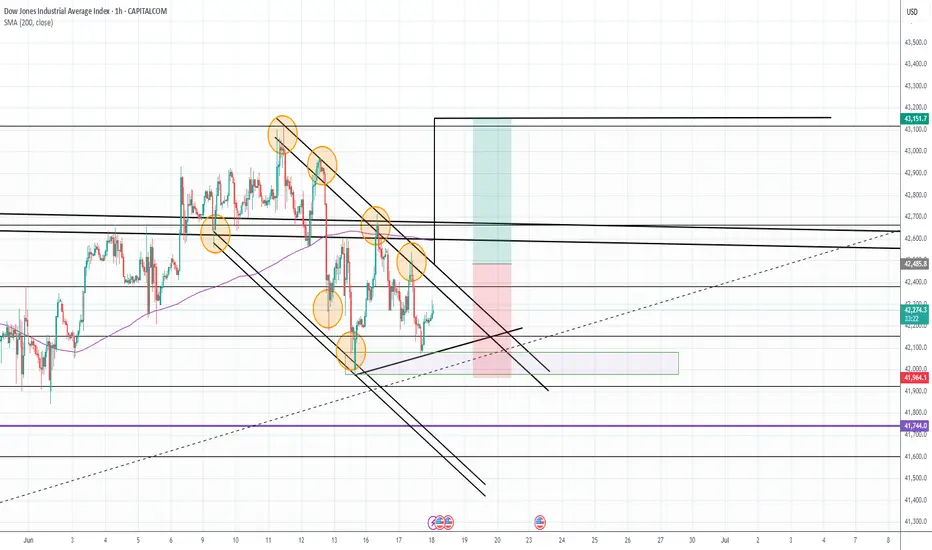
DOW Might Recover From Today's LossesIsrael's attack on Iran's nuclear facilities has unsettled the markets. After a weak start, the indices, such as the DJIA, initially made little headway and were unable to recover their losses.
We do not expect the markets to plunge to their doom now, but to recover soon.
For the Dow, we initially expect new lows in the entry area shown and then a recovery to the target zone in the coming week.

Don't SELL your bags Because of WAR FUDThey just end up turning up the money printer anyway...
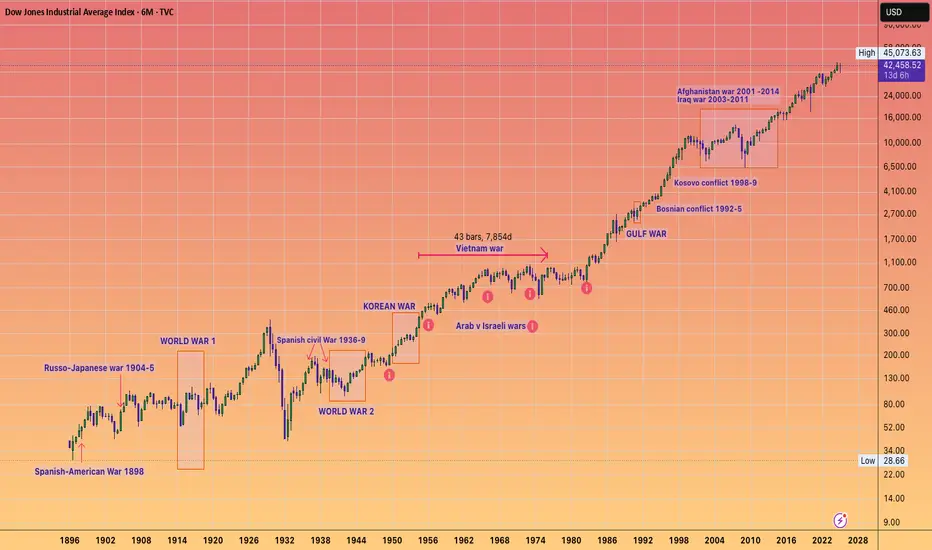
DJI set amongst the major wars and conflicts the past century...
( I could have added way more wars to this chart but it would have been difficult to read all of them )
US30US30 is consolidating right now for another push up towards the highlighted box.
Disclosure: We are part of Trade Nation's Influencer program and receive a monthly fee for using their TradingView charts in our analysis.
Dow Jones Approaches Two-Month Highs AgainThe Dow Jones index has started the week with a strong bullish bias, pushing the price up by more than 1% in the short term. This upward trend has remained solid despite growing military tensions in the Middle East. While the conflict caused significant volatility last week, markets have now digested the uncertainty, with CNN’s Fear and Greed Index remaining steady in the “greed” zone, showing no signs of retreating toward neutral territory. This suggests that confidence remains firm in the short term, allowing demand for risk assets like the Dow Jones to stay consistent in recent sessions.
However, it is important to note that the Dow has historically shown significant sensitivity to trade war developments. Although ongoing negotiations between the United States and China continue, the outcome regarding tariffs remains uncertain. If no agreement is reached, negative trade dynamics could resurface, triggering a renewed loss of confidence and possibly leading to sustained selling pressure in the long term.
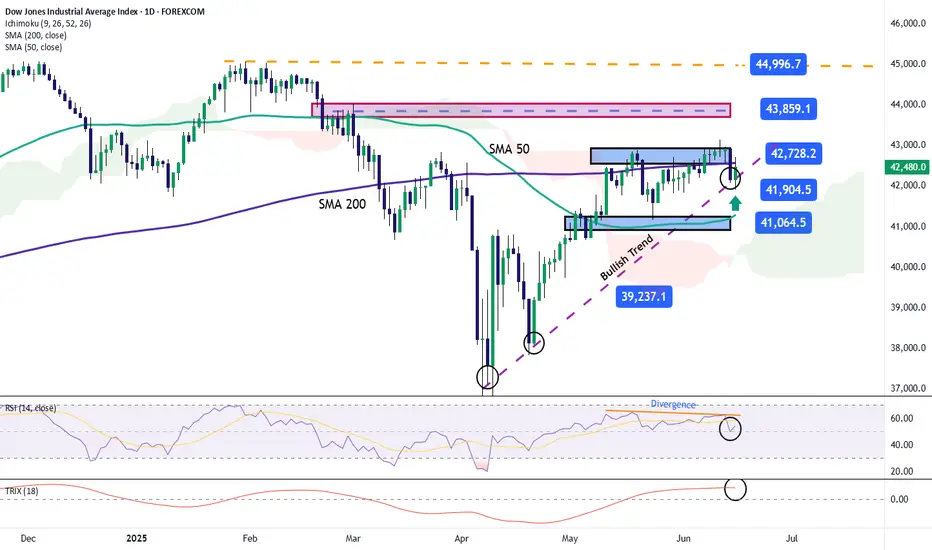
Consistent Bullish Trend
Since early April, the Dow Jones has maintained a strong buying trend, with price movements consistently above the 40,000-point level. So far, there have been no major bearish corrections that would break this structure. However, the price is currently facing a key resistance level. If this barrier holds, it could mark the beginning of a corrective phase in the short term.
Technical Indicators:
RSI: The RSI line has begun to show a bearish divergence, as it records lower highs, while the Dow’s price posts higher highs. This reflects an imbalance in market forces, which may lead to short-term downside corrections.
TRIX: The TRIX line, which measures the momentum of exponential moving averages, remains above the neutral level (0), but has started to flatten, potentially signaling the beginning of a neutral phase, especially as the price tests resistance zones.
Key Levels to Watch:
42,700 points: A critical resistance zone, aligned with the 200-period simple moving average. A breakout above this level would strengthen the current bullish bias and help consolidate the uptrend.
41,900 points: A short-term support level, associated with a recent neutral zone. It could act as a barrier against downward corrections.
41,064 points: The final support, aligned with the 50-period simple moving average. A drop to this level could threaten the ongoing bullish trend.
Written by Julian Pineda, CFA – Market Analyst
Follow him at: @julianpineda25
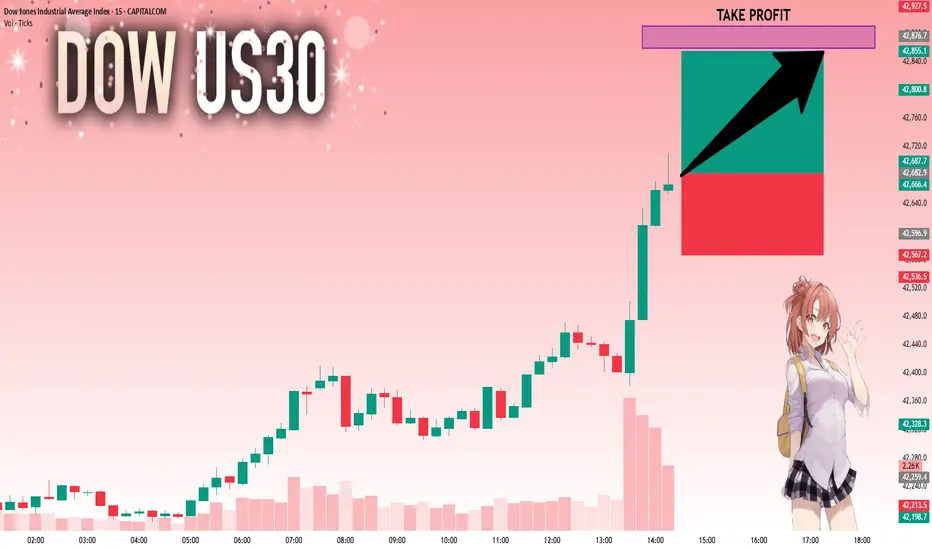
US30 Technical Analysis From that zone, I'm expecting US30 to keep flying. We should see a bit more push to the upside if price reacts to our zone.

US30: Strong Growth Ahead! Long!
My dear friends,
Today we will analyse US30 together☺️
The recent price action suggests a shift in mid-term momentum. A break above the current local range around 42,682.9 will confirm the new direction upwards with the target being the next key level of 42,855.1 and a reconvened placement of a stop-loss beyond the range.
❤️Sending you lots of Love and Hugs❤️
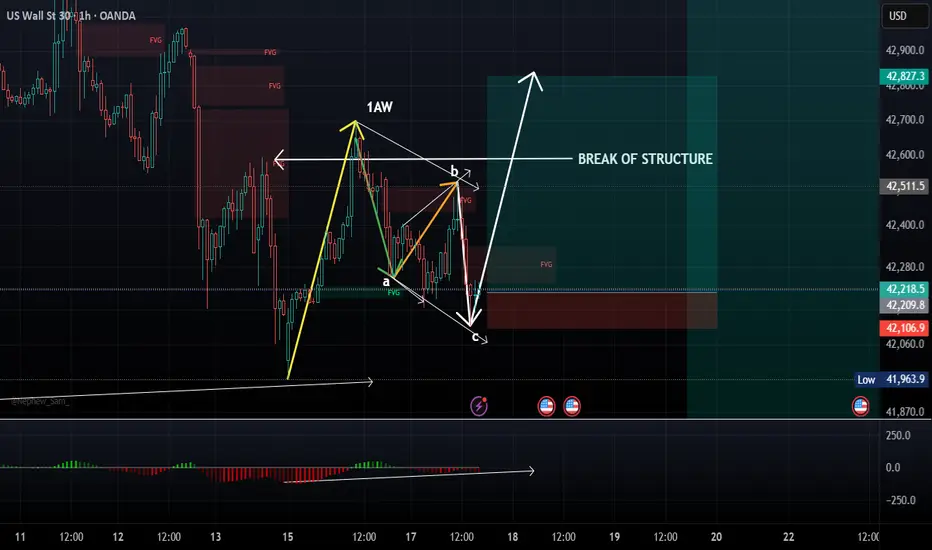
US30/DJ30 Long/buy 1:6Reason for buy:
VERY SIMILAR STRUCTURE TO GOLD!!!!!
1. Break of structure
2. Regular flat in play with a complete corrective structure (a,b,c)
3. NO MACD divergence shows strong moment upwards
4. Impulsive move (1AW) indicates a strong move upwards will continue
5. Liquidity at the top (TP area)
Entry: CMP (Current market price)
Stop loss :42086
Take Profit: At own discretion...OPEN!
Strategy/ies: Engulfing candle on 15/1HR TF
Losses are part of the game...don't be too hard on yourself!
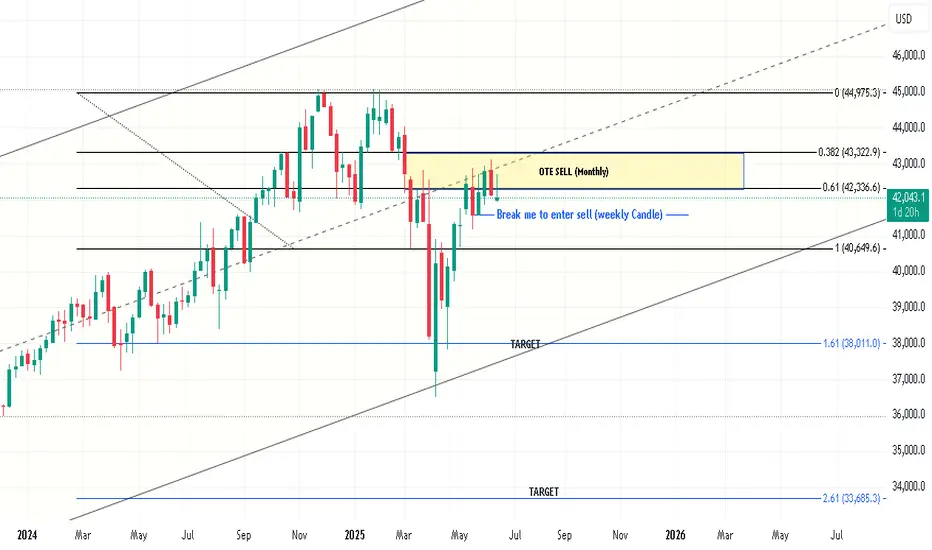
US 30 Idea Wait Weekly candle to be broken to enter long sell position ...if not broken then still making dramas in OTE areas