OGN potential OGN steady upside movement and a huge negative funding rate will likely to sweepout the shorts on exchanges this is my long entry for ogn { always mange mange your risk before taking a trade } good luck !
OGNUSDT trade ideas
OGNUSDT STILL PROMISING AND JUST ABOUT READYLike you, when you were growing up, OGN shows huge potential.
Unlike you, I expect OGN to really perform from its current level and quickly become one of those coins that make people regret not entering when they read this.
Meh. Use it, don't use it.
If you do, and would like TP's, DM me and we can talk. Trading is easier when you're confident. That's what I'm offering.
See my previous OGN post what happened minutes after it was published.
The next run will me much, much greater.

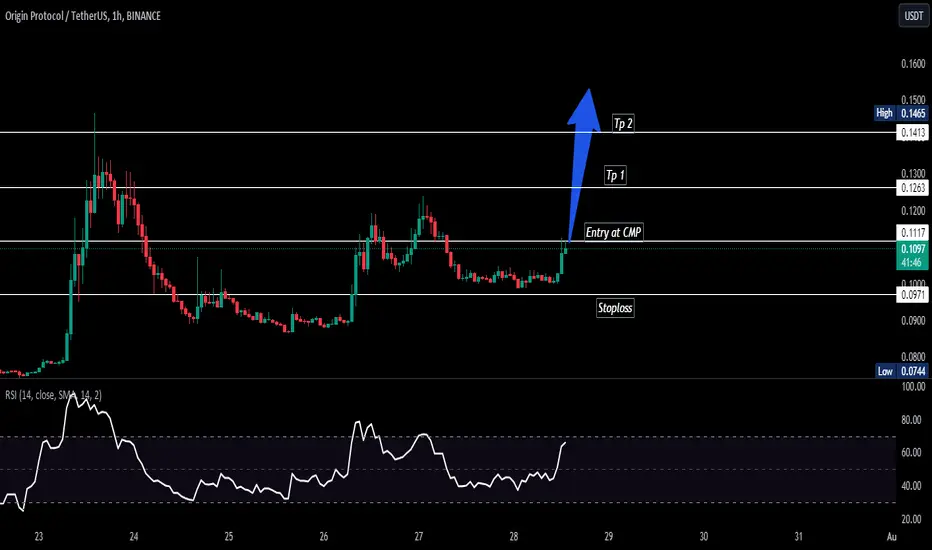
OGNUSDTOGNUSDT just enter into the bullish trend.
break the ranging phase.
NO sign of reversal here.
we execute trade here at CMP
OGN 1H ( Short Scenario ) The OGN price is currently trading within the range of 0.1023, where it previously faced rejection and formed a Double Top pattern around the 0.12 region. Our expectation is that it will break below the 0.1023 level and retrace towards the 0.090 area, leading to a reversal in price.

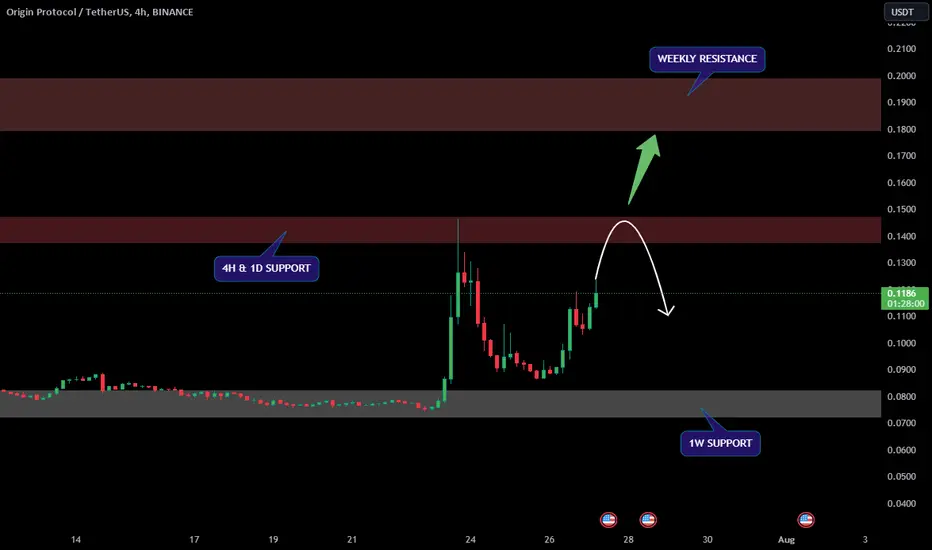
OGN COIN ANALYSIS AND POSSIBLE MOVESNYSE:OGN Coin Update & Possible move.
• On 1W , 1D & 4H MACD &RSI are bullish.
• Volume is too high as compared to its price so liquidation wick expected ( without proper trade don't open any short otherwise you will get rekt )
• If its break 4h&1D resistanc then price will easily touch 0.20$.
Near me we miss buying oportunity at 0.088$ and short i will not recomand on it if you are not a pro trader.
follow for more
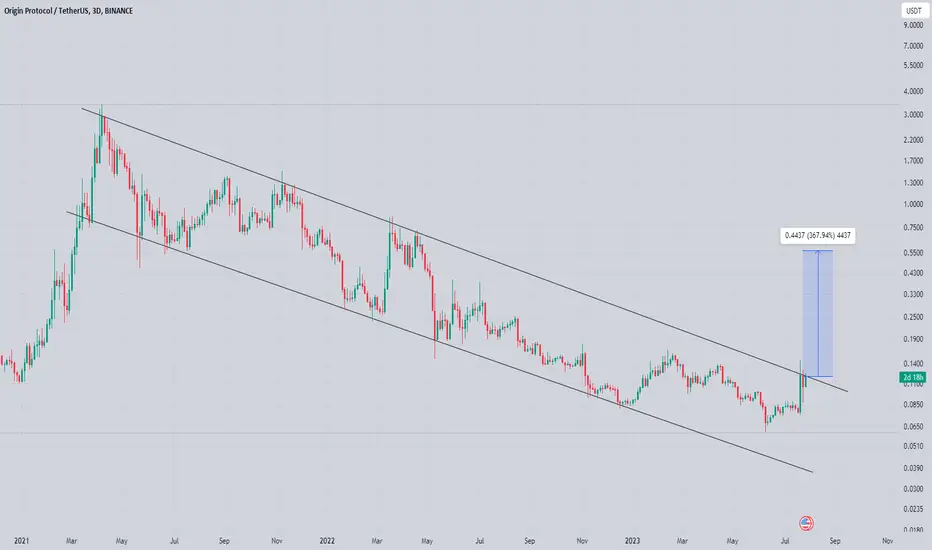
Ogn Testing Crucial Area Seems Like Getting ready for Massive bullish Rally Formed Text book Descending Channel In higher timeframes & trying to Break it Incase Of Successful breakout Expecting 300%+ Bullish Rally in Midterm Keep Eyes On For breakout
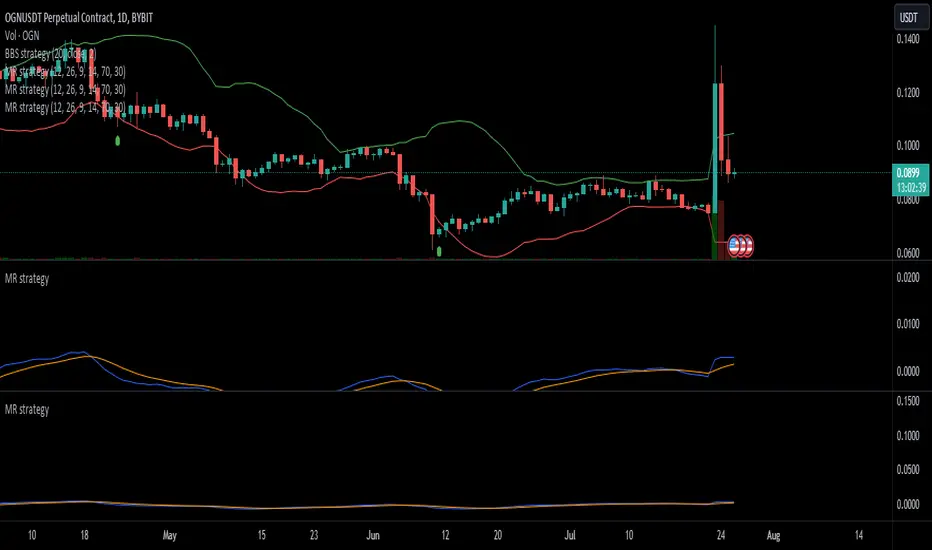
SENEL MACD RSI strategy", short NAME "MR strategy"This Pine Script is a technical analysis tool that uses the Moving Average Convergence Divergence (MACD) and the Relative Strength Index (RSI) to generate potential trading signals. It's used to identify possible buying and selling opportunities based on momentum and relative strength of the asset's price. Here's a description of each component:
BUY OGNUSDT : BOTTOM OF RETRACEMENTAs the title suggests, right now, ~$0.0915 is the very bottom of the retracement and the perfect entry point to a coin I'm trading for the first time today.
Just shy of 100% certainty on this call, so you can hold me to it.
Enjoy.

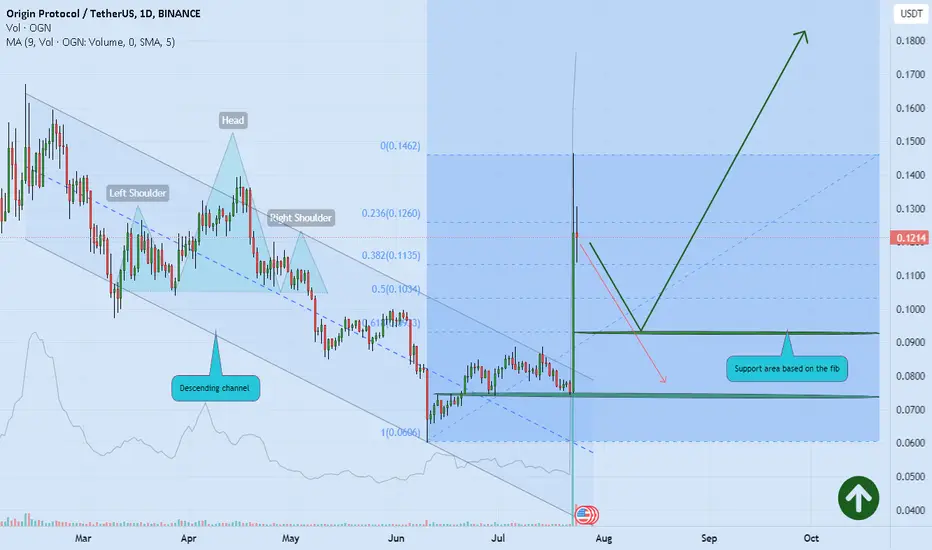
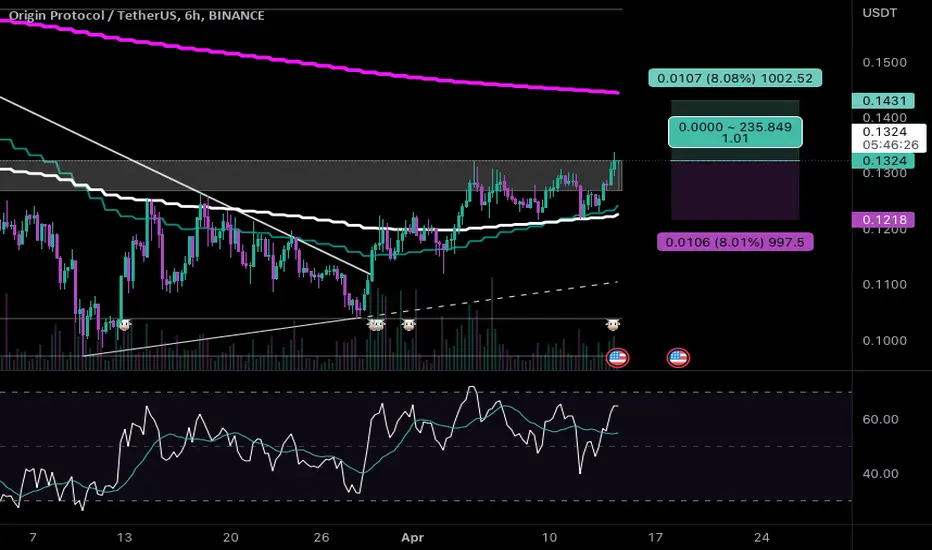
ORIGIN TOKEN gain new volume 💣📖💡Hello 🐋
based on the chart, we can see explosive and new volume for the price and break out of the descending channel 📖💡
for
first target definitely we expect more correction close to our Fibonacci levels 💡📖
and
in the long term we expect even more gain 🚀💣
Please, feel free to share your point of view, write it in the comments below, thanks 🐋
OGN's Price Surge: Riding the WaveAs the cryptocurrency landscape continuously evolves and expands, the Origin Protocol (OGN) has caught the attention of traders and investors alike with a breathtaking rally. In the past 24 hours, the digital asset has surged by an astounding 61%, establishing its market price at 0.1202. This seismic activity in OGN's price movement has not only turned heads in the market but also ignited a spark of anticipation amongst its followers.
Examining the asset through a four-hour timeframe chart provides a fascinating glimpse into its journey. The Fibonacci retracement levels, a crucial tool for predicting potential support and resistance levels, plots a promising path for OGN. It has effortlessly exceeded its first Fibonacci level at 0.0888 and is now ambitiously eyeing the 1.618 level, which stands at 0.0977.
This bullish rally doesn't seem to show signs of slowing down, as the Origin Protocol could potentially ascend to the 2.618 level at 0.1121 in the near future. If the bullish momentum persists and the 3.618 level at 0.1265 is breached, the 4.236 level at 0.1354 will be the next goalpost on OGN's upward journey.
A glance at the Bollinger Bands reveals that OGN's current trading price is comfortably above the middle band at 0.0815. This middle band could serve as a stronghold of support if the market corrects. The upper band, currently set at 0.1044, has been eclipsed by the recent price movement, reaffirming the strength of the ongoing trend. Meanwhile, the lower band at 0.0585 seems a remote possibility at present.
However, the surge has placed OGN in a precarious position, according to the Relative Strength Index (RSI). With a reading of 93, it's apparent that OGN is in an overbought state. History suggests that assets tend to retreat from such lofty RSI levels, indicating the potential for a future price correction.
Despite the looming shadow of a potential correction, the volume oscillator presents a rather upbeat picture at 57%. The stochastic index echoes this positivity, with a reading of 86%, indicating a robust bullish sentiment permeating the market. The Moving Average Convergence Divergence (MACD) at 0.0054 further attests to this bullish phase, suggesting the market is currently dominated by buyers.
The On-Balance Volume (OBV) presents a final piece to this puzzle. Sitting at an impressive 2.138 billion, the OBV highlights the significant volume flowing into OGN, providing a sturdy foundation for the current bullish phase.
While the meteoric rise of OGN has instilled a sense of exhilaration amongst its followers, caution is advised. The overbought conditions, as indicated by the RSI, suggest that the market could be due for a correction. If the bullish sentiment loses steam and the buying volume dwindles, OGN may experience a price pullback.
However, if the bullish fervor remains unscathed and the influx of volume is sustained, we could witness OGN painting new highs on the charts. As with all investments, risk management is key. Always remember not to invest more than you're willing to lose and to conduct your research before making any investment decisions. After all, in the volatile world of cryptocurrencies, fortune favors the well-prepared.

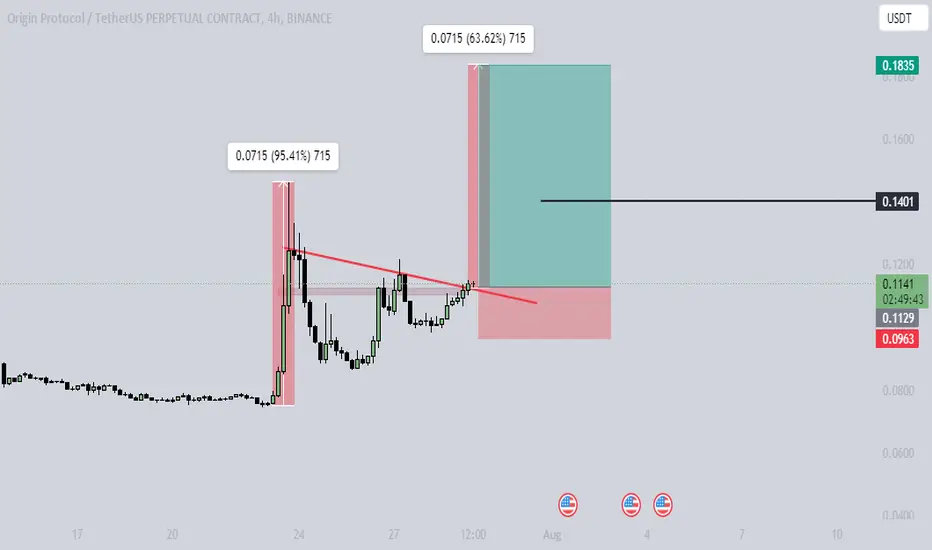
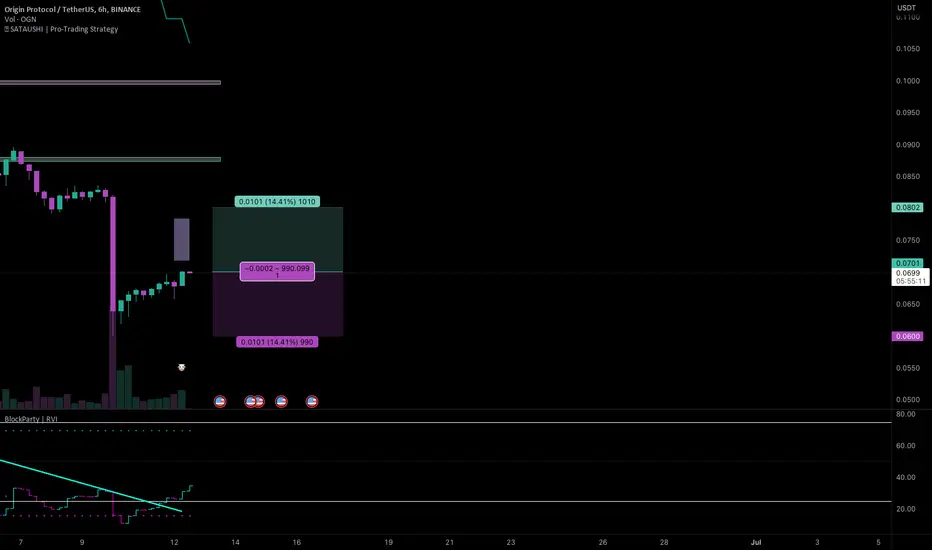
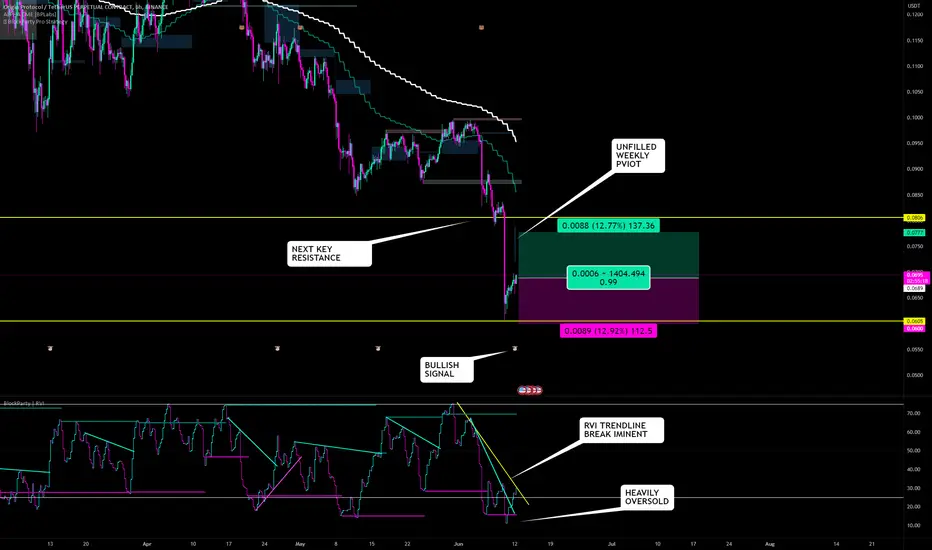
#OGN/USDT - Long - Potential 14.41%Risky long given the volatility of last week so trade with caution. Alts got murdered over the weekend and some dip buy opportunities are opening up.
Tether minted FWB:1BN USDT this morning so there is the possibility of rebound pump.
Direction: Long
Market: Spot
Risk: 0.25% - 1%
#USDT_OGN
Exchange: BINANCE
Timeframe: 360
TP1: 0.0802
Entry: 0.0701
STOP: 0.06
Entry Conditions:
| Oversold
| RVI Trendbreak
| Bullish pivot
TRADE OF THE DAY | OGN looking like nice bounce within rangeTRADE OF THE DAY | OGN looking like nice bounce within range
|TARGET ON CHART |
There has to be a bounce at some point right!? OGN seems to be showing some nice signs with being so heavily oversold and a nice untested weekly pivot the 1:1 take profit falls nicely with both the long term resistance (recent broken suport) along with sitting within the untested weekly pivot. We have a bullish signal flashed for long so we are going to pull the trigger here. There is an incredibly volatile week with fed announcements coming up so just beware that there is going to be some inevitable big movement incoming
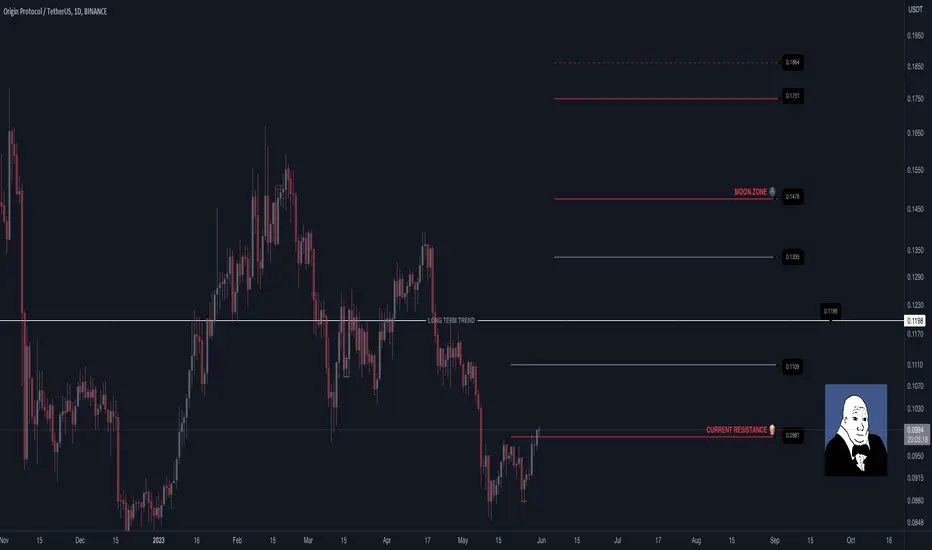
OGN - Pump Roadmap. I created this a while ago, these are various "interesting" levels that I noted as time had passed by, here - it seems we may begin some fun in the following months; so I decided to publish so I had an interactive personal reference.
If you find this helpful, or beneficial in any way, consider following me for more seldom content.
I hope you are watching!
-FMR
OGNUSDT BUY/l SETUPDYOR
OGN looking good to buy/long in Demand Zone
Invalid if price break support
GoodLuck guys !
*Follow for another Signal, free!
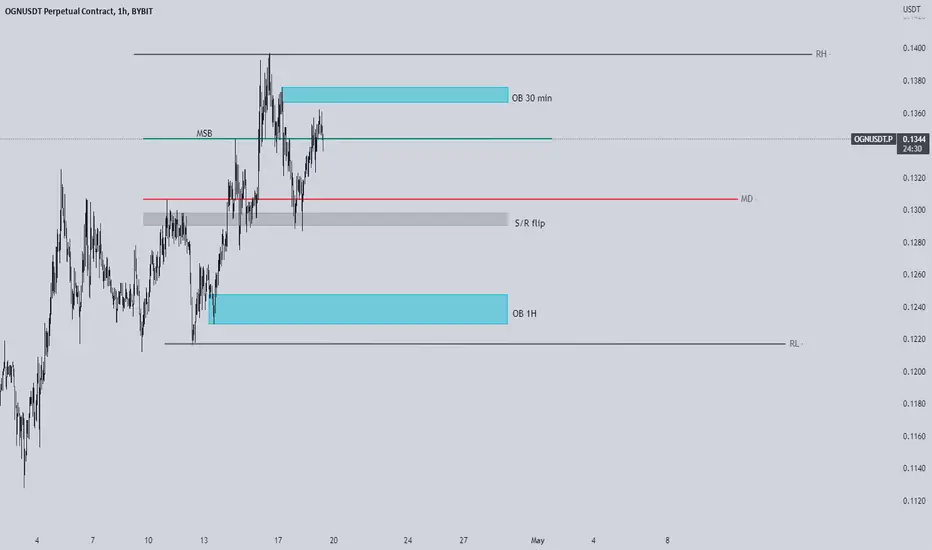
OGN chart markupI analyzed the OGNUSDT perpetual and markup the chart.... I drew all the key levels where price will react once it visit those marked up zones...
$OGNflip blue stop below blue target yellow then blue then just maybe yellow again
breaking out after the 5th of April 2021 so recon OGN whales have accumulated enough
hence should have a decent first impulse on this
when the market gives you an opportunity with a better set up do you hodl your fav shit coin or hop off for a bit ???
used to hop around a lot earlier eventually you miss out so trying to keep the balance and also still be in the game by not being too risk averse
in the words of buddha ,: attachement is the casue of all suffering ;)
approaching 200 ema on the daily for now where we should get a dip
cant seem to edit the graph downtrend line not spot on but hey you get the picture...

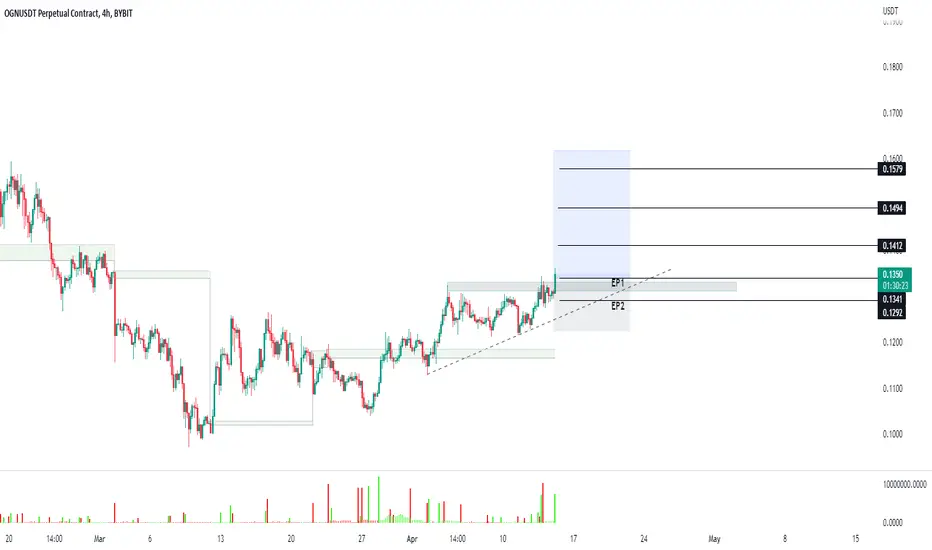
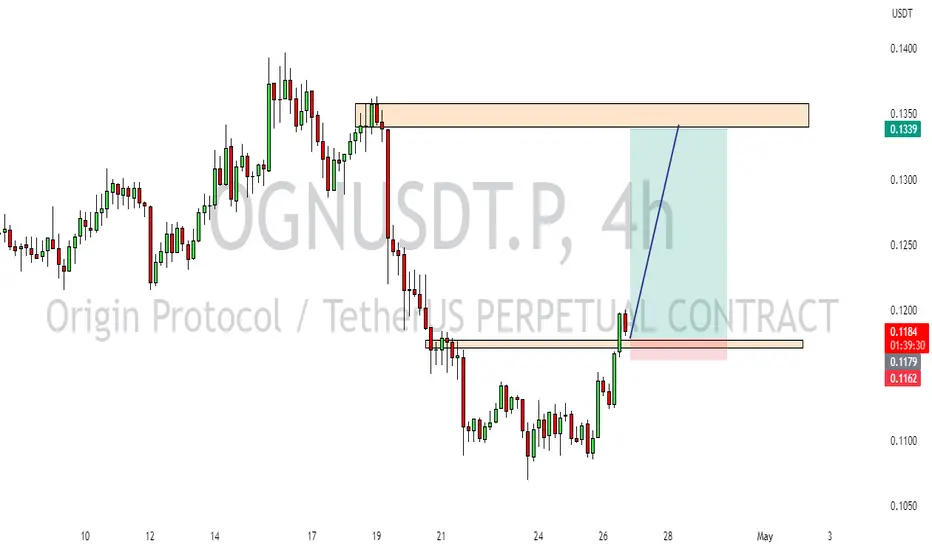
#OGN/USDT - Long - Potential 8.08%Direction: Long
Market: Spot
Risk: 0.25% - 1%
#USDT_OGN
Exchange: BINANCE
Timeframe: 360
TP1: 0.1431
Entry: 0.1324
STOP: 0.1217
Entry Conditions:
| Resistance break
| Volume
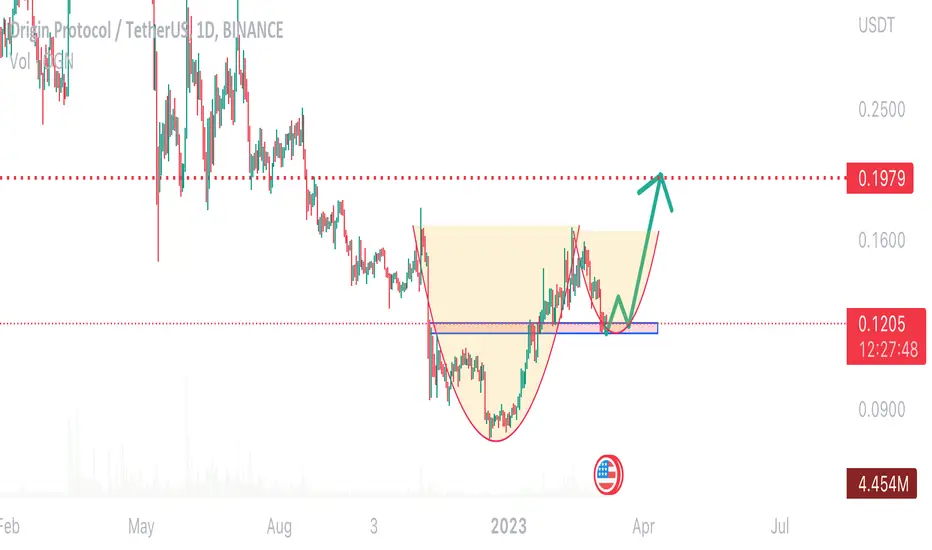
OGN Late pump in a cup and handle patternOGN is from the few coins that did not pump hard yet.
It is one of the future projects with great potential.
Holding on the big resistance could lead to a bull climb and result in 60% profit in few days.
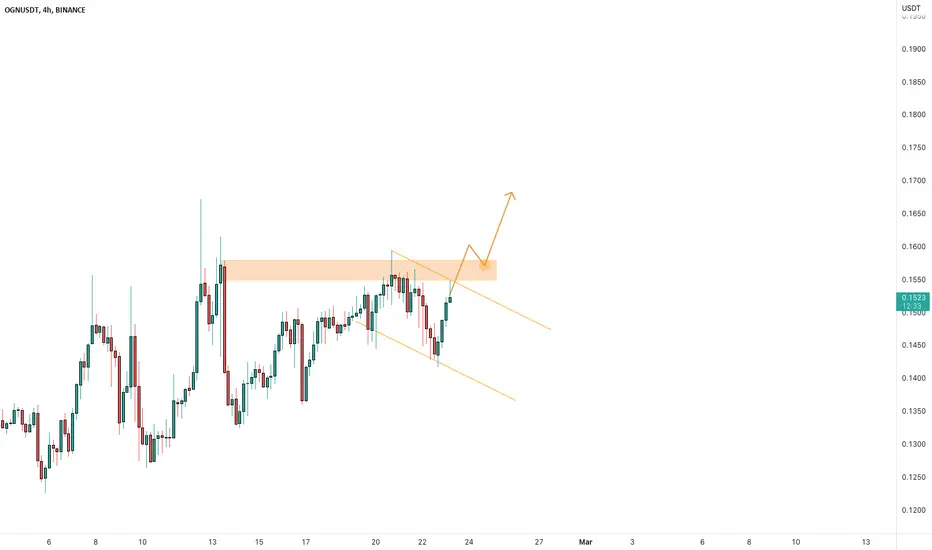
OGNUSDT needs the breakout!OGNUSDT is testing the descending channel below the static resistance level.
A descending channel is a technical analysis pattern that consists of two downward sloping trendlines. The upper trendline represents resistance, while the lower trendline represents support. In this case, the price of OGNUSDT is testing the lower trendline of the descending channel, which indicates a bearish trend.
Additionally, the static resistance level indicates an area where sellers are likely to take control of the price, making it difficult for buyers to push the price higher. If the price of OGNUSDT breaks above this level, it could signify a shift in momentum and the potential for a bullish trend.
To confirm a bullish trend, traders would need to wait for a breakout from the descending channel that satisfies Plancton's rules. Plancton's rules are a set of technical analysis guidelines that aim to identify high-probability trading opportunities. These rules include looking for strong trends, clear price patterns, and confirmation.
In summary, the current situation for OGNUSDT suggests a bearish trend within a descending channel below the static resistance level. Traders should watch for a breakout from the descending channel that satisfies Plancton's rules before entering a long position.
–––––
Follow the Shrimp 🦐
Keep in mind.
🟣 Purple structure -> Monthly structure.
🔴 Red structure -> Weekly structure.
🔵 Blue structure -> Daily structure.
🟡 Yellow structure -> 4h structure.
⚫️ Black structure -> <= 1h structure.
Follow the Shrimp 🦐
OGN ChartCurrently It's going with the trend. Let's see if it could go above the 200 EMA or not, till then i can't say anything.
#learning

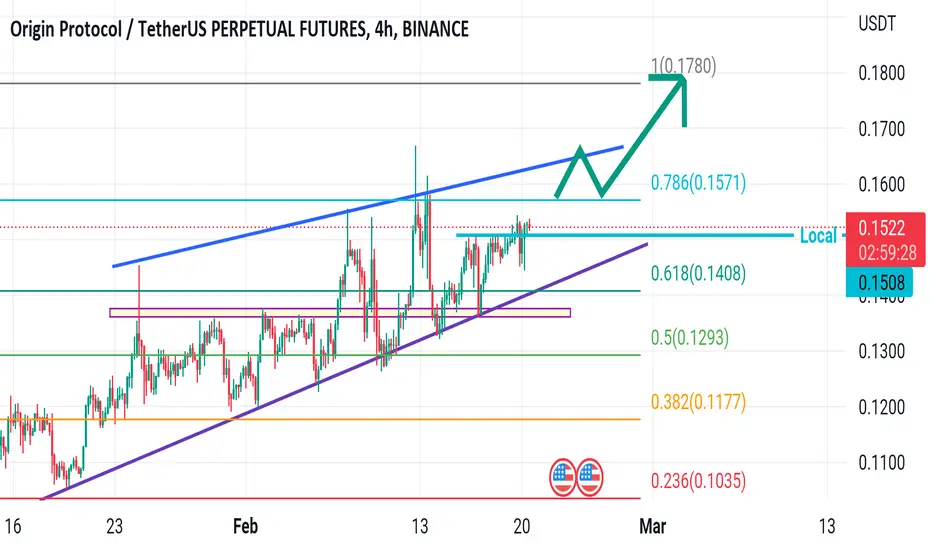
OGN / USDT Price Prediction OGN
If The Price Breaks 0.786 Fib Level ( OGN Price 0.1571 Level )
Then Good For Long
0.1508 To 0.148 Local Sport
0.1708 Is Weekly Highy Level