(2-hour timeframe for WTI Crude Oil (USOIL).(2-hour timeframe for WTI Crude Oil (USOIL)), here’s the technical analysis and target zones:
🟦 Key Observations:
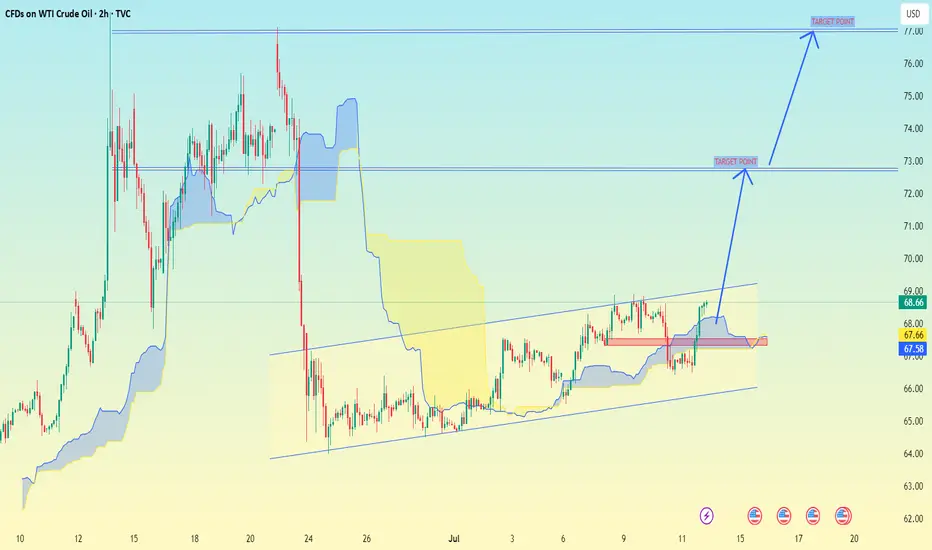
Price is trading in an ascending channel.
I'm using the Ichimoku Cloud for trend confirmation.
There are two clear target zones marked with arrows.
---
🎯 Target Levels (as shown on chart):
1. First Target Zone: ~$74.50
This is the intermediate resistance level.
Price is expected to break above ~$69, then head toward this zone.
2. Final Target Zone: ~$76.50–77.00
This is the major resistance area, possibly the upper end of a swing move.
Could be reached if momentum remains strong and no major reversal occurs.
---
📌 Current Price:
$68.66 (Sell) / $68.76 (Buy) — as of the screenshot.
📈 Suggested Strategy (based on the chart setup):
Entry: On breakout above ~$69.00 with volume confirmation.
First TP: ~$74.50
Second TP: ~$76.50–77.00
Stop-Loss: Below the lower channel support (~$66 or tighter, depending on your risk tolerance).
OILUSD trade ideas
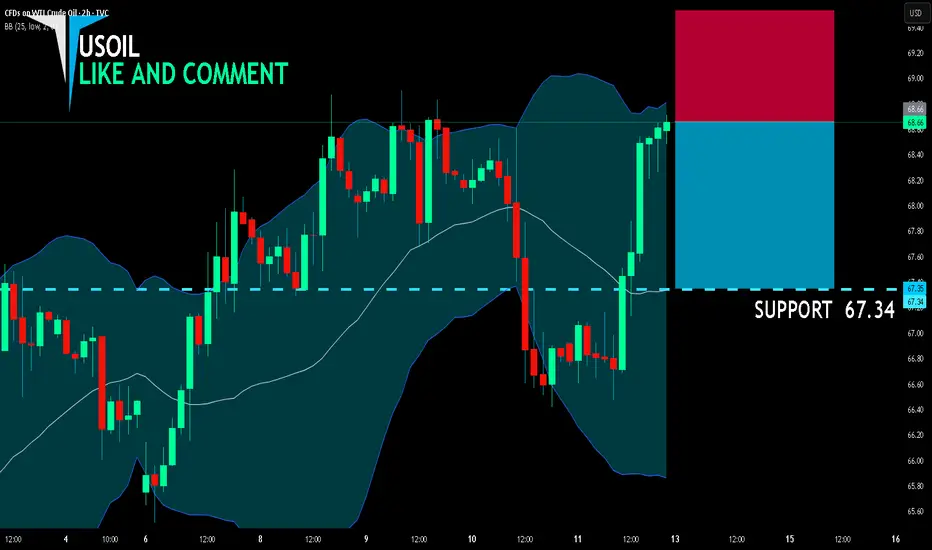
USOIL SENDS CLEAR BEARISH SIGNALS|SHORT
USOIL SIGNAL
Trade Direction: short
Entry Level: 68.66
Target Level: 67.34
Stop Loss: 69.53
RISK PROFILE
Risk level: medium
Suggested risk: 1%
Timeframe: 2h
Disclosure: I am part of Trade Nation's Influencer program and receive a monthly fee for using their TradingView charts in my analysis.
✅LIKE AND COMMENT MY IDEAS✅
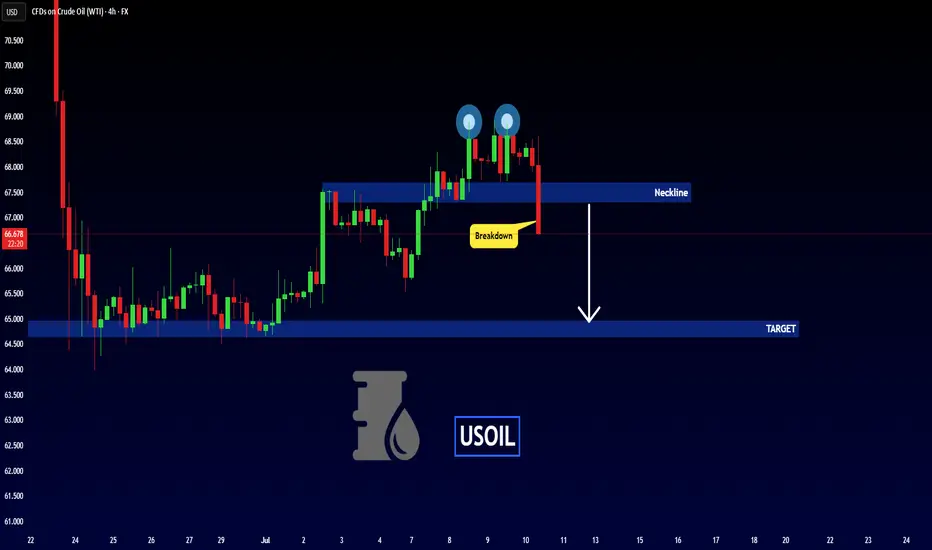
USOIL - Bearish Double TOPHello Traders !
The USOIL failed to create a new higher high.
The price formed a double top pattern.
Currently, The neckline is broken !
So, I expect a bearish move📉
________________
TARGET: 64.970🎯
CRUDE OIL (WTI): Will It Rise More?
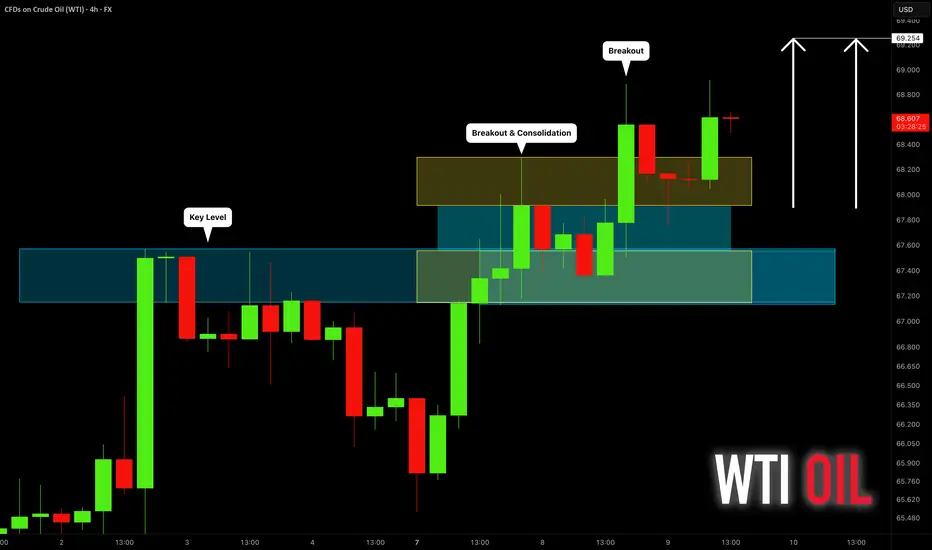
Quick update for my yesterday's analysis for WTI Crude Oil.
As I predicted yesterday, the price went up to the target.
We got one more strong bullish confirmation after a New York
session opening:
the price violated a resistance of a horizontal range on a 4H time frame.
I think that the market may rise even more and reach 69.25 level.
❤️Please, support my work with like, thank you!❤️
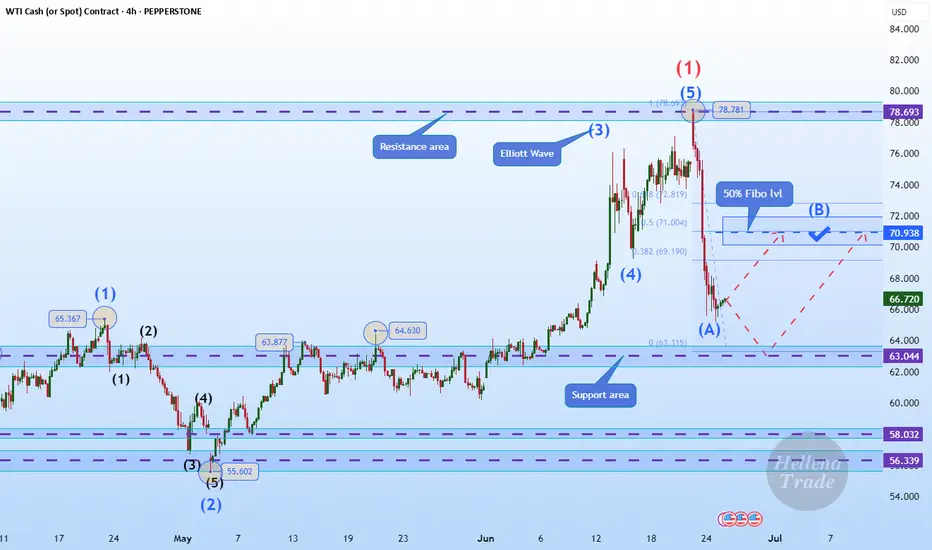
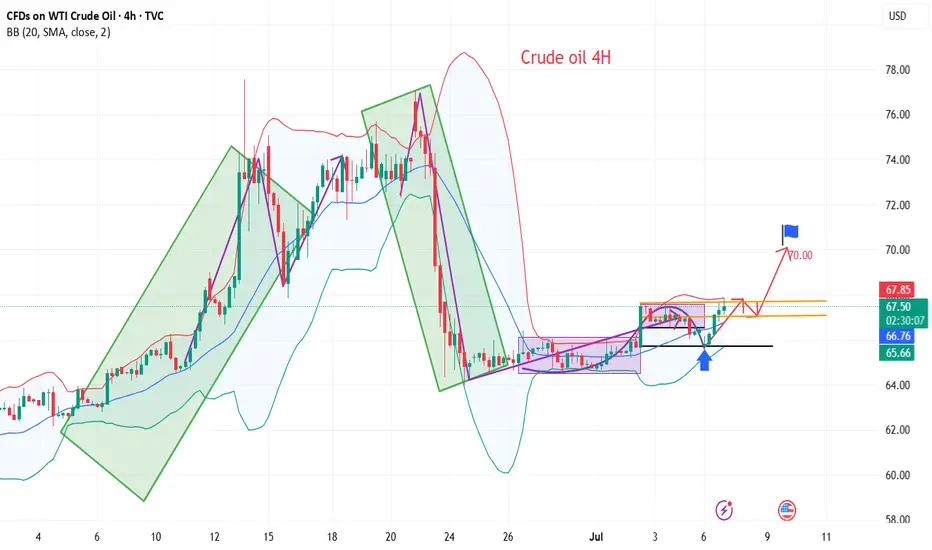
Hellena | Oil (4H): LONG to 50% lvl Fibo area of 70.00.Colleagues, after a long break, I think it is worth returning to oil forecasts. The situation is stabilizing a bit and now I think that the price is in a strong correction (ABC) at the moment I see wave “B”, which may reach the area of 50% Fibonacci 70 level.
It is possible that wave “A” will continue to develop towards the 62-63 area, but I still hope for an upward movement.
Manage your capital correctly and competently! Only enter trades based on reliable patterns!
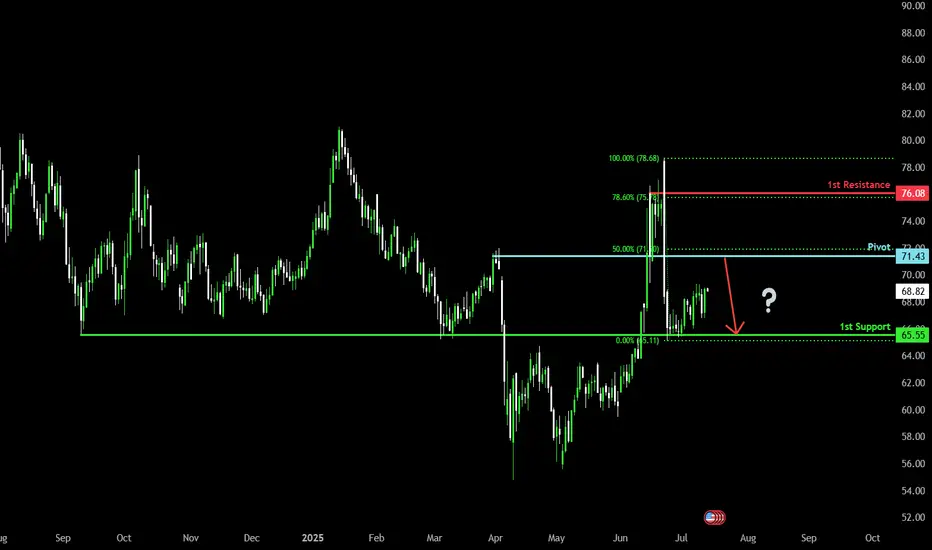
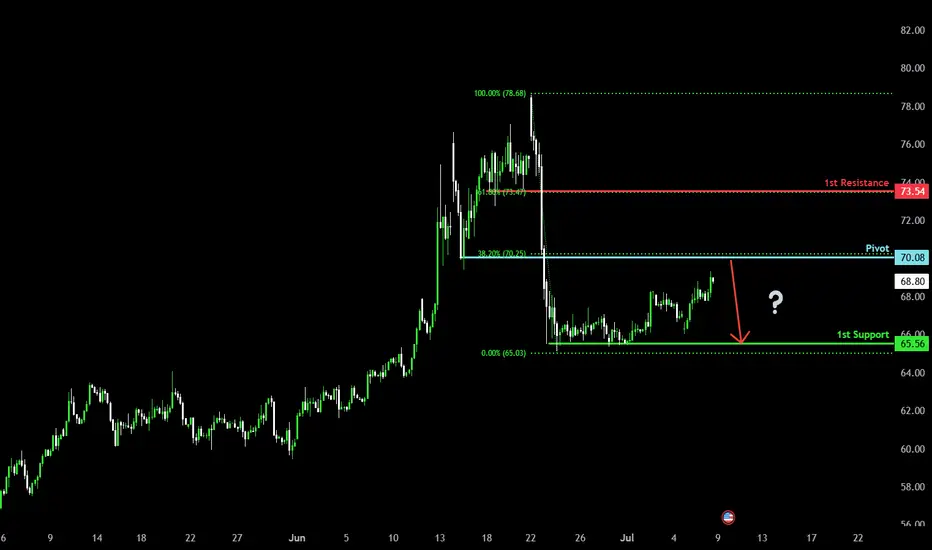
Heading into 50% Fibonacci resitance?WTI Oil (XTI/USD) is rising towards the pivot and could reverse to the 1st support.
Pivot: 71.43
1st Support: 65.55
1st Resistance: 76.08
Risk Warning:
Trading Forex and CFDs carries a high level of risk to your capital and you should only trade with money you can afford to lose. Trading Forex and CFDs may not be suitable for all investors, so please ensure that you fully understand the risks involved and seek independent advice if necessary.
Disclaimer:
The above opinions given constitute general market commentary, and do not constitute the opinion or advice of IC Markets or any form of personal or investment advice.
Any opinions, news, research, analyses, prices, other information, or links to third-party sites contained on this website are provided on an "as-is" basis, are intended only to be informative, is not an advice nor a recommendation, nor research, or a record of our trading prices, or an offer of, or solicitation for a transaction in any financial instrument and thus should not be treated as such. The information provided does not involve any specific investment objectives, financial situation and needs of any specific person who may receive it. Please be aware, that past performance is not a reliable indicator of future performance and/or results. Past Performance or Forward-looking scenarios based upon the reasonable beliefs of the third-party provider are not a guarantee of future performance. Actual results may differ materially from those anticipated in forward-looking or past performance statements. IC Markets makes no representation or warranty and assumes no liability as to the accuracy or completeness of the information provided, nor any loss arising from any investment based on a recommendation, forecast or any information supplied by any third-party.
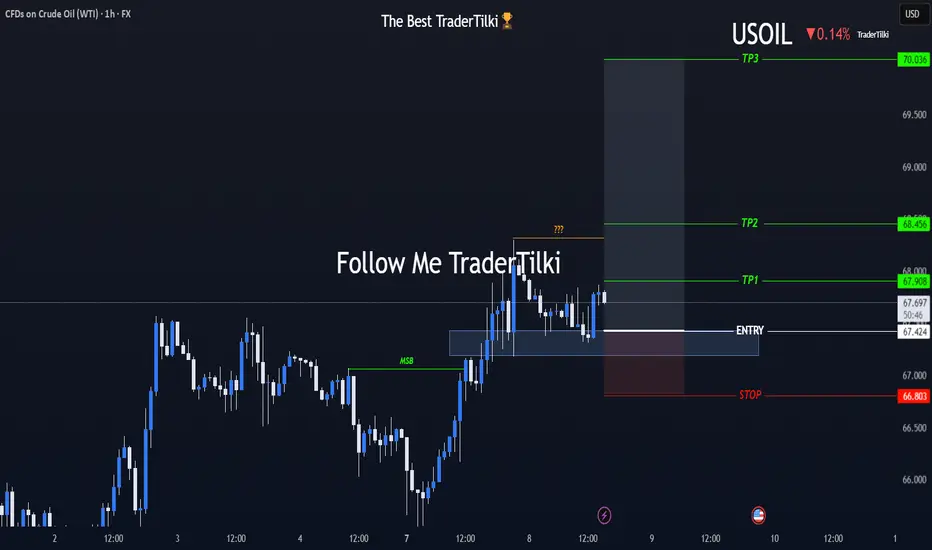
Strong USOIL Setup: Long from Support + 4.34 R/RHey Guys, hope you're all doing well!
I've placed a limit buy order on USOIL from a key support level. Below are the relevant levels for your reference:
- 🔵 Entry Level: 67.424
- 🔴 Stop Loss: 66.803
- 🟢 Target 1 (TP1): 67.908
- 🟢 Target 2 (TP2): 68.456
- 🟢 Target 3 (TP3): 70.036
📊 Risk/Reward Ratio: 4.34
Your likes and support are what keep me motivated to share these analyses consistently.
Huge thanks to everyone who shows love and appreciation! 🙏
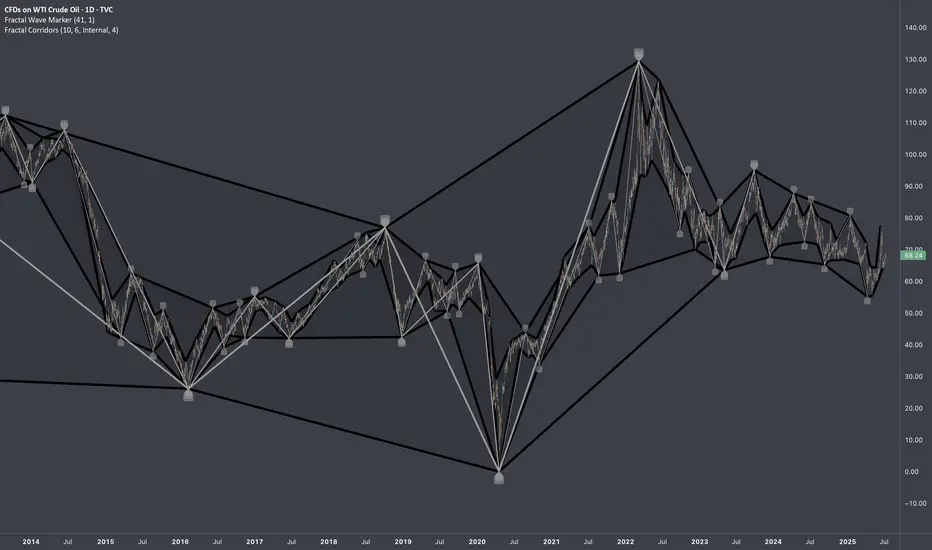
USOIL: Historic Full CyclesResearch Notes
Documenting historic examples of fractal loops for future references and research.
Fractal full cycles
70's; 80's; 90's
Late 90's & Early 00's
00's
10's
10's & 20's
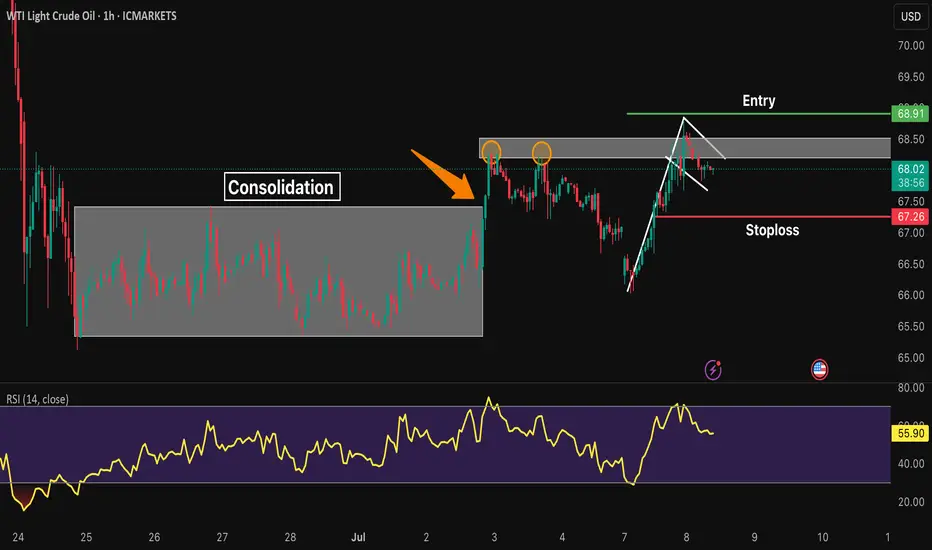
XTIUSD* Bullish Trend after consolidation box break.
* Bullish flag pattern is formed.
* Entry will be taken at the break of the pole.
* Stoploss is below the last HL.
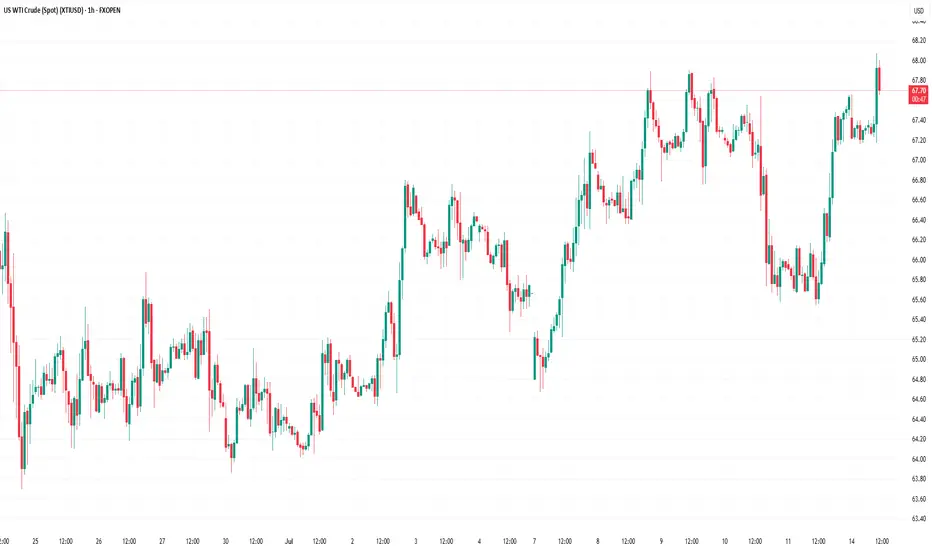
WTI Crude Oil Climbs Higher Amid Market OptimismMarket Analysis: WTI Crude Oil Climbs Higher Amid Market Optimism
WTI Crude Oil price climbed higher above $66.50 and might extend gains.
Important Takeaways for WTI Crude Oil Price Analysis Today
- WTI Crude Oil price started a decent increase above the $66.60 resistance levels.
- There was a break above a connecting bearish trend line with resistance at $67.15 on the hourly chart of XTI/USD at FXOpen.
Oil Price Technical Analysis
On the hourly chart of WTI Crude Oil at FXOpen, the price started a decent upward move from $65.50. The price gained bullish momentum after it broke the $66.50 resistance and the 50-hour simple moving average.
The bulls pushed the price above the $67.00 and $67.50 resistance levels. There was a break above a connecting bearish trend line with resistance at $67.15.
The recent high was formed at $67.63 and the price started a downside correction. There was a minor move toward the 23.6% Fib retracement level of the upward move from the $65.54 swing low to the $67.63 high.
The RSI is now above the 60 level. Immediate support on the downside is near the $67.15 zone. The next major support on the WTI Crude Oil chart is near the $66.60 zone or the 50% Fib retracement level, below which the price could test the $65.50 level. If there is a downside break, the price might decline toward $64.70. Any more losses may perhaps open the doors for a move toward the $63.50 support zone.
If the price climbs higher again, it could face resistance near $67.85. The next major resistance is near the $70.00 level. Any more gains might send the price toward the $72.50 level.
This article represents the opinion of the Companies operating under the FXOpen brand only. It is not to be construed as an offer, solicitation, or recommendation with respect to products and services provided by the Companies operating under the FXOpen brand, nor is it to be considered financial advice.
US OIL LONG POSITION After the very strong dump in Oil from the major resistance Trendline and zone, but also held and showed signs of rejection from the DTF Support.
I decided to open a Long Position and it's still running, so we'll see how long it can run.
Crude oil continues to fluctuate upward
💡Message Strategy
OPEC+, led by Asian countries, announced on Saturday that it would increase production by an additional 548,000 barrels per day from next month, more than 30% higher than market expectations of 411,000 barrels per day, accelerating the pace of resumption of production after the production cuts in 2023.
In addition to supply-side factors, demand prospects are also affected by trade concerns. U.S. Commerce Secretary Howard Lutnick said that the country-specific tariffs that the Trump administration intends to implement will officially take effect on August 1, later than the previously scheduled July 9, leaving trading partners with a short breathing space.
Market concerns about the impact of this policy on crude oil consumption have intensified, especially among importing countries, mainly Asian countries.
Confidence in the Asian market remains, and Saudi Arabia raises prices to Asia
Despite the increase in supply, OPEC+ still emphasized in its statement that "the global economic outlook is stable and the market fundamentals are healthy." As a signal of confidence, Saudi Arabia has raised the prices of major crude oil varieties for Asian customers, indicating that it believes that the Asian market has the ability to absorb additional supply.
According to OPEC+ representatives, the alliance will consider whether to increase supply by another 548,000 barrels per day in September at its next meeting on August 3, thereby fully restoring the 2.2 million barrels per day quota cut last year.
📊Technical aspects
From the daily chart level, crude oil fluctuates upward and tests around 75 in the medium term. The K-line closes with a large real negative line, which has not yet destroyed the moving average system and is still supported. The medium-term objective trend remains upward. However, from the perspective of momentum, the MACD indicator crosses downward above the zero axis, indicating that the bullish momentum is weakened. It is expected that the medium-term trend of crude oil will fall into a high-level oscillation pattern.
After the short-term (4H) trend of crude oil fluctuates and consolidates, it turns into an upward rhythm. The moving average system is arranged in short positions, and the short-term objective trend is upward. The MACD indicator fast and slow lines cross the zero axis, and the bullish momentum is full. It is expected that the crude oil trend will continue to rise after a slight rebound during the day.
💰Strategy Package
Long Position:66.00-67.00,SL:65.00,Target:69.00-70.00
Bearish reversal off 38.2% Fibonacci resistance?WTI Oil (XTI/USD) is rising towards the pivot and could reverse to the 1st support which is a pullback support.
Pivot: 70.08
1st Support: 65.56
1st Resistance: 73.54
Risk Warning:
Trading Forex and CFDs carries a high level of risk to your capital and you should only trade with money you can afford to lose. Trading Forex and CFDs may not be suitable for all investors, so please ensure that you fully understand the risks involved and seek independent advice if necessary.
Disclaimer:
The above opinions given constitute general market commentary, and do not constitute the opinion or advice of IC Markets or any form of personal or investment advice.
Any opinions, news, research, analyses, prices, other information, or links to third-party sites contained on this website are provided on an "as-is" basis, are intended only to be informative, is not an advice nor a recommendation, nor research, or a record of our trading prices, or an offer of, or solicitation for a transaction in any financial instrument and thus should not be treated as such. The information provided does not involve any specific investment objectives, financial situation and needs of any specific person who may receive it. Please be aware, that past performance is not a reliable indicator of future performance and/or results. Past Performance or Forward-looking scenarios based upon the reasonable beliefs of the third-party provider are not a guarantee of future performance. Actual results may differ materially from those anticipated in forward-looking or past performance statements. IC Markets makes no representation or warranty and assumes no liability as to the accuracy or completeness of the information provided, nor any loss arising from any investment based on a recommendation, forecast or any information supplied by any third-party.
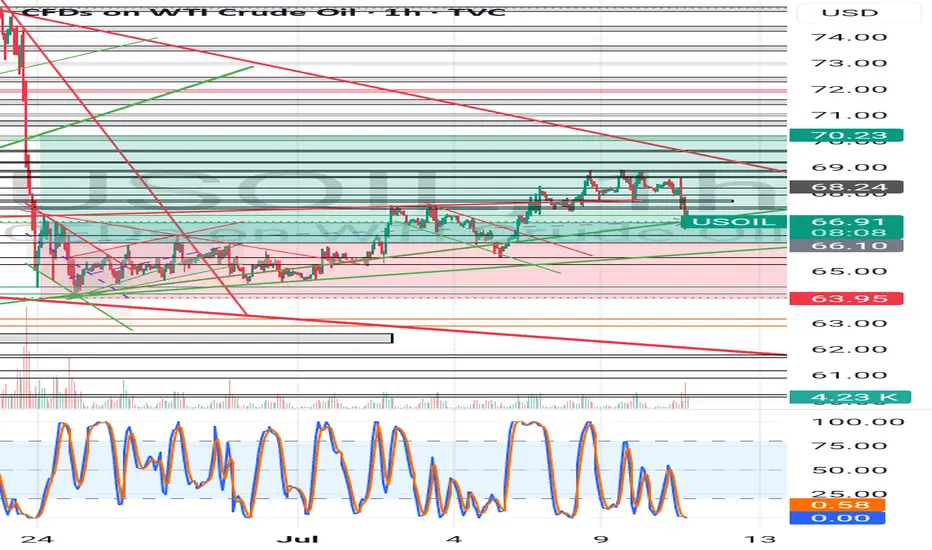
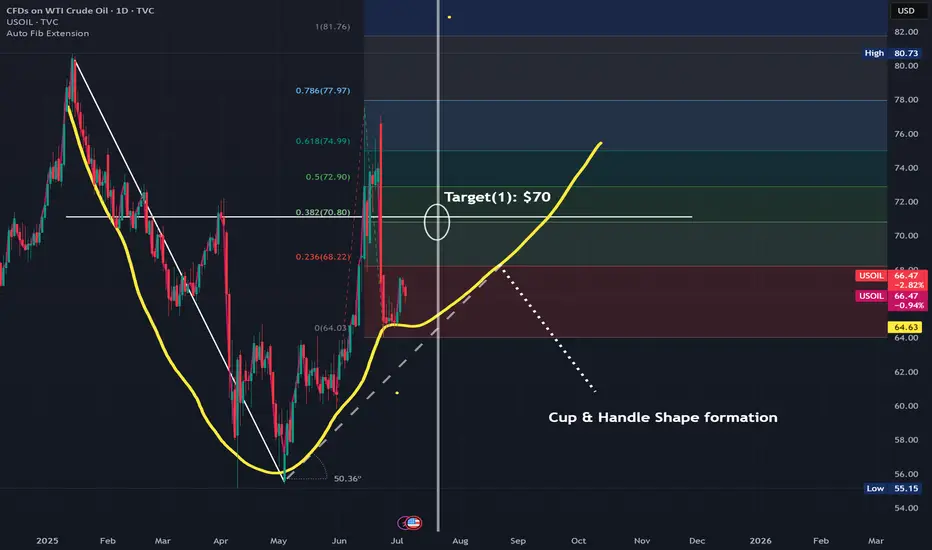
US Oil - July WK#2 ExpectationsNYSE:TVC :
USOIL Last trade close @ $66.5.
Expected to start the week @ $68.xx.
The formation of cup & handle shape lead to continuous increase to start hitting 1st Target @ $70.
Trump will announce Tariffs implementation will support increasing prices.
Could OIL Slide to $60? a 5% Drop Might Be on the Table? Hey Realistic Traders!
Price action is weakening. Will USOIL find support or slide further?
Let’s Break It Down..
On the 4H timeframe, oil has formed a double top pattern followed by a neckline breakout, which is a classic sign of a potential shift from a bullish to a bearish trend.
This breakout was confirmed by a break below the bullish trendline, accompanied by consecutive bearish full-body candlesticks that reinforce the bearish momentum. Afterward, the price formed a bearish continuation pattern known as a rising wedge, which was followed by a breakdown.
The combination of bearish reversal and continuation pattern breakouts signals further downside movement and confirms the shift into a bearish trend.
Therefore, we foresee the price forming lower lows and lower highs toward the first target at 63.21, with a potential extension to the close the gap at 60.73.
The bearish outlook remains valid as long as the price stays below the key stop-loss level at 69.66.
Support the channel by engaging with the content, using the rocket button, and sharing your opinions in the comments below.
Disclaimer: This analysis is for educational purposes only and should not be considered a recommendation to take a long or short position on USOIL.

WTI USOIL WTI oil Prices are supported by supply cuts and production adjustments but tempered by inventory levels and economic concerns.
The market remains sensitive to geopolitical developments, OPEC+ policies, and US economic data.
#oil
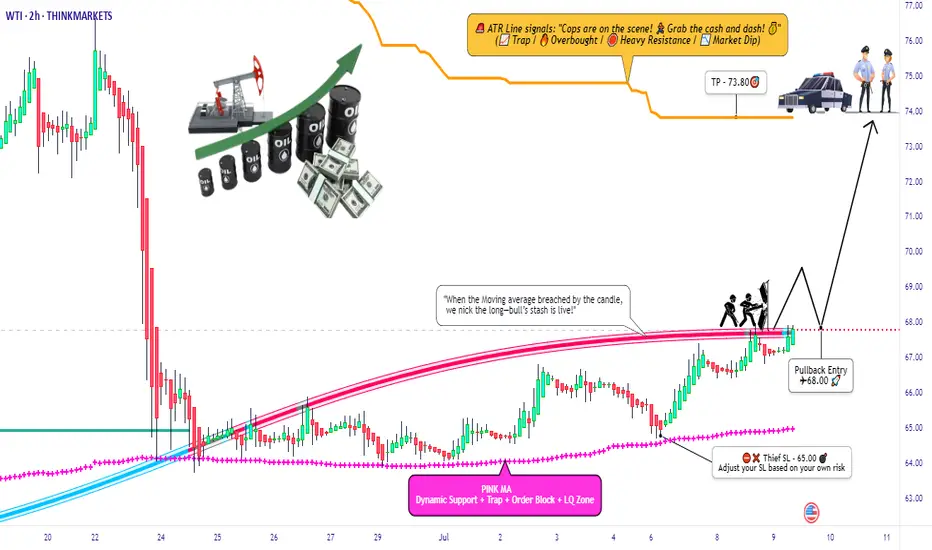
WTI Oil Heist: Bullish Breakout Plan for Big Gains!🚨 Ultimate WTI Oil Heist Plan: Bullish Breakout Strategy for Big Profits! 🚀💰
🌟 Hello, Wealth Chasers & Market Mavericks! 🌟
Hola, Bonjour, Hallo, Marhaba! 🗺️
Get ready to execute the Ultimate WTI / US Oil Spot Heist using our 🔥 Thief Trading Style 🔥, blending sharp technicals with powerful fundamentals! 📈💡 This swing trade plan targets the energy market’s bullish potential, but stay sharp—volatility lurks! 🚨 Follow the chart setup for a long entry, and let’s aim for those juicy profits while dodging the high-risk ATR zone where the market “police” might trap overzealous traders. 🏦⚠️
📊 The Heist Plan: WTI / US Oil Spot (Swing Trade)
Entry 📈:
The breakout is your signal! 🎯 Wait for the Moving Average crossover and a confirmed pullback at $68.00 on the 2H timeframe. Once it triggers, go long and ride the bullish wave! 🐂 Set an alert to catch the breakout in real-time. 🚨
Stop Loss 🛑:
Protect your capital like a pro! 💪 Place your stop loss below the recent swing low at $65.00 (2H timeframe, candle body wick). Adjust based on your risk tolerance, lot size, and number of positions. Rebels, beware—straying too far from this level could burn you! 🔥
Target 🎯:
Aim for $73.80 or exit early if momentum fades. Scalpers, stick to long-side trades and use a trailing stop to lock in gains. 💰 Swing traders, follow the plan and secure profits before the market consolidates or reverses. 🏴☠️
📊 Market Context & Key Drivers
The WTI / US Oil Spot market is currently consolidating with a bullish bias 🐂, driven by:
Fundamentals: Check macroeconomic data, seasonal trends, and intermarket correlations. 📉
COT Report: shows net-long positions increasing, signaling bullish sentiment. 📅
Sentiment & Quantitative Analysis: Market mood leans positive, but overbought risks loom near the ATR zone. ⚠️
Stay informed! 📰 Monitor news releases, as they can spike volatility. Avoid new trades during major announcements and use trailing stops to protect open positions. 🔒
📊 Pro Tips for the Heist
Scalpers: Go long with tight trailing stops to safeguard profits. 💸
Swing Traders: Stick to the plan, adjust stops based on risk, and exit before the high-risk ATR zone ($73.80+). 🚪
Risk Management: Never risk more than you can afford. Tailor your lot size and stop loss to your account size. 🛡️
Stay Updated: Market conditions shift fast—keep an eye on fundamentals and sentiment to stay ahead. 👀
📊 Why Join the Heist?
This Thief Trading Style plan is your ticket to navigating the WTI market with confidence! 💪 Boost this idea to strengthen our trading crew and share the wealth-making vibe. 🚀💥 Like, follow, and stay tuned for more high-octane strategies! 🤑🐱👤
Disclaimer: This is a general market analysis, not personalized investment advice. Always conduct your own research and consider your risk tolerance before trading. Markets are dynamic—stay vigilant and adapt to new developments. 📡
Let’s make this heist legendary! 🌟💰 See you at the next breakout! 🤝🎉
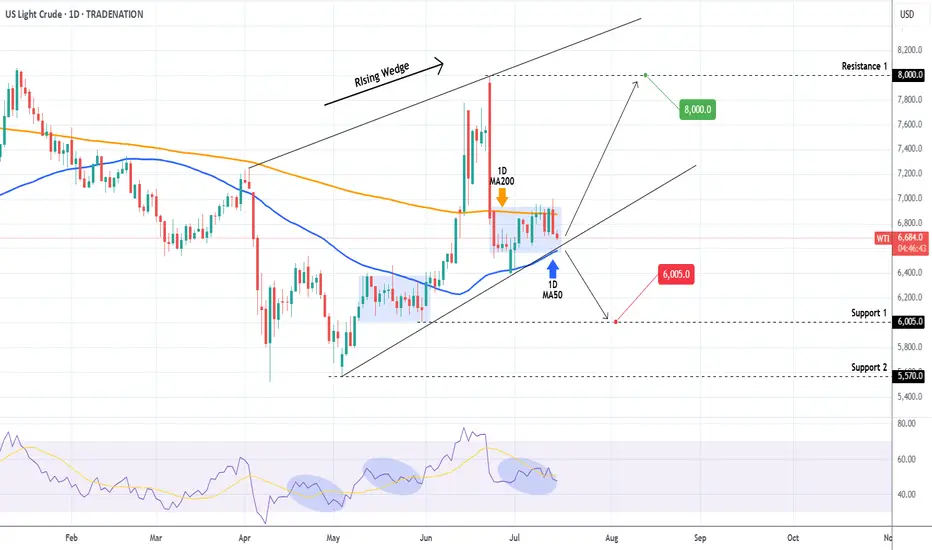
WTI OIL Is it forming a bottom?WTI Oil (USOIL) Has been trading within a Rising Wedge pattern and since June 02, it has turned its 1D MA50 as a Support. Technically the recent 2-week consolidation within the 1D MA50 (blue trend-line) and 1D MA200 (orange trend-line) is a bottom formation on the Higher Lows trend-line of the Rising Wedge.
As long as the 1D MA50 holds, we remain bullish, targeting $80.00 (Resistance 1). If the 1D MA50 breaks (closes a 1D candle below it), we will take the loss, and turn bearish instead, targeting $60.05 (Support 1).
-------------------------------------------------------------------------------
** Please LIKE 👍, FOLLOW ✅, SHARE 🙌 and COMMENT ✍ if you enjoy this idea! Also share your ideas and charts in the comments section below! This is best way to keep it relevant, support us, keep the content here free and allow the idea to reach as many people as possible. **
-------------------------------------------------------------------------------
Disclosure: I am part of Trade Nation's Influencer program and receive a monthly fee for using their TradingView charts in my analysis.
💸💸💸💸💸💸
👇 👇 👇 👇 👇 👇
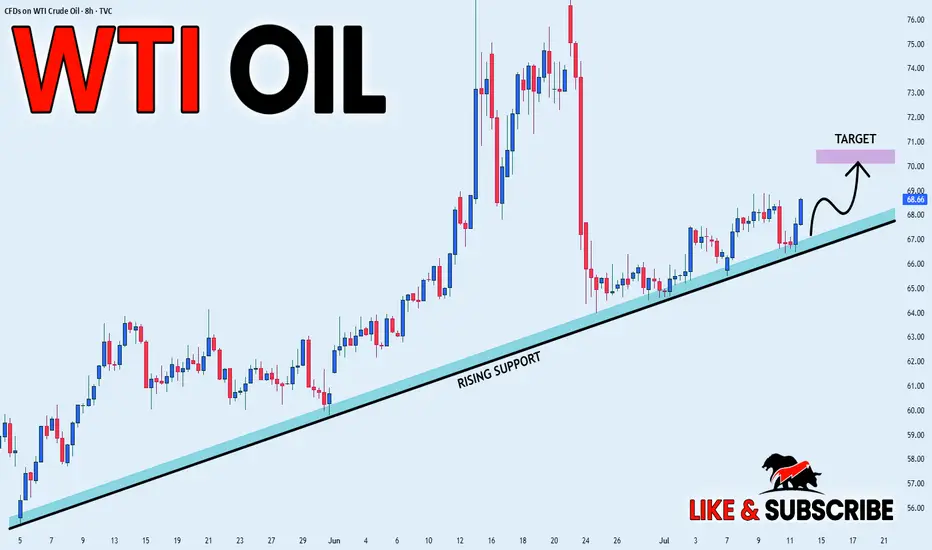
USOIL RISKY LONG|
✅CRUDE OIL is trading along
The rising support line
And as the price is going up now
After the retest of the line
I am expecting the price to keep growing
To retest the supply levels above at 70.20$
LONG🚀
✅Like and subscribe to never miss a new idea!✅
Disclosure: I am part of Trade Nation's Influencer program and receive a monthly fee for using their TradingView charts in my analysis.
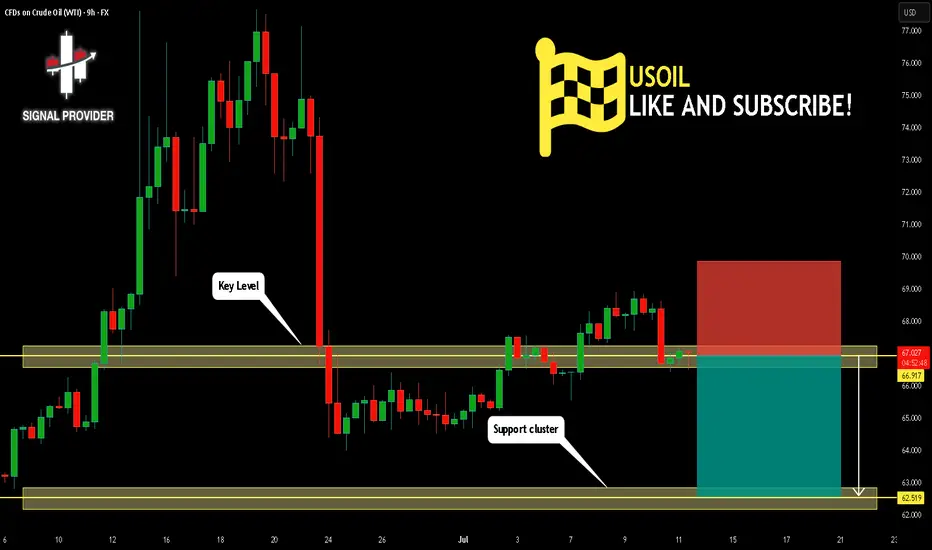
USOIL Will Go Lower! Short!
Please, check our technical outlook for USOIL.
Time Frame: 9h
Current Trend: Bearish
Sentiment: Overbought (based on 7-period RSI)
Forecast: Bearish
The price is testing a key resistance 66.917.
Taking into consideration the current market trend & overbought RSI, chances will be high to see a bearish movement to the downside at least to 62.519 level.
P.S
Please, note that an oversold/overbought condition can last for a long time, and therefore being oversold/overbought doesn't mean a price rally will come soon, or at all.
Disclosure: I am part of Trade Nation's Influencer program and receive a monthly fee for using their TradingView charts in my analysis.
Like and subscribe and comment my ideas if you enjoy them!
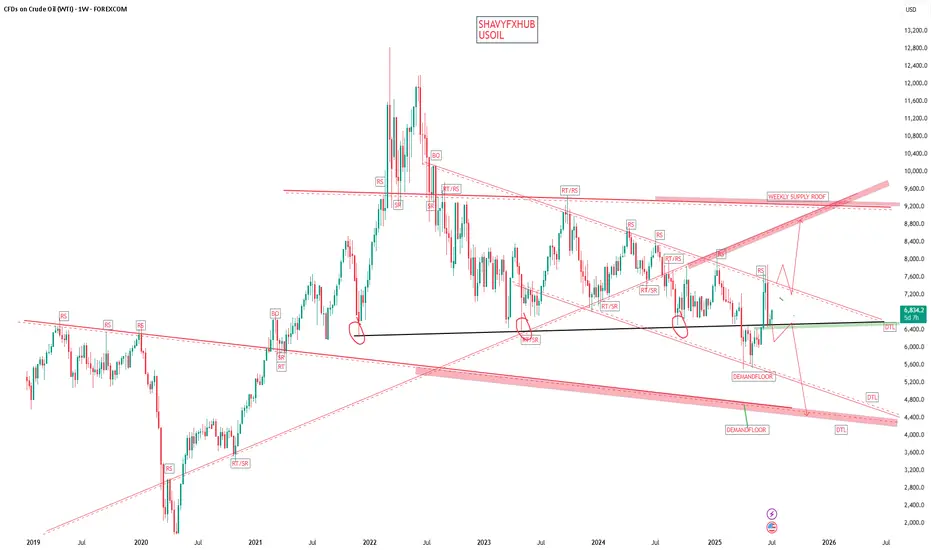
WTI USOIL WTI oil ,watch oil inventory and opec data report for clear directional bias . if the monthly candle closes above the supply roof,it will be a long confirmation if demand holds .the probability of rejection is high, because the current candle is coming as a retest candle to broken demand floor that served as bench mark oil price level 65$-68$ zone for long time .
#oil #opec #usoil #wti

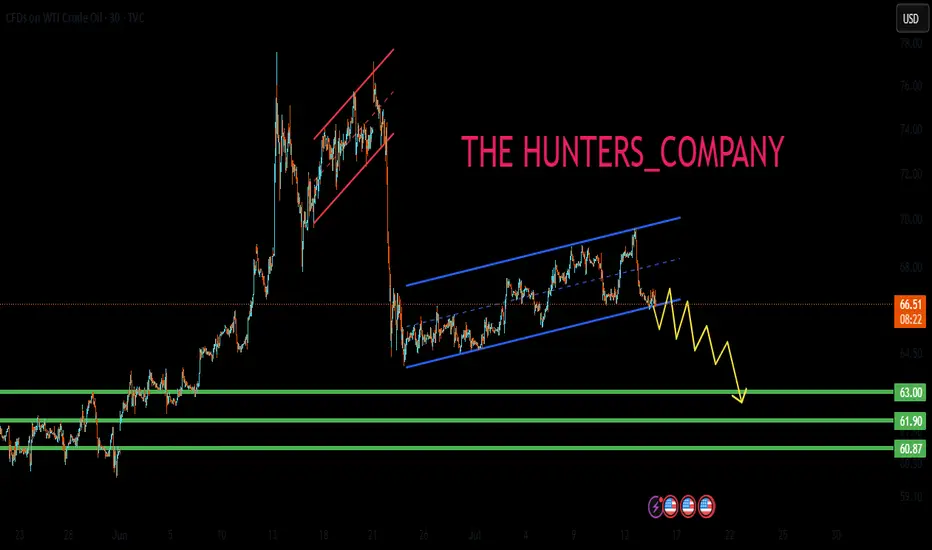
US OIL SELL...Hello friends🙌
🔊As you can see, this chart works well in forming a channel, and now that
we have witnessed a price drop, the price has reached the bottom of the channel, and given the previous heavy drop, the channel shows that the power is currently in the hands of sellers and it is likely that the specified targets will move.
🔥Follow us for more signals🔥
Trade safely with us
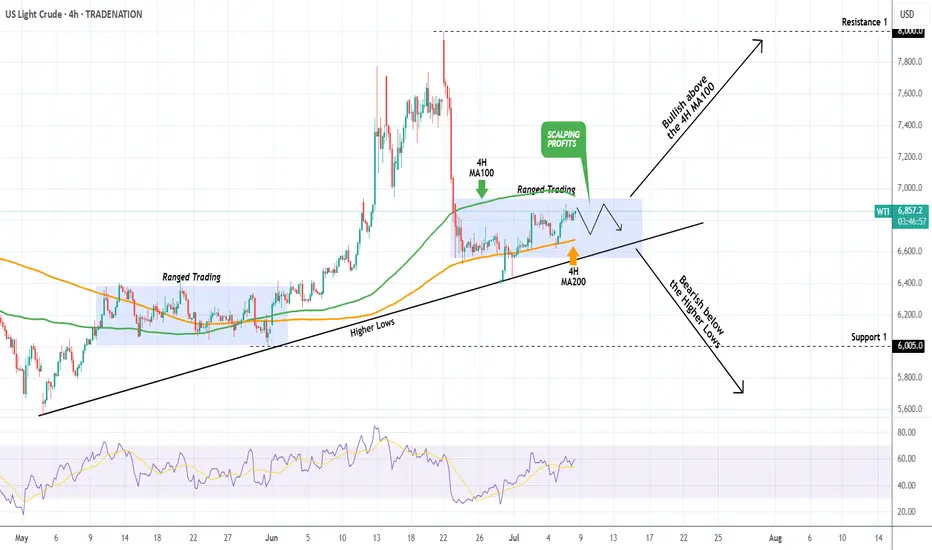
WTI OIL Best scalping opportunity at the moment!WTI Oil (USOIL) has been consolidating inside a ranged trading set-up, with the 4H MA100 (green trend-line) as its Resistance and the 4H MA200 (orange trend-line) as its Support.
We saw this previously from May 13 to June 01 and it presents the best scaling opportunity in the market at the moment. That previous Ranged Trading pattern eventually broke upwards as the Higher Lows trend-line held.
As a result, after you get your scalping profits within this range, look for a clear break-out above the 4H MA100 (candle closing) in order to go long (Resistance 1) or a break-out below the Higher Lows (candle closing) in order to go short (Support 1).
-------------------------------------------------------------------------------
** Please LIKE 👍, FOLLOW ✅, SHARE 🙌 and COMMENT ✍ if you enjoy this idea! Also share your ideas and charts in the comments section below! This is best way to keep it relevant, support us, keep the content here free and allow the idea to reach as many people as possible. **
-------------------------------------------------------------------------------
Disclosure: I am part of Trade Nation's Influencer program and receive a monthly fee for using their TradingView charts in my analysis.
💸💸💸💸💸💸
👇 👇 👇 👇 👇 👇