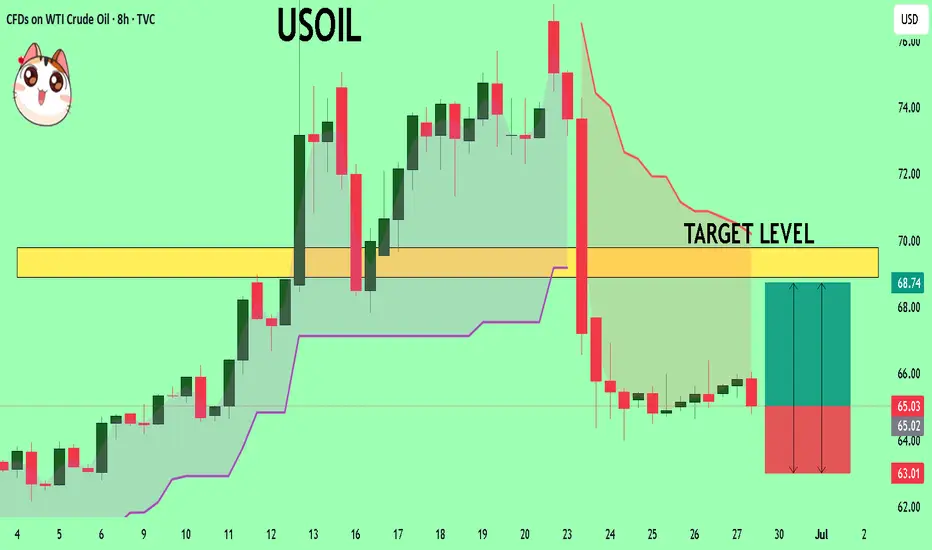
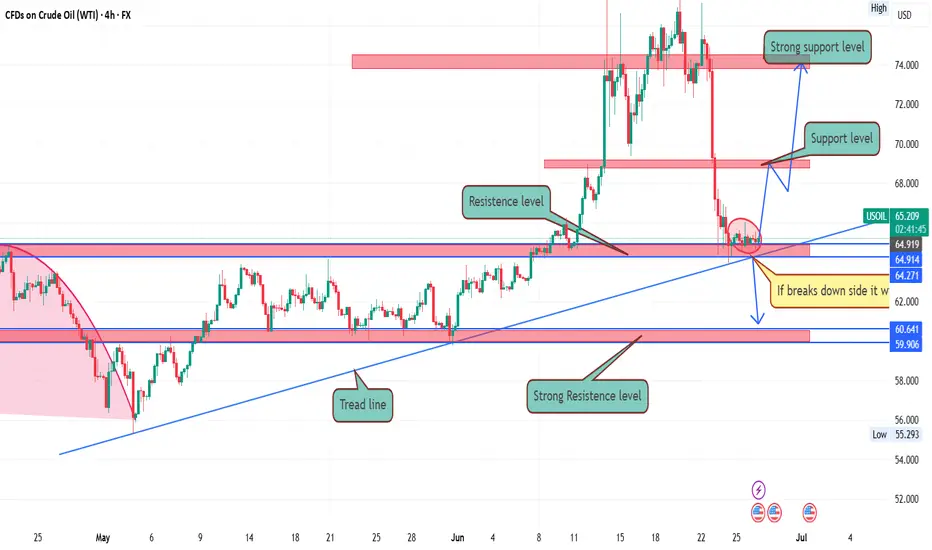
USOIL TVC:USOIL :
if it break above the purple line and shows a accumulation. so I am going to buy it.
but if it doesn't I will not open trade on it.
OILUSD trade ideas
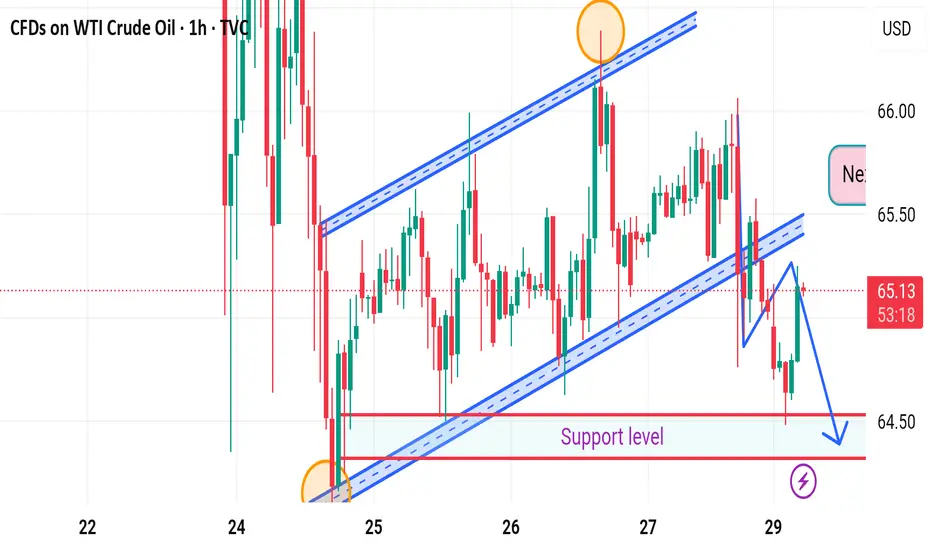
Market next move 🔄 Disruption Analysis: Contrarian View
⚠️ Original Viewpoint Summary:
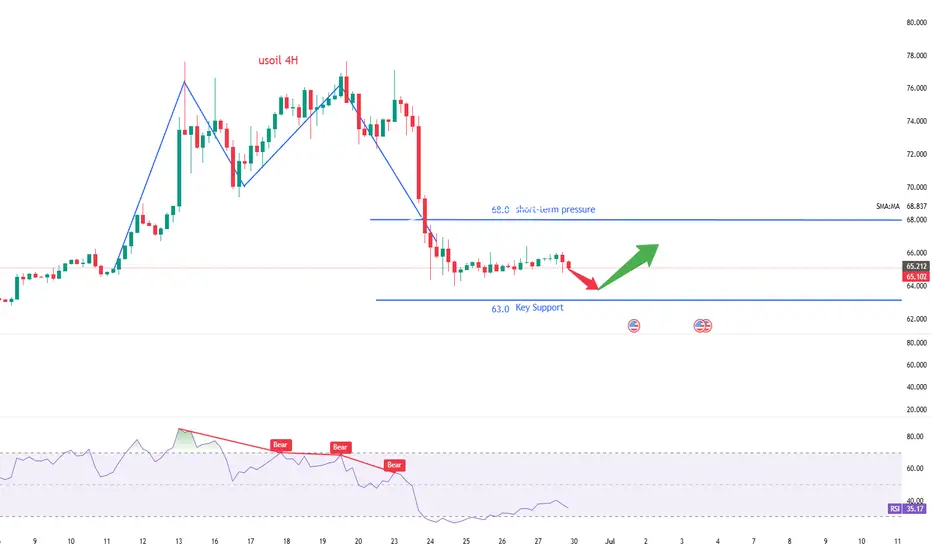
The original analysis suggests a bearish breakdown from the rising channel, with a short-term target of 64.36, pointing to a move towards the support zone.
---
📉 Disrupted (Contrarian) Perspective:
🔁 Fakeout Scenario Possibility:
The sharp drop below the trendline may be a bear trap.
Price quickly bounced back into the channel region, showing buyer interest near the support.
🔎 Key Observations:
Wick rejection near the lower support suggests that demand is active around 64.50–64.36 zone.
The structure of higher lows is still valid unless there's a confirmed close below the support box.
Momentum indicators (not shown) may help validate whether this is a temporary pullback or a deeper correction.
📈 Alternative Projection:
If price holds above the support zone, it could rebound back to test 65.50–65.80 resistance.
A false breakdown followed by consolidation may lead to retest of the upper channel (near 66.00).
---
🧭 Revised Strategy Suggestion:
Avoid early shorts unless there is a confirmed candle close below 64.36.
Watch for bullish price action near support (hammer, engulfing) for a potential long re-entry.
Reevaluate if WTI forms a base around 64.40 — possible reversal setup.
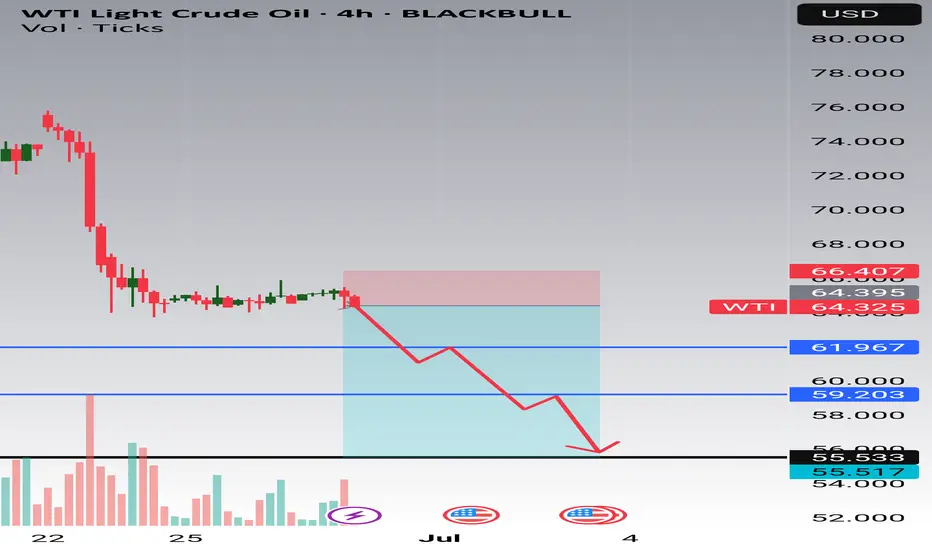
WTI will most likely fall to 55.There will be a lot of oil on the market in next few weeks. Im expecting a sharp fall on WTI after this consolidation and the most likely level which can hold is 55 weekly level. All lines represents target levels. If you decided to trade this idea, TP partially, use proper sizing. Wish you good luck.
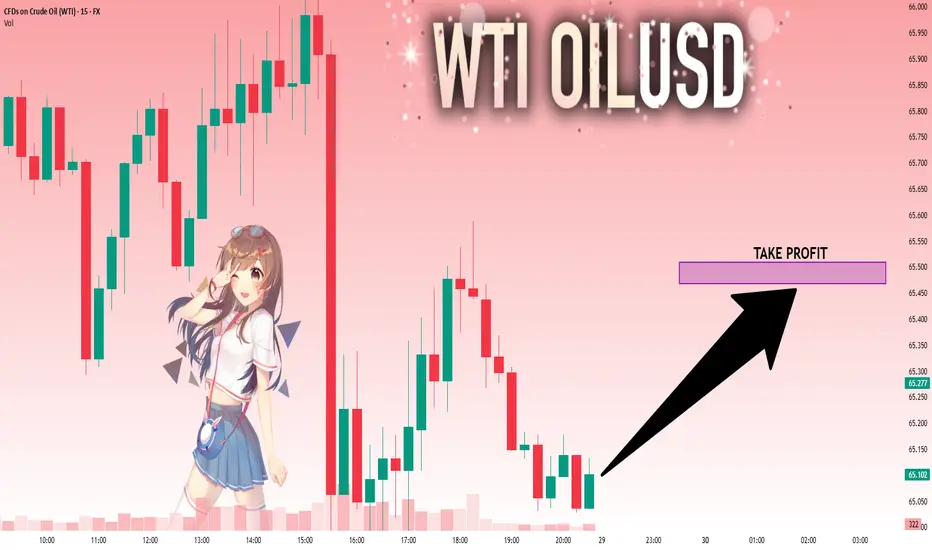
Bulls on the Loose: US Oil Spot/WTI Heist Strategy! 🚨💰 THE OIL VAULT HEIST: US OIL SPOT/WTI TRADING STRATEGY 💸🔫
🌟Hi! Hola! Ola! Bonjour! Hallo! Marhaba!🌟
Dear Money Makers & Robbers 🤑💰💸✈️
Based on our 🔥Thief Trading style analysis🔥 (both technical and fundamental), here’s the master plan to heist the US Oil Spot/WTI Energy Market. Follow the blueprint carefully—this strategy focuses on long entries, with a daring escape planned near the high-risk Red ATR line Zone where bearish robbers and consolidation traps await. 🏆💸 Take your profit and treat yourself, fellow traders—you earned it! 💪🏆🎉
🕵️♂️ Entry 📈
💥 The vault is wide open! Time to swipe that bullish loot—heist is on!
Place buy limit orders within the 15 or 30-minute timeframe, near swing lows/highs for pullback entries.
🛑 Stop Loss 🛑
📍 Thief’s SL—recent swing low and below the moving average (4H timeframe) for day/swing trades.
📍 Adjust SL based on risk, lot size, and number of orders.
🎯 Target
🏴☠️💥 69.000 (Aim for the big loot!) OR escape before the target
🔥 Market Heist Overview
The UK Oil Spot/Brent market is currently showing bullishness 🐂, driven by key factors—perfect for a day/scalping trade robbery! ☝☝☝
📰 Additional Tools & Analysis
📊 Get the Fundamental, Macro, COT Report, Quantitative Analysis, Sentiment Outlook, Intermarket Analysis, Future Targets—check our bi0 liinks 👉👉👉🔗🔗
⚠️ Trading Alert: News Releases & Position Management
📰 News can rattle the vault! 💥
✅ Avoid new trades during news releases.
✅ Use trailing stop-loss orders to protect profits.
💖 Supporting our heist plan?
💥 Smash the Boost Button 💥 to empower the robbery team.
Let’s make money every day in this market with the Thief Trading Style! 🏆💪🤝❤️🎉🚀
👀 Stay tuned for the next robbery plan, thieves! 🤑🐱👤🤗🤩

USOIL The Target Is UP! BUY!
My dear friends,
USOIL looks like it will make a good move, and here are the details:
The market is trading on 65.03 pivot level.
Bias - Bullish
Technical Indicators: Supper Trend generates a clear long) signal while Pivot Point HL is currently determining the overall Bullish trend of the market.
Goal - 68.89
Recommended Stop Loss - 63.01
About Used Indicators:
Pivot points are a great way to identify areas of support and resistance, but they work best when combined with other kinds of technical analysis
Disclosure: I am part of Trade Nation's Influencer program and receive a monthly fee for using their TradingView charts in my analysis.
———————————
WISH YOU ALL LUCK
USOIL HEIST ALERT: Thief Entry Loaded – Target Locked!🚨 The Ultimate US OIL / WTI Heist Plan – Thief Trading Style 🎯💸
Hey Money Makers, Hustlers, Market Bandits! 🌍
Hola, Ola, Bonjour, Hallo, Marhaba! 👋🌟
We’re back with a slick WTI energy market heist based on our 🔥Thief Trading Style🔥—powered by a mix of technical & fundamental strategies. The vault is wide open and the bullish loot awaits!
🗺️ Strategy Brief:
We’re aiming for a clean bullish getaway near the high-risk MA zone—where traps are set and bearish robbers lurk. Watch out for overbought zones, trend reversals, and consolidation ambushes.
📈 Entry Point:
“The vault is open! Enter the bullish heist at will.”
Look to place Buy Limit Orders around swing highs/lows or pullback levels on the 15m–30m timeframe.
🛑 Stop Loss:
Set your Thief SL around the recent swing low using the 3H timeframe (example: 60.300).
Adjust based on your risk appetite, lot size, and number of entries.
🎯 Target: 65.200
That's where we celebrate the score, traders! 🥂💸
📊 Heist Justification (Fundamentals + Sentiment):
The WTI market is currently bullish, fueled by a mix of:
✅ Macro economics
✅ COT data
✅ Seasonal trends
✅ Intermarket signals
✅ Inventory & storage dynamics
📌 For full analysis and future target breakdowns, check the linkk in our profilee 🔗👀
⚠️ Important Alert – Manage Your Risk During News:
🚫 Avoid fresh entries during major news releases
✅ Use trailing stops to protect running gains
Stay sharp, stay safe.
💥 Hit the Boost Button if you support the Thief Strategy!
Join the crew, ride the wave, and let’s rob the market like pros 💼🕶️💰
📅 Stay tuned for the next master plan. Another heist is always around the corner.
Until then – steal smart, win big! 🐱👤🔥

Analysis of Crude Oil's Opening Market Strategy on MondayWTI crude oil futures stabilized for the second consecutive day, maintaining fluctuations within the broad range of Tuesday and oscillating around the key level of $65.12. A sustained break below this level would confirm the resurgence of selling pressure, and a breach of $64.00 could trigger a decline toward $61.90. On the upside, if the price holds above $65.12, it may drive a short-term rebound to $67.44, and if momentum strengthens, it could further test $71.20.
Crude oil prices remain range-bound, but downward pressure is building. Robust U.S. demand provides support, yet macroeconomic caution and uncertainties over OPEC+ intentions are suppressing market sentiment. A decisive break below $65.12 would confirm the bearish trend, with bears targeting $61.90. Conversely, if this level holds, neutral-to-bullish logic remains valid, though upside potential remains constrained unless supply-demand signals converge overall.
you are currently struggling with losses,or are unsure which of the numerous trading strategies to follow,You have the option to join our VIP program. I will assist you and provide you with accurate trading signals, enabling you to navigate the financial markets with greater confidence and potentially achieve optimal trading results.
Trading Strategy:
buy@63.1-63.3
TP:66.3-69.9
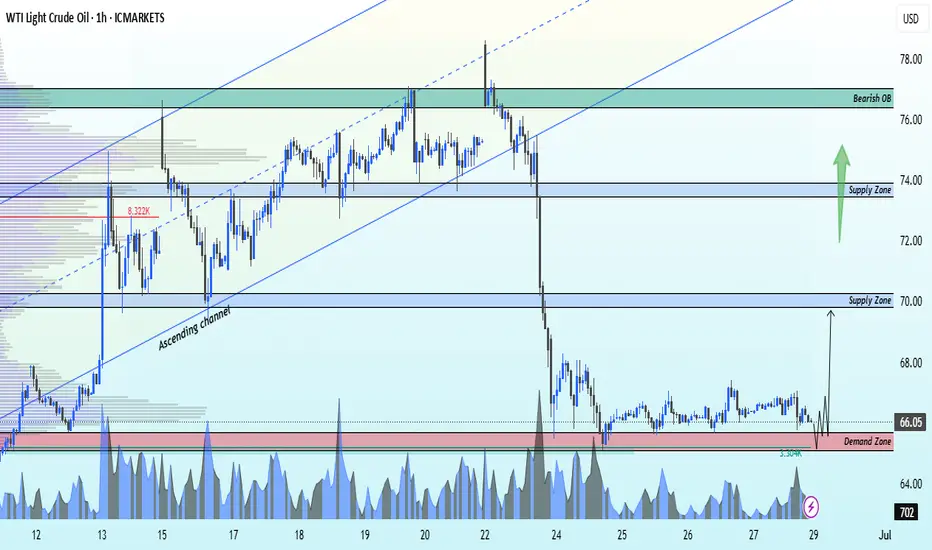
XTIUSD Breakdown from ascending channel now buy from supportXTIUSD Technical Update – 1H Timeframe 🚨
Crude Oil (XTIUSD) has broken down from the ascending channel, but is now showing a strong bullish reaction from the key demand zone at 65.10.
📈 Upside Targets:
🔹 1st Target: 70.00 – Local supply zone
🔹 2nd Target: 74.00 – Key supply zone
🔹 3rd Target: 77.00 – Bearish order block
The momentum is shifting – bulls are stepping in! Watch for confirmations on lower timeframes and manage risk accordingly. 🔍
✅ Like
✅ Follow
✅ Comment
💬 Join us for more real-time updates and analysis!
— With 💖,
Livia 😜
Weekly Market ReportIn this week’s video, I break down the key technical levels and market dynamics across four major instruments: S&P 500 (/ES), Gold (XAUUSD), Crude Oil (WTI), and Bitcoin (BTCUSD).
We explore price structure, liquidity zones, and potential setups with a focus on probability-based trade planning and risk management. Whether you're a swing trader or intraday participant, this breakdown offers valuable insight into the week ahead.

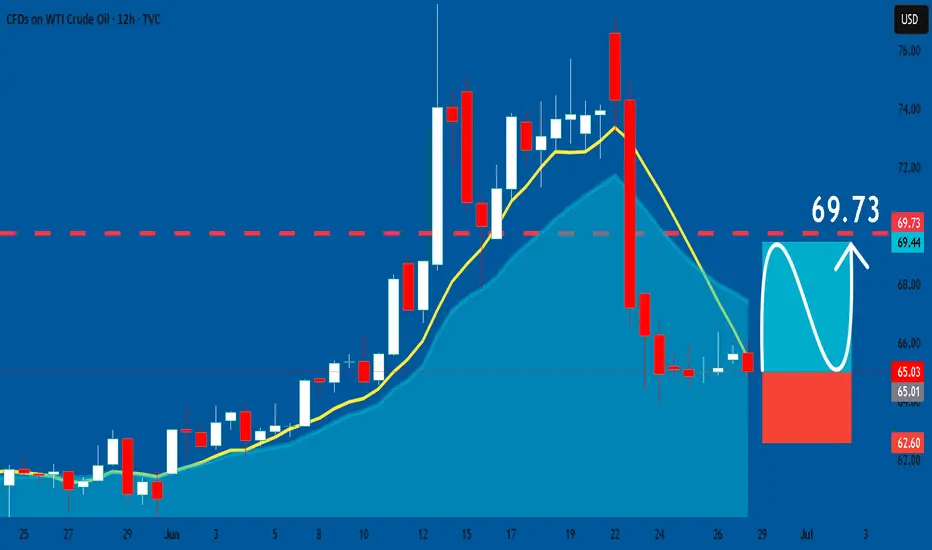
USOIL: Long Trading Opportunity
USOIL
- Classic bullish pattern
- Our team expects retracement
SUGGESTED TRADE:
Swing Trade
Buy USOIL
Entry - 65.03
Stop - 62.60
Take - 69.73
Our Risk - 1%
Start protection of your profits from lower levels
Disclosure: I am part of Trade Nation's Influencer program and receive a monthly fee for using their TradingView charts in my analysis.
❤️ Please, support our work with like & comment! ❤️
USOIL: Next Move Is Up! Long!
My dear friends,
Today we will analyse USOIL together☺️
The recent price action suggests a shift in mid-term momentum. A break above the current local range around 65.100 will confirm the new direction upwards with the target being the next key level of 65.468 and a reconvened placement of a stop-loss beyond the range.
❤️Sending you lots of Love and Hugs❤️
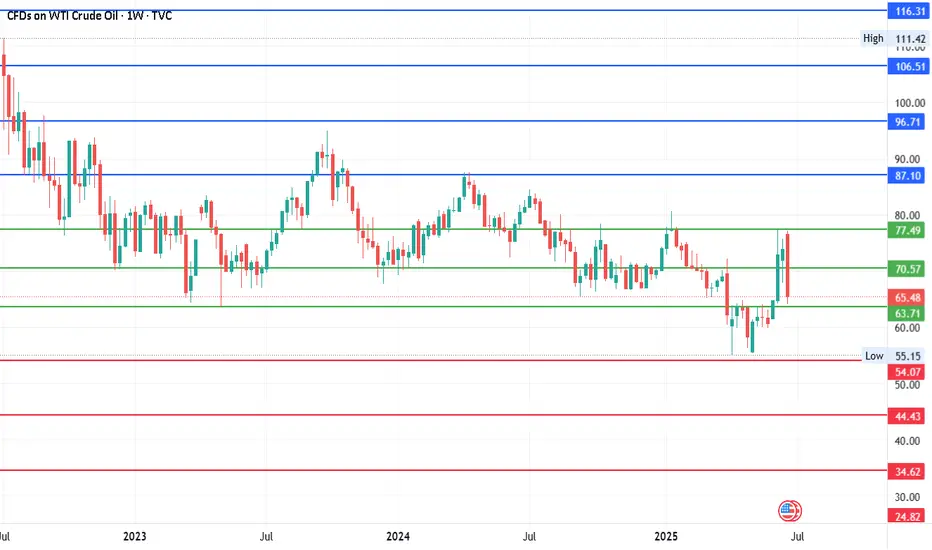
# USOIL - $40 Move? Something Major is coming?Date: 25-06-2025
#USOIL Current Price: $65.45
Pivot Point: 70.57 Support: 63.71 Resistance: 77.49
#USOIL Upside Targets:
Target 1: 87.10
Target 2: 96.71
Target 3: 106.51
Target 4: 116.31
#USOIL Downside Targets:
Target 1: 54.07
Target 2: 44.43
Target 3: 34.62
Target 4: 24.82
BUY OPPORTUNITY IN WTI NOW!Price dropped low and currently trade at $65.15 per barrel a buy opportunity is envisaged from the current market price. This is a potential opportunity to capitalize on. Take advantage of it
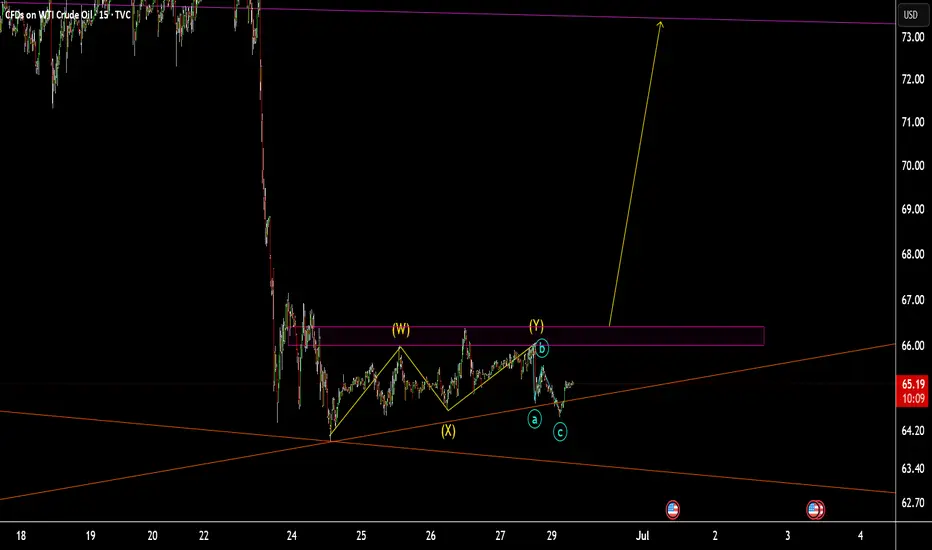
WTI OIL Might be close to the end of correction or finished it.there are definetly more than 1 posibilities in this one, 1 more down wave can occur and that is why i have a invalidation level. long term definetly buy but short and mid term is just not very clear, i am thinking it s time to buy. what i am going to do is keep track of it a bit more in short term and if it gives me good buying opportunity near the below i will enter the trade with a stop loss. and if it upbrakes possible impulse wave will occur and i will buy again to mid term target. so for now keep an eye on it and buy if the opportunity arise.

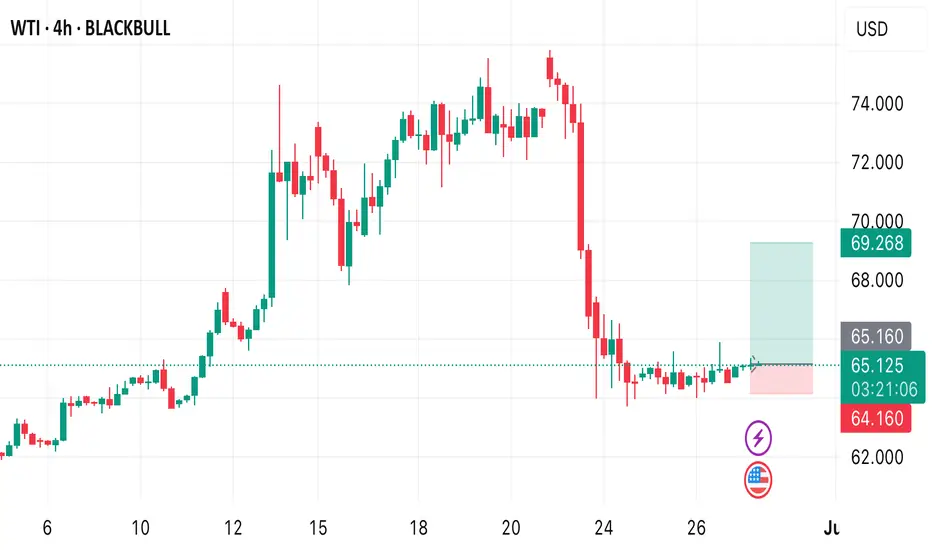
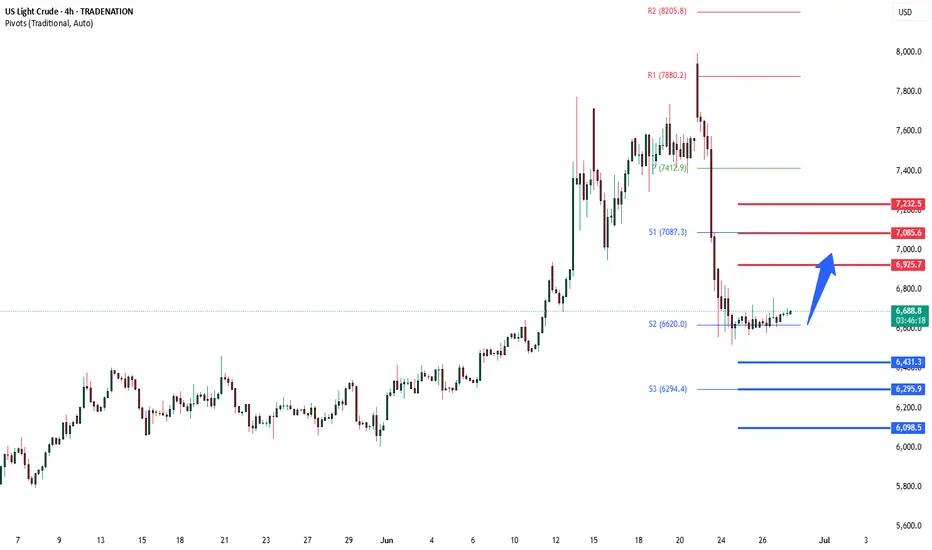
WTI Crude oversold rally support at 6400WTI crude oil is trading just above a two-week low of 6400, as demand concerns continue to weigh on prices.
The pressure comes from uncertainty around President Trump’s tariff policy, which could worsen when the current 90-day pause ends on July 9. So far, only a minor trade deal with the UK has been reached, adding to fears of a global slowdown and weaker oil demand.
Earlier this week, oil prices also dropped after Trump announced a ceasefire between Israel and Iran, easing fears about disruptions through the Strait of Hormuz, a major oil shipping route.
On the positive side, expectations for Federal Reserve rate cuts are rising. If Trump replaces Fed Chair Jerome Powell with someone more supportive of rate cuts, it could help lift oil prices slightly by boosting the economic outlook.
Overall, oil remains under pressure with limited upside unless demand outlook improves or further supportive policy measures emerge.
Key Support and Resistance Levels
Resistance Level 1: 6925
Resistance Level 2: 7080
Resistance Level 3: 7230
Support Level 1: 6460
Support Level 2: 6300
Support Level 3: 6100
This communication is for informational purposes only and should not be viewed as any form of recommendation as to a particular course of action or as investment advice. It is not intended as an offer or solicitation for the purchase or sale of any financial instrument or as an official confirmation of any transaction. Opinions, estimates and assumptions expressed herein are made as of the date of this communication and are subject to change without notice. This communication has been prepared based upon information, including market prices, data and other information, believed to be reliable; however, Trade Nation does not warrant its completeness or accuracy. All market prices and market data contained in or attached to this communication are indicative and subject to change without notice.
Cautious — this Chart is Slippery!Hello TradingView Family / Fellow Traders. This is Richard, also known as theSignalyst.
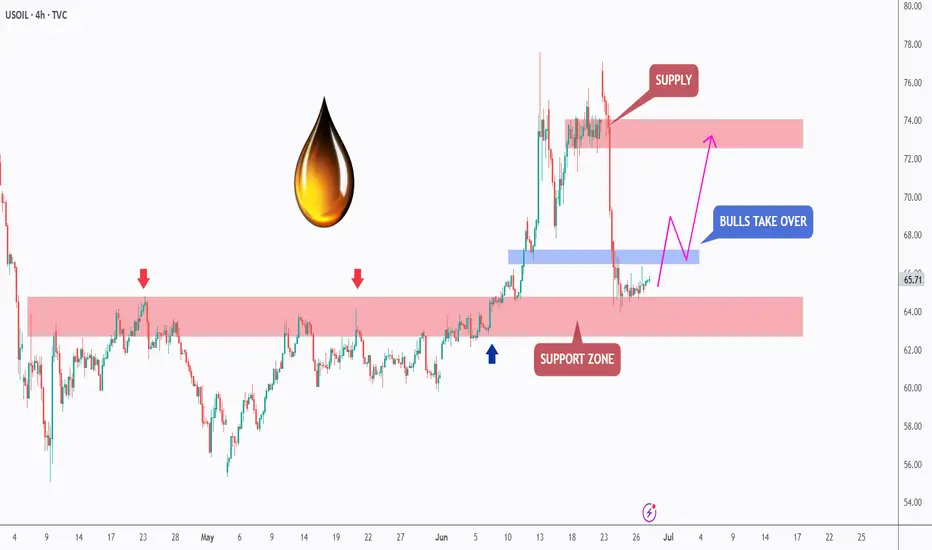
🛢️After surging by over 35% in the past two weeks, USOIL took a hit following Trump's announcement of a ceasefire between Iran and Israel.
However, from a technical perspective, USOIL is approaching a strong daily support zone marked in red.
As long as this support holds, the bulls remain in control.
📊The next bullish impulse will be confirmed upon a break above the last minor high marked in blue.
In such a scenario, a move toward the supply zone (also marked in red) would be expected.
📚 Always follow your trading plan regarding entry, risk management, and trade management.
Good luck!
All Strategies Are Good; If Managed Properly!
~Rich
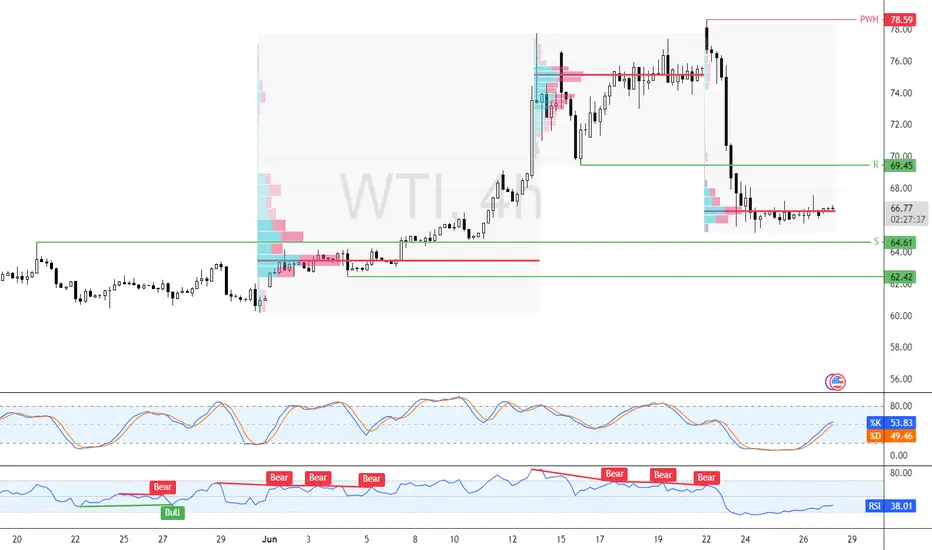
Crude Oil Trades in Range with Bullish PotentialCrude Oil trades above key support at $64.6, hovering near $66.83. If buyers maintain control, the next upside target is $69.45.
However, a bearish breakdown below $62.42 would invalidate this bullish outlook.
The idea of oscillating crude oil
💡Message Strategy
Asia's crude oil imports hit a record high in recent years
In the first half of 2025, Asia's crude oil imports showed a significant increase. The average daily import volume in Asia reached 27.36 million barrels, an increase of 620,000 barrels from 26.74 million barrels in the same period last year, an increase of about 2.3%. The highlight of this growth was concentrated in June, when Asia's crude oil arrivals soared to 28.65 million barrels/day, setting a record high since January 2023, far exceeding 27.3 million barrels/day in May and 26.42 million barrels/day in June last year.
Import boom driven by price
What drove the surge in Asian crude oil imports in June? The answer has a lot to do with price. China and India are known to be extremely sensitive to crude oil price fluctuations, usually increasing imports when prices are low and choosing to shrink when prices are high. Crude oil arriving in June is usually scheduled six to eight weeks in advance of delivery, which means that these cargoes were purchased when oil prices were low in April and May.
Geopolitics and market uncertainty
The sharp fluctuations in oil prices in June are inseparable from the fueling of geopolitics. Israel's military action against Iran and the subsequent intervention of the United States once pushed crude oil prices to a five-month high. After Trump announced the ceasefire agreement, the market risk premium quickly subsided, but geopolitical uncertainty is still an important variable affecting oil prices. In the future, any new geopolitical events may push up oil prices again, which will further pressure Asia's import demand.
📊Technical aspects
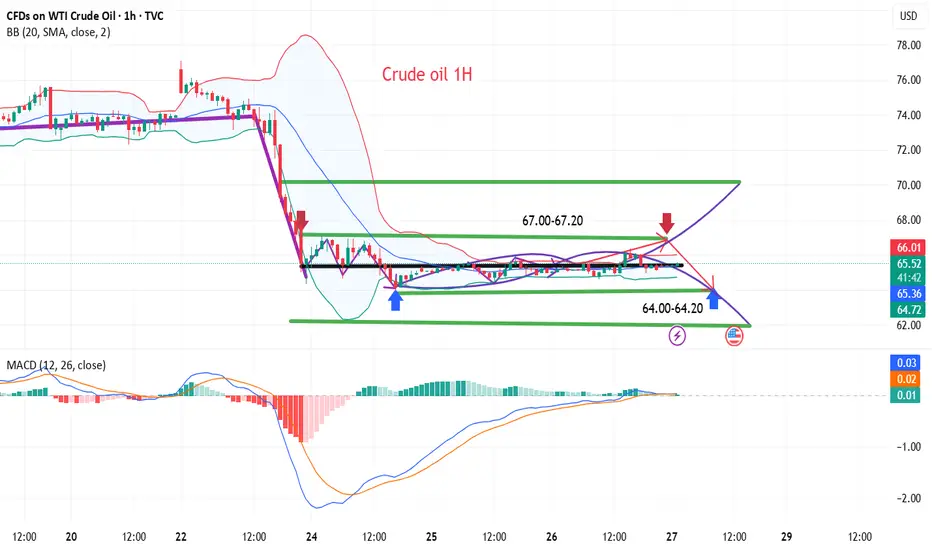
The short-term trend of crude oil (1H) continues to fluctuate in a narrow range, with a small fluctuation. The oil price repeatedly crosses the moving average system, and the short-term objective trend direction fluctuates. The momentum is stalemate between long and short positions, and it is expected that the trend of crude oil will maintain a fluctuating consolidation pattern during the day.
However, crude oil is never that simple. It is greatly affected by international trends. At present, crude oil is still waiting for direction. So how can we obtain greater future returns in a volatile market?
The answer is simple. At this time, what we need to do is to use a small stop loss to leverage large returns within the pressure and support range.
💰Strategy Package
Short Position:67.00-67.20,SL:67.80,Target: 64.50-63.50/60.00
Long Position:64.00-64.20,SL:63.50,Target: 65.50-66.50/70.00
USOIL:Go long
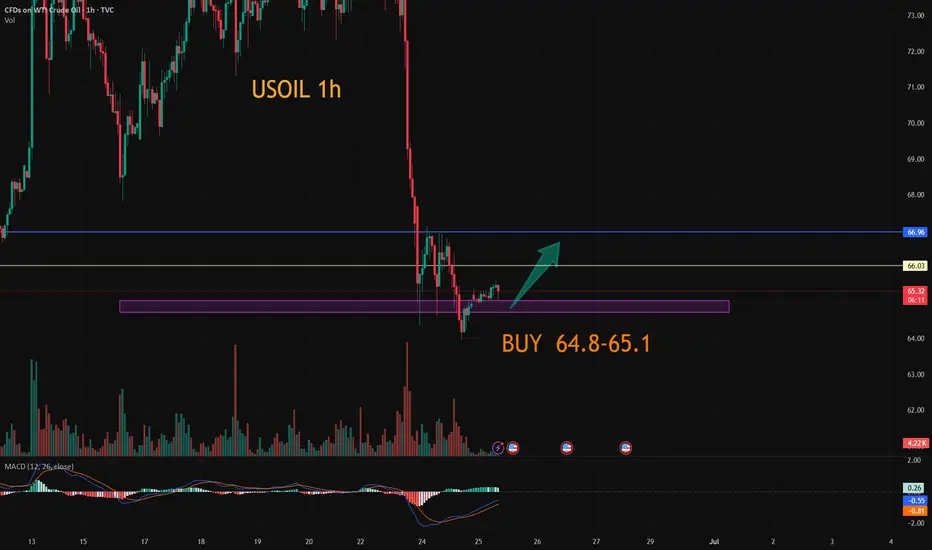
usoil: Let's start with a short-term rebound.
Trading idea:
BUY@64.8-65.2
TP: 66-66.4
More detailed strategies and trading will be notified here ↗↗↗
Keep updated, come to "get" ↗↗↗
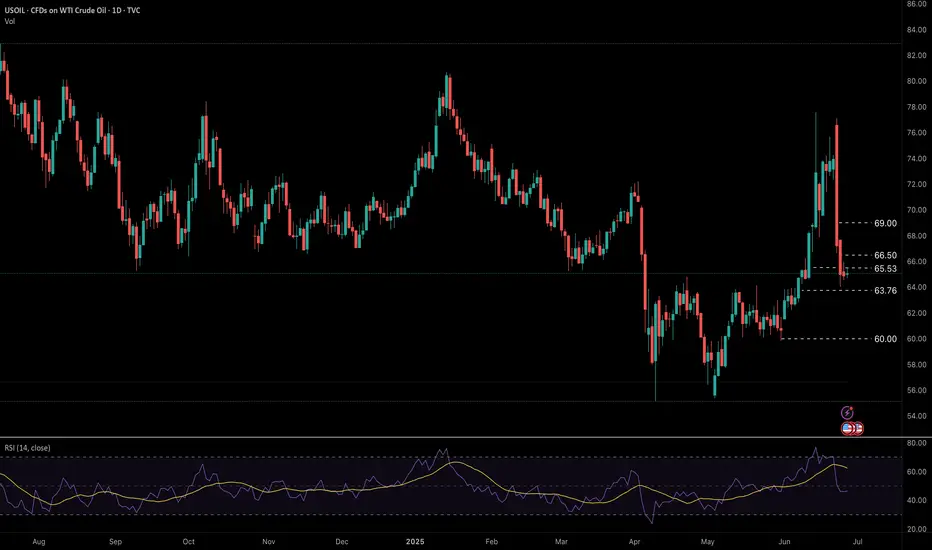
Oil volatility expected to remain on Middle East tensions.Fundamental
Oil prices remain under pressure. Volatility is expected to remain elevated as traders digest inventory data, watch for geopolitical shifts, and anticipate the upcoming OPEC+ meeting on July 6, where supply policy could change.
Technical
Technical indicators remain strongly bearish with RSI favouring further downside below pivot level 65.53 toward support levels at 63.76 and 60.00. A break above 65.53 sees a move towards resistance levels at 66.50 and 69.00 subsequently
USOIL Technical analysisThere is a possibility of going up. If it breaks down, it will go down even further. Otherwise, it is likely to go up gradually.
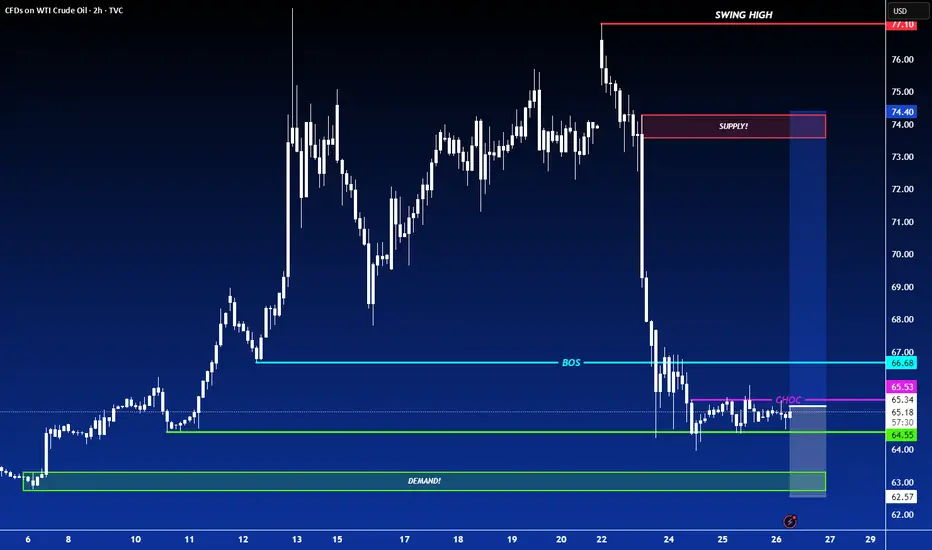
LONG ON OILUSOIL is consolidating at a major demand area.
We have a small choc (change of character) from down to up on the lower timeframe.
I will be buying oil to the next supply level looking to catch 500-1000 pips.
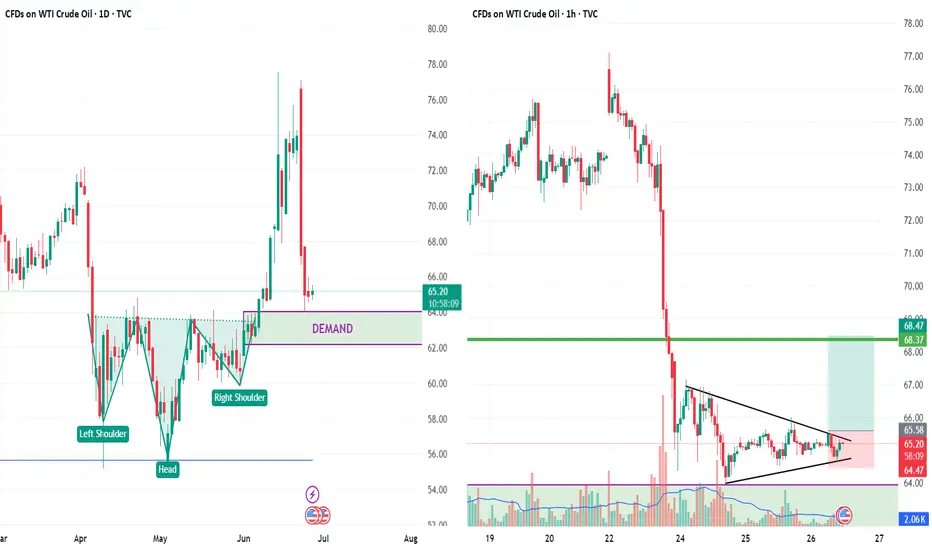
falling wedge formation on 1 Hr chartCrude oil is forming a falling wedge pattern on 1 hr time frame after retesting daily head and shoulder pattern and demand zone.
Breakout level 65.6
stoploss 64.4
target 68.3