Crude oil fluctuates in a narrow range, waiting for direction
💡Message Strategy
Middle East ceasefire eases supply concerns, but risk premium remains
Oil prices rose more than 1% on the day as investors weighed the status of the ceasefire between Iran and Israel. Although both sides have announced an end to hostilities, US intelligence reports show that Iran's nuclear capabilities have only been temporarily damaged. ING analysts pointed out that although immediate concerns about supply disruptions have subsided, potential risks remain, a factor that may support spot prices in the short term.
Previously, crude oil prices soared after the US military action on Iranian infrastructure, but prices have retreated as the ceasefire continues. Although the geopolitical premium has been reduced, it has not been fully digested.
API shows a sharp drop in inventories, traders await EIA report
Industry data from the American Petroleum Institute (API) showed that US crude oil inventories fell sharply by 4.23 million barrels in the week ending June 20, far higher than the expected drop of 800,000 barrels. Gasoline and distillate inventories increased by 400,000 barrels each.
Market focus now turns to the US Energy Information Administration (EIA) report scheduled for release on Wednesday. Traders were expecting a 1.2 million-barrel draw in inventories, and confirmation of that figure by the EIA, widely viewed as an industry benchmark, would reinforce expectations of tighter supply.
📊Technical aspects
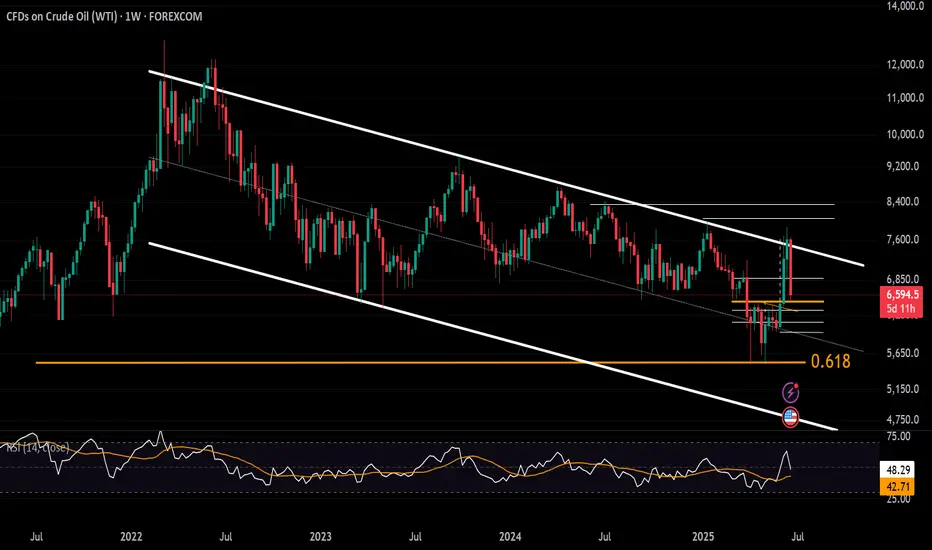
From the daily chart level, crude oil fluctuates upward in the medium term and tests around 67. The K-line closes with a large real negative line, which has not yet destroyed the moving average system and is still supported. The medium-term objective upward trend remains unchanged.
However, from the perspective of momentum, the MACD indicator crosses downward above the zero axis, indicating that the bullish momentum is weakening. It is expected that the medium-term trend of crude oil will fall into a high-level oscillation pattern.
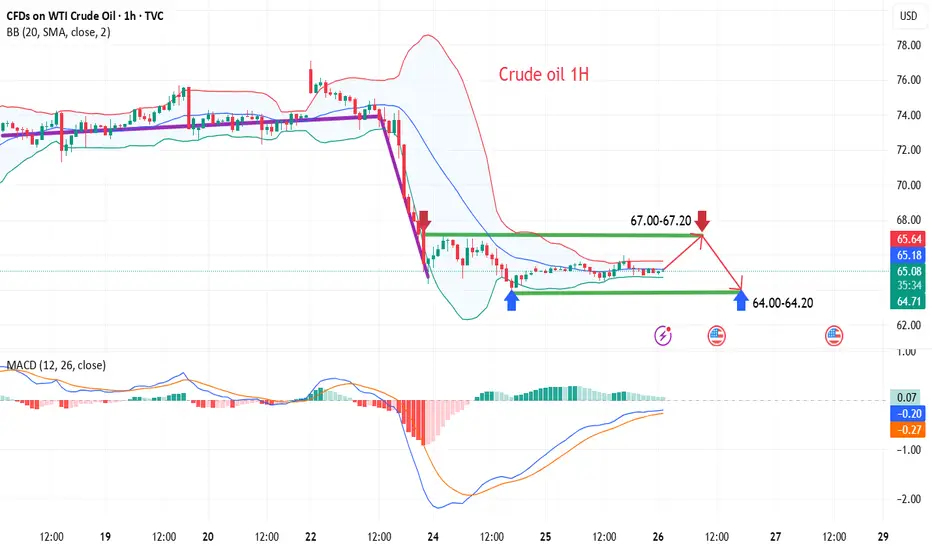
The short-term trend of crude oil (1H) is in a narrow range of consolidation, with a small fluctuation. The oil price repeatedly crosses the moving average system, and the short-term objective trend direction fluctuates. In terms of momentum, the MACD indicator fast and slow lines slowly rise below the zero axis, and the long and short positions are in a stalemate, with no obvious advantage on one side. It is expected that the trend of crude oil will maintain a consolidation pattern during the day.
💰Strategy Package
Short Position:67.00-67.20,SL:67.80,Target: 65.50-64.50
Long Position:64.00-64.20,SL:63.50,Target: 65.50-66.50
OILUSD trade ideas
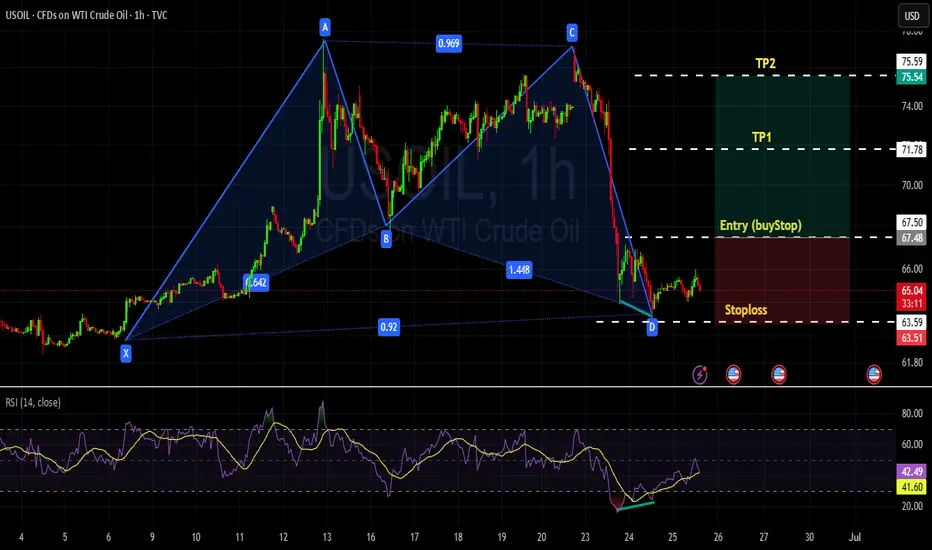
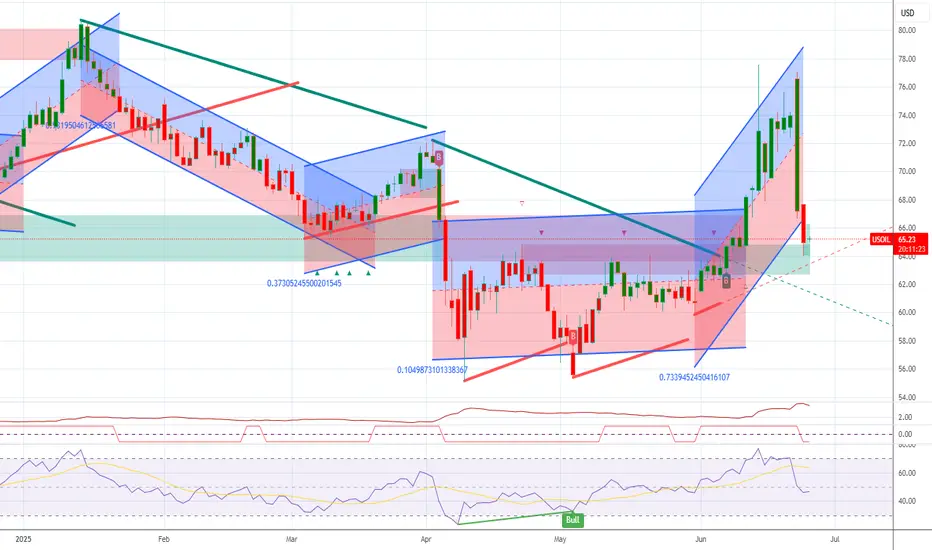
USOIL - REVERSAL Market is in bearish trend, however there is a bullish divergence on 1H time- which means market may take a deep correction. Futher harmonic pattern Bullish crab is also in formation.
Take the entry above the break of LH and stoploss below the D point / LL. and TPs with R:R ratio of 1:1 and 1:2
Thanks.
Bulish oil WTI)
✅ Overall Market Structure:
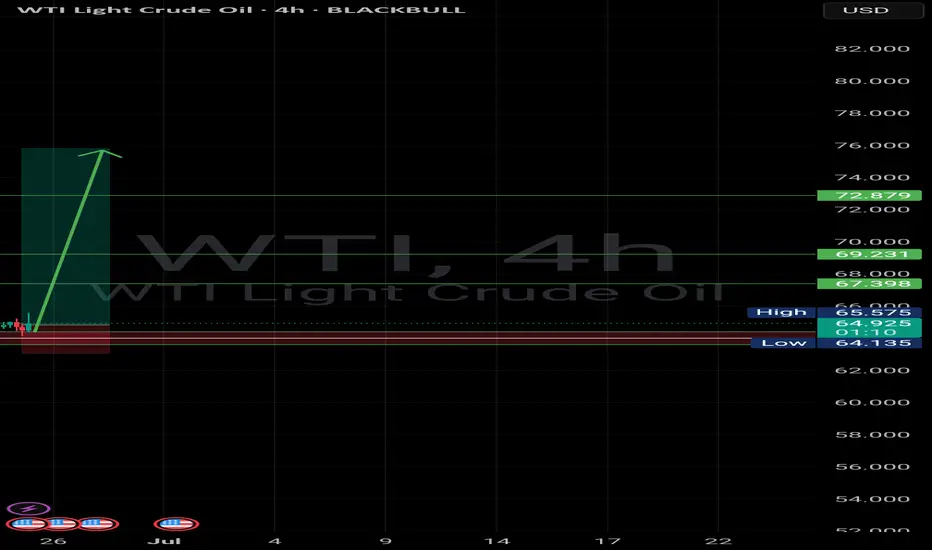
After a steady bullish trend, price has experienced a sharp drop and is now reacting to a demand zone around 64.955. The recent price action suggests signs of potential stabilization and a possible bullish reversal.
---
🟩 Key Levels:
Major Support Zone:
The area between 64.00 – 65.00 acts as a strong demand zone, which has shown prior reactions.
Resistance / Target Levels:
67.398 (first resistance and short-term target)
69.231 (mid-level resistance)
72.879 (main target if bullish momentum continues)
---
📈 Bullish Scenario (Most Probable Based on Current Chart):
After touching the demand zone, price seems to be forming a potential bottom. If a strong bullish candlestick appears (such as a bullish engulfing or hammer), we can expect a corrective or impulsive move to the upside.
🔸 Suggested Stop-Loss: Below 63.80
🔸 Target 1: 67.40
🔸 Target 2: 69.20
🔸 Target 3: 72.80
---
⚠️ Important Notes:
1. Wait for bullish confirmation before entering a trade.
2. If the support at 64 breaks, price may drop further toward the next demand zone around 61.00–60.00 (next major support lies at 59.415).
3. Keep an eye on oil-related news and U.S. economic reports (noted with calendar icons on the chart), as they can strongly impact volatility.
---
Shorts on Oil.... And on the NEWS and via brokers - they all wanted to go LONG because of war news....
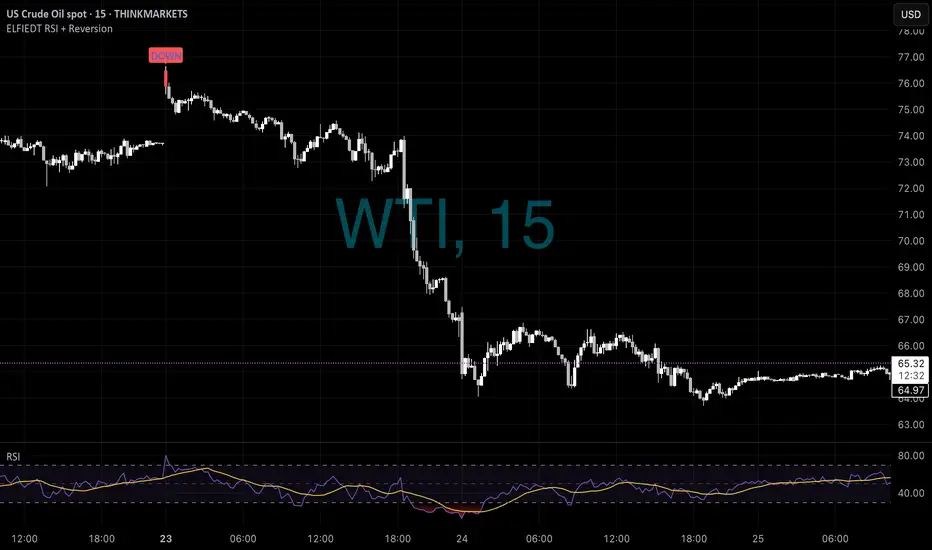
🛢️ Massive Oil Selloff Caught by ELFIEDT – RSI + Reversion
Instrument: US Crude Oil (WTI)
Timeframe: 15-Minute
Date: Monday, 23 June 2025
Indicator: ELFIEDT RSI + Reversion
🔍 What Happened:
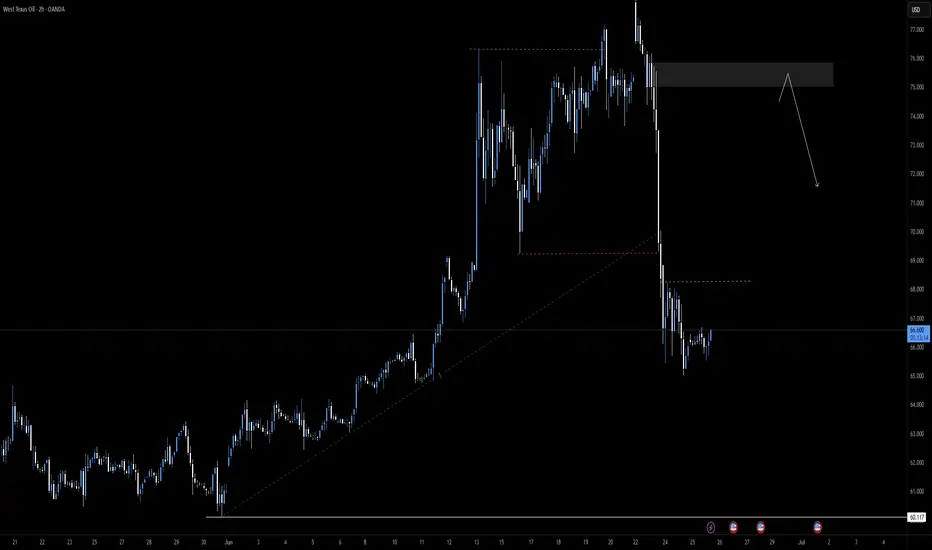
On Monday, the ELFIEDT system printed a clear “DOWN” signal on WTI Crude right near the local high before the market collapsed over the next two days.
The market looked strong—until it wasn’t. ELFIEDT flagged early signs of exhaustion while most traders were still bullish. What followed was a freefall from above $77 all the way to near $65.
💰 The Result:
From the signal candle, price dropped over 1,000 points (more than $12 per barrel).
That single short signal gave traders:
✅ A high-probability entry at the top
✅ A strong risk-reward setup
✅ A clean ride through the trend without confusion
This is what the ELFIEDT system is built for—finding early entries with strong downside follow-through.
📌 Why This Matters:
There was no need to chase the trend or react late.
ELFIEDT gave the heads-up, visually and confidently.
You don’t need to guess trend tops or bottoms anymore.
You just need to trust the process.
📈 One Signal. One Opportunity. Massive Result.
This WTI example shows the precision of ELFIEDT during volatile markets.
Whether it’s indices or commodities, the logic holds.
This is how you take control of reversals.
WTI USOILKey Factors Affecting US Oil Prices Today:
Geopolitical Developments:
Oil prices had surged earlier in June due to US airstrikes on Iranian nuclear sites and fears of supply disruptions through the Strait of Hormuz. However, prices fell sharply after a ceasefire was announced between Israel and Iran, easing immediate supply concerns.
Inventory Data:
Market participants are awaiting US crude and fuel inventory reports. Recent data showed a significant drawdown in US crude stocks, supporting prices despite geopolitical easing.
Demand Signals:
US refinery utilization has increased, and gasoline demand is near multi-year highs, indicating strong domestic consumption that underpins oil prices.
Market Sentiment:
After a recent two-day plunge (Brent fell over 6%), oil prices are recovering as investors reassess the durability of the ceasefire and ongoing demand fundamentals.

Here is the latest analysis of the crude oil market trendOn Wednesday, international oil prices stabilized and rebounded after two consecutive days of correction, as the market reassessed the short-term easing of the Middle East situation and changes in crude oil supply. Brent crude oil futures rose by $0.75, or 1.1%, to $67.89 per barrel; WTI crude oil rose by $0.71 to $65.08. Previously, U.S. air strikes damaged key Iranian facilities. Although they did not completely destroy its capabilities, they triggered short-term market concerns about supply chain disruptions.
When geopolitical tensions temporarily eased, the market also turned its attention to inventory data. The latest data from the American Petroleum Institute (API) showed that for the week ending June 20, U.S. crude oil inventories fell by 4.23 million barrels, far exceeding the market expectation of a 2.5 million barrel decline, indicating that refinery demand remained strong. Under the dual effect of the mitigation of geopolitical risks and the bullish API inventory data, oil prices showed signs of stabilization, but the foundation for the rise was still fragile.
In the next few trading days, the safety of the Strait of Hormuz and the EIA official inventory report will become the key to whether the bulls can continue. In the current volatile pattern, it is necessary to remain cautious and pay close attention to changes in the technical support area and U.S. policy dynamics.
However, in terms of momentum, the MACD indicator has formed a bearish crossover below the zero axis, signaling a weakening of bullish momentum. This suggests that the medium-term trend of crude oil is likely to fall into a high-level consolidation pattern.
you are currently struggling with losses,or are unsure which of the numerous trading strategies to follow,You have the option to join our VIP program. I will assist you and provide you with accurate trading signals, enabling you to navigate the financial markets with greater confidence and potentially achieve optimal trading results.
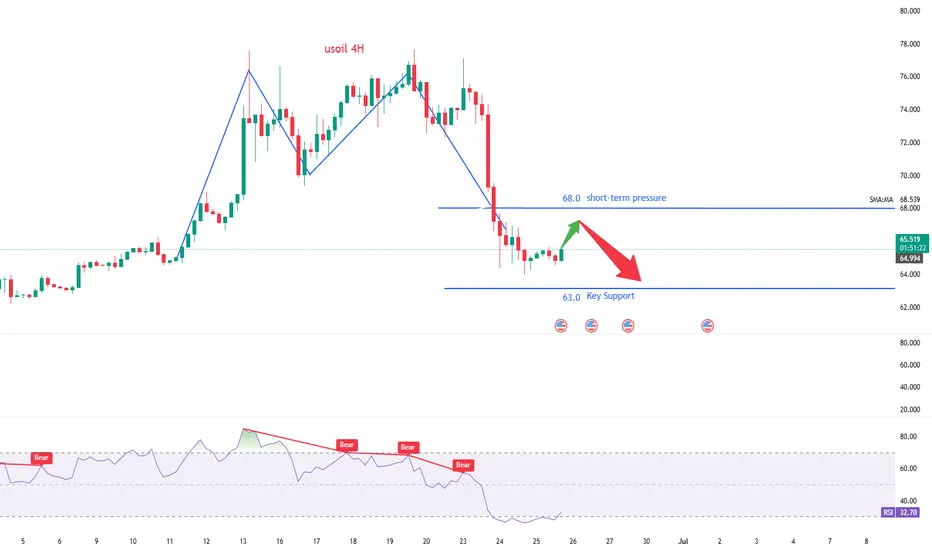
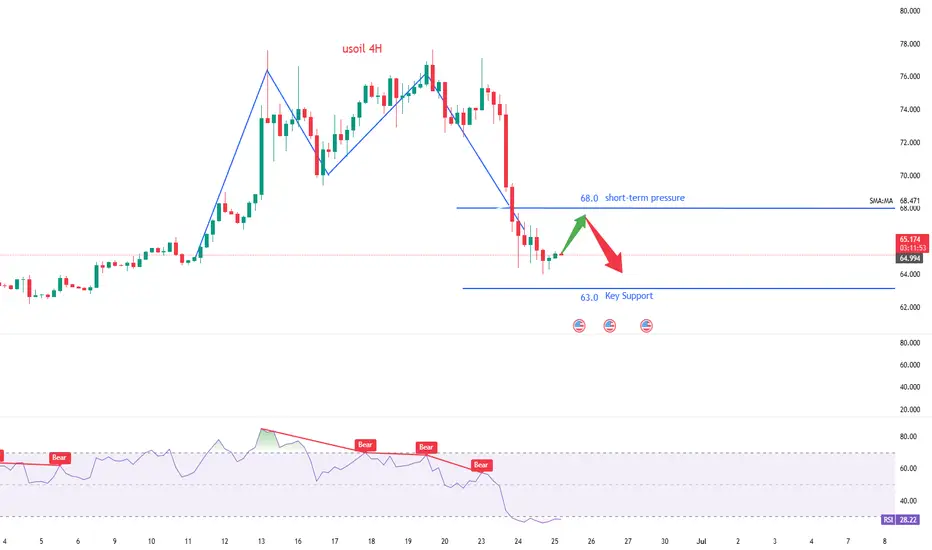
Trading Strategy:
sell@67.0-68.0
TP:63.0-64.0
WTI looks to end bearish run after bullish inventories dataWe have had some more bullish oil news from the weekly US inventories report. It remains to be seen whether the news is enough to lift the oil price.
Following the API data overnight we had even more bullish-looking official inventories report from the US Department of Energy.
The fact that crude stocks fell for the 5th straight week certainly points to strong demand, pushing stockpiles to their lowest levels since January.
As well as the big headline draw, stocks of crude products fell sharply too. The 2 million barrel draw in gasoline inventories was much higher than the API report, and suggests the driving season is well and truly at full steam, when demand for gasoline tends to rise.
In case you missed it, the DoE reported the following numbers:
• Crude -5.84mm
• Cushing -464k
• Gasoline -2.08mm
• Distillates -4.07mm
Whether or not oil can now stage a meaningful rebound remains to be seen. It has certainly lost its entire risk premium associated with the Iran-Israel conflict. Perhaps it is up to the OPEC+ now to decide with the alliance due to hold discussions on July 6 to consider a further supply boost in August. Any hints of a slower supply boost could provide support to prices.
By Fawad Razaqzada, market analyst with FOREX.com
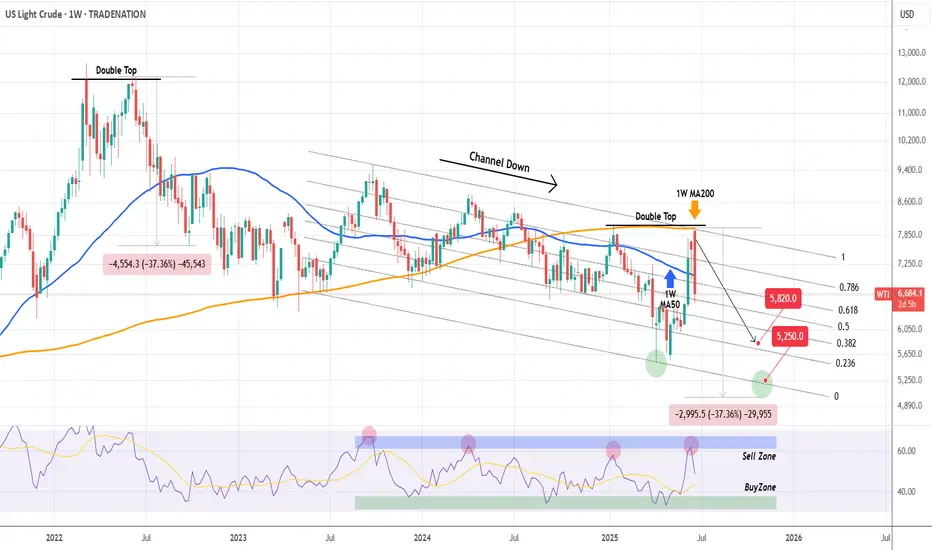
WTI OIL Progressively bearish on the long-term. Eyes $52.50.A week has passed since our sell signal on WTI Oil (USOIL) and the emerging geopolitical stability has already helped the price move much faster towards our $58.20 Target (see chart in related ideas below).
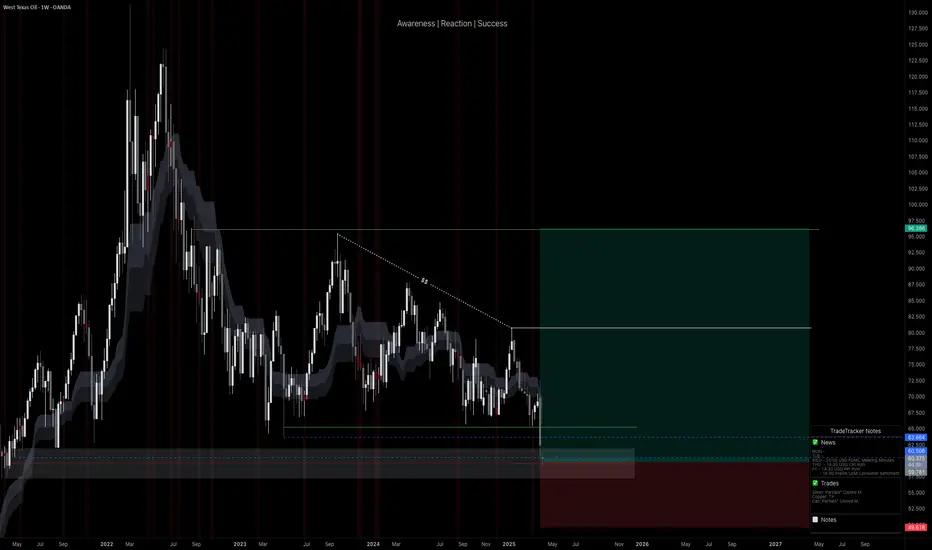
If we look at it from an even longer term perspective, the 1W time-frame in particular, we can see draw some very useful conclusions about the bearish case. First of all that this week's High got rejected exactly on the 1W MA200 (orange trend-line), which is the trend-line that made the last 3 major rejections on the market (January 13 2025, October 07 2024).
As you can see, that was a textbook Double Top formation. The last Double Top rejection took place on June 06 2022, the previous multi-year Top for the market. The result was a continued sell-off that didn't stop before testing the 1W MA200, which is now the Resistance.
As a result, even though our $58.20 Target stands, on the longer term we can even see a -37.36% decline towards the end of the year. Contact with the bottom of the Channel Down can be made at $52.50.
Alternatively, you can look at the 1W RSI, which has a clear Sell and clear Buy Zone. This week it was rejected on the Sell Zone, so you may look to book your profit as soon as it enters the Buy Zone.
-------------------------------------------------------------------------------
** Please LIKE 👍, FOLLOW ✅, SHARE 🙌 and COMMENT ✍ if you enjoy this idea! Also share your ideas and charts in the comments section below! This is best way to keep it relevant, support us, keep the content here free and allow the idea to reach as many people as possible. **
-------------------------------------------------------------------------------
Disclosure: I am part of Trade Nation's Influencer program and receive a monthly fee for using their TradingView charts in my analysis.
💸💸💸💸💸💸
👇 👇 👇 👇 👇 👇
SELL BIAS ON USOIL (WTI)With price accumulating liquidity, we've finally gotten a shift in price structure from buyers to sellers. I will be expecting price to take out inducement before validating supply at the order block zone for a massive selloff.
USoilLatest news. If the Strait of Hormuz is closed, the restrictions on the import and export of oil and natural gas will increase greatly. Because 20% of the world's oil and natural gas exports come from the Strait of Hormuz. So the trend of geopolitics will affect the closing and opening of this important checkpoint. If the increase in geopolitics really reaches this point, the price of oil may rise to 90$-100$. This is an excellent trading opportunity for investors who like to trade oil. But at present, this is an option for Iran to negotiate. Rather than a real closure, after all, the incident has not developed to this situation. If you like to trade oil. You can also follow me. Get brand new trading opportunities and make profits. Do not trade independently to avoid losses.

Tariff Panic = Opportunity | WTI Long SetupWTI Oil has finally dipped into my long-watched buy zone, driven by macro fear and an aggressive tariff agenda. The current drop aligned perfectly with my long-term execution plan. I’ve placed this trade based on key historical demand levels with my stop-loss and take-profit clearly defined. I’m prepared for deeper drawdown, but this area remains high-conviction for me. Execution > Prediction.
Technicals:
• Key Level: Price tapped into a major demand zone dating back to 2021 lows, which had been protected ever since.
• Liquidity Sweep: This drop mitigated every low formed post-2021 — clearing out late longs and stop hunts.
• Trendline Break Anticipation: I expect a potential trendline breakout from the long-term descending structure.
• SL/TP Defined: This trade has structure. It’s not a hope-based setup, it’s pre-planned and managed.
• Consolidation + Accumulation: This is where strong hands prepare, and I’m joining in.
Fundamentals:
• Tight supply, rising global demand, and structural underinvestment in oil exploration.
• Chinese reopening + Russian ban tighten market availability.
• Central banks expected to support demand via easing cycles.
• Oil Bearish Catalyst (Short-Term):
• US tariff wave: Trump announced a total 54% tariff on China and baseline tariffs on all trading partners.
• Escalating fears of global economic slowdown pushed prices to $58.80, a 4-year low.
The bearish panic gave bulls like us a gift. This is how real trades are born - not in euphoria, but in blood.
Note: Please remember to adjust this trade idea according to your individual trading conditions, including position size, broker-specific price variations, and any relevant external factors. Every trader’s situation is unique, so it’s crucial to tailor your approach to your own risk tolerance and market environment.
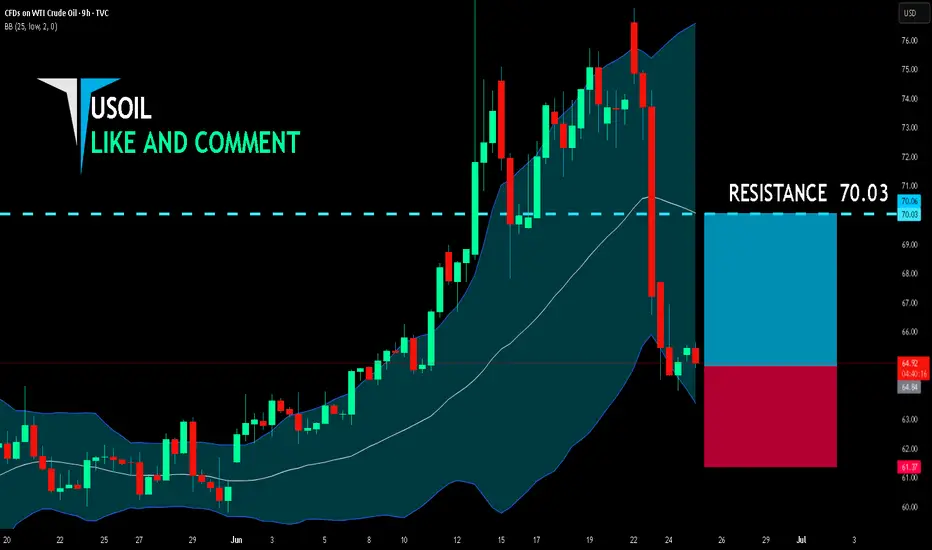
USOIL LONG FROM SUPPORT
USOIL SIGNAL
Trade Direction: long
Entry Level: 64.84
Target Level: 70.03
Stop Loss: 61.37
RISK PROFILE
Risk level: medium
Suggested risk: 1%
Timeframe: 9h
Disclosure: I am part of Trade Nation's Influencer program and receive a monthly fee for using their TradingView charts in my analysis.
✅LIKE AND COMMENT MY IDEAS✅
WTI Crude Oil lower ahead of US weekly inventoriesGeopolitics: The de-escalation between Israel and Iran removes near-term supply shock risks, reducing bullish pressure on oil.
Monetary Policy: Powell’s hawkish tone implies tighter financial conditions for longer, which can dampen global growth expectations and, in turn, oil demand.
Overall Bias for Traders:
Near-term pullback in WTI is possible if geopolitical risk continues to fade.
Upside may be capped unless new supply disruptions emerge or economic data justifies looser Fed policy.
Watch for inventory data and fresh comments from Fed officials or Middle East developments as catalysts for direction.
Trading Outlook: Neutral-to-Bearish near-term bias unless fresh geopolitical tension reignites risk premium.
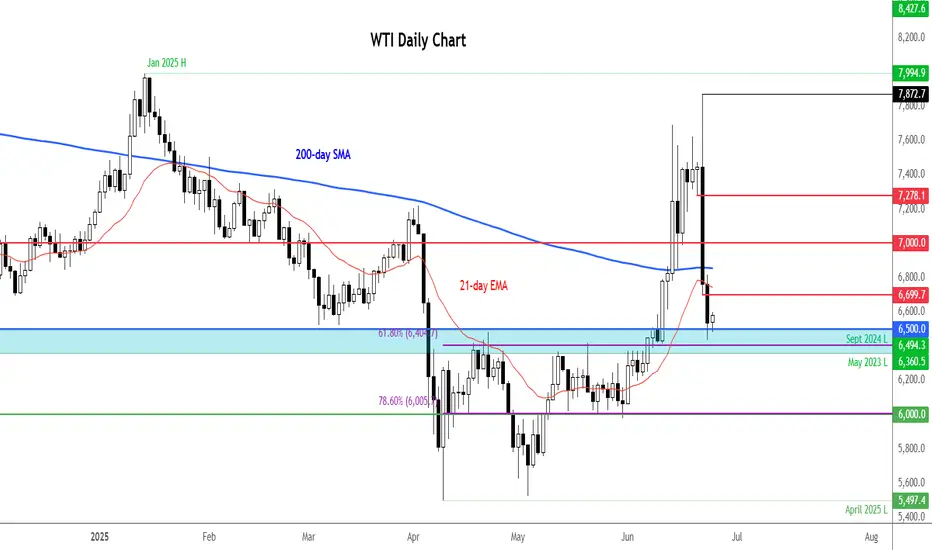
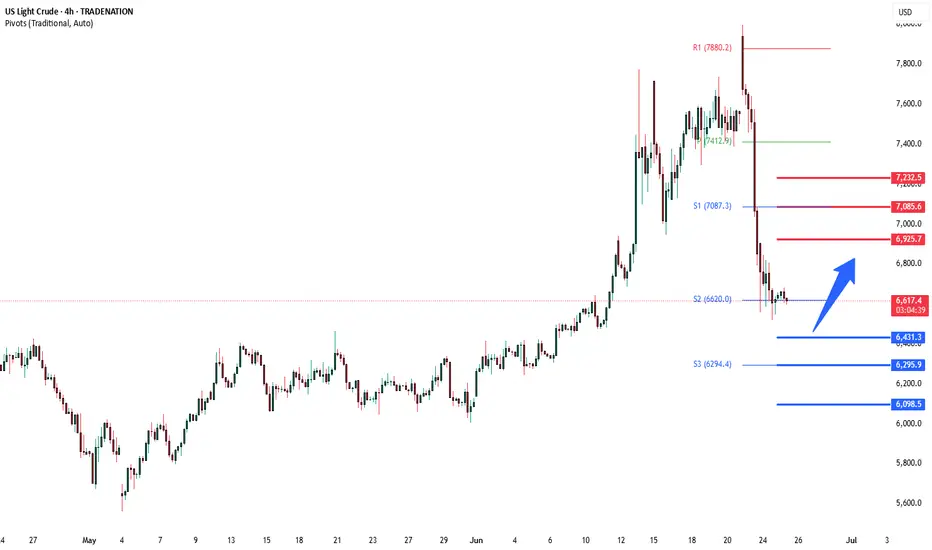
Key Support and Resistance Levels
Resistance Level 1: 6925
Resistance Level 2: 7080
Resistance Level 3: 7230
Support Level 1: 6460
Support Level 2: 6300
Support Level 3: 6100
This communication is for informational purposes only and should not be viewed as any form of recommendation as to a particular course of action or as investment advice. It is not intended as an offer or solicitation for the purchase or sale of any financial instrument or as an official confirmation of any transaction. Opinions, estimates and assumptions expressed herein are made as of the date of this communication and are subject to change without notice. This communication has been prepared based upon information, including market prices, data and other information, believed to be reliable; however, Trade Nation does not warrant its completeness or accuracy. All market prices and market data contained in or attached to this communication are indicative and subject to change without notice.
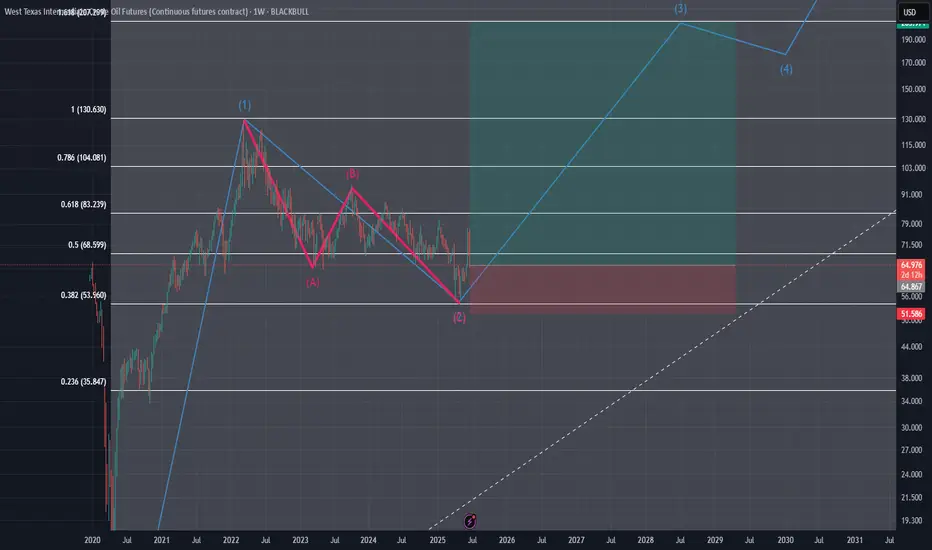
Is WW3 Coming? Crude Waves Flash Warning which I DO NOT LIKE ITI’m getting a knot in my stomach looking at this chart, it feels like a warning about what’s coming.
Chart Context
• WTI jumped from the pandemic low of 6.62 up to 131.02 on March 6, 2022.
• It then retraced to 59.86 (38 % Fib) by June 4, 2025.
• That pullback seems complete, and now price is pressing against a descending wedge.
Wave Map
• Wave 3 could extend toward 207
• A full five-wave run points up near 330
• The pattern is squeezed in a tightening channel that looks ready to break any day
Why It Feels Risky
Breaking above 200 normally requires a major supply shock—think trouble at the Strait of Hormuz, surprise OPEC cuts, or a hit to U.S. shale. The Iran–Israel cease-fire is shaky, drones are still buzzing storage sites, and even a brief chokepoint shutdown would send tanker traffic into chaos. To me, the chart is flashing that tail risk.
Trading Plan
• I’ll watch the wedge’s upper trendline around 83 for my first signal
• A weekly close above 93 would clear the path to 117, then 145
• If price closes below 51 on the week, this thesis is off
Your Thoughts?
Does this wave count make sense, or am I reading too much into it? Drop your views—especially if you’ve got the geopolitical angle covered. I hope this wave doesn’t play out, but pretending it’s not there feels reckless.
(Not financial advice)
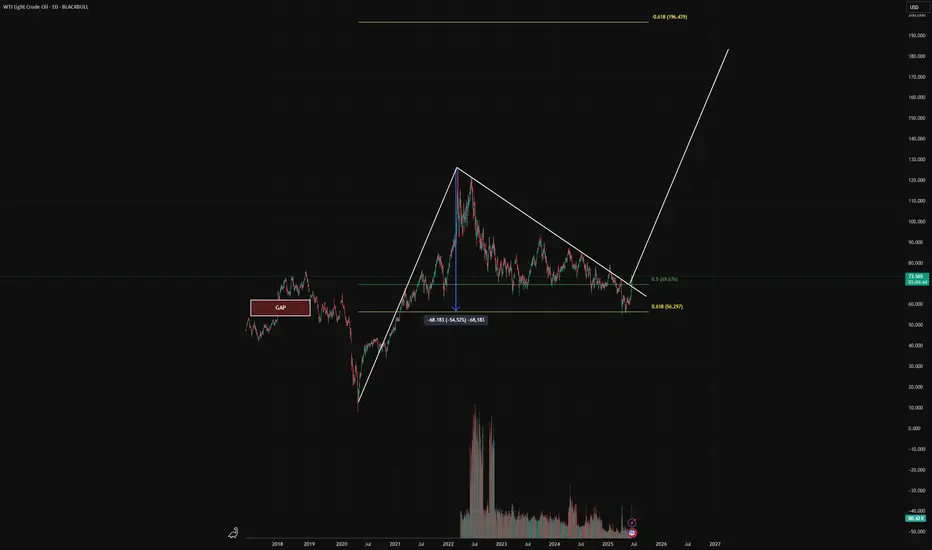
WW3 Scenario - Bull flag potentialWe bottomed at the gap fill at $57, a long term target I had been expecting. A bullish retest at the golden pocket followed, now all we need is a clean break above $80 to end the lower high downtrend. I don't want to comment on politics, but suffice to say the price of oil will tell us what's really going on. A supply shock has the potential to send oil to the $200 level. I don't know what the world will look like in that scenario, but I can assure you it will be a global catastrophe. Inflation will reignite, the interest rates will likely go up.
This is the single most important chart to be watching now. Forget Apple, forget Nvidia. Oil and the DXY is where the chart will reveal the news. Pay attention!
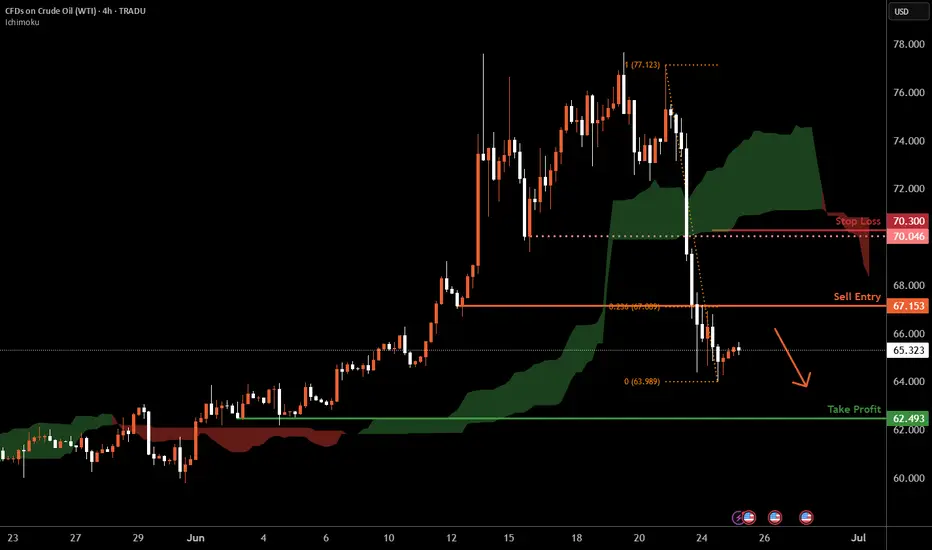
WTI Oil H4 | Continuation of downward trajectory?WTI oil (USOIL) is rising towards a pullback resistance and could potentially reverse off this level to drop lower.
Sell entry is at 67.15 which is a pullback resistance that aligns with the 23.6% Fibonacci retracement.
Stop loss is at 70.30 which is a level that sits above a pullback resistance.
Take profit is at 62.49 which is a swing-low support.
High Risk Investment Warning
Trading Forex/CFDs on margin carries a high level of risk and may not be suitable for all investors. Leverage can work against you.
Stratos Markets Limited (tradu.com ):
CFDs are complex instruments and come with a high risk of losing money rapidly due to leverage. 63% of retail investor accounts lose money when trading CFDs with this provider. You should consider whether you understand how CFDs work and whether you can afford to take the high risk of losing your money.
Stratos Europe Ltd (tradu.com ):
CFDs are complex instruments and come with a high risk of losing money rapidly due to leverage. 63% of retail investor accounts lose money when trading CFDs with this provider. You should consider whether you understand how CFDs work and whether you can afford to take the high risk of losing your money.
Stratos Global LLC (tradu.com ):
Losses can exceed deposits.
Please be advised that the information presented on TradingView is provided to Tradu (‘Company’, ‘we’) by a third-party provider (‘TFA Global Pte Ltd’). Please be reminded that you are solely responsible for the trading decisions on your account. There is a very high degree of risk involved in trading. Any information and/or content is intended entirely for research, educational and informational purposes only and does not constitute investment or consultation advice or investment strategy. The information is not tailored to the investment needs of any specific person and therefore does not involve a consideration of any of the investment objectives, financial situation or needs of any viewer that may receive it. Kindly also note that past performance is not a reliable indicator of future results. Actual results may differ materially from those anticipated in forward-looking or past performance statements. We assume no liability as to the accuracy or completeness of any of the information and/or content provided herein and the Company cannot be held responsible for any omission, mistake nor for any loss or damage including without limitation to any loss of profit which may arise from reliance on any information supplied by TFA Global Pte Ltd.
The speaker(s) is neither an employee, agent nor representative of Tradu and is therefore acting independently. The opinions given are their own, constitute general market commentary, and do not constitute the opinion or advice of Tradu or any form of personal or investment advice. Tradu neither endorses nor guarantees offerings of third-party speakers, nor is Tradu responsible for the content, veracity or opinions of third-party speakers, presenters or participants.
CRUDE OIL (WTI): Bullish Move From Support
WTI Crude Oil may continue rising from an underlined blue support cluster.
As a confirmation, I see a quick liquidity grab below that and a consequent
bullish imbalance candle on an hourly time frame.
I expect a rise to 66.24
❤️Please, support my work with like, thank you!❤️

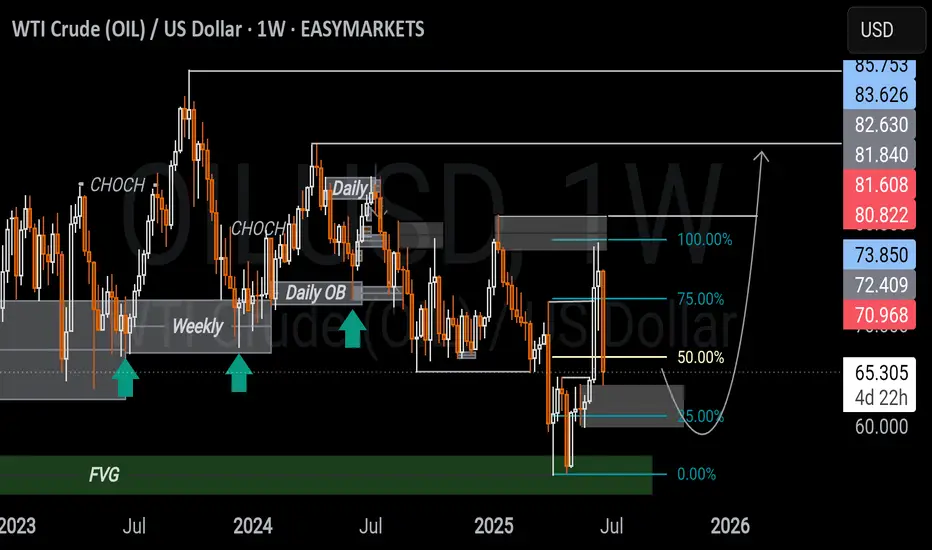
WTI CRUDE OIL USD WEEKLY ANALYSIS Price is reacting from a weekly FVG just below the 50% of a larger range, with some bullish momentum possibly fueled by recent geopolitical tensions.
But price is still within a bearish range acting as resistance, so upside may remain limited unless structure shifts.
A daily bullish OB below the 50% of that range could offer a solid pullback entry if price retraces which is aligning with the broader narrative and upside liquidity. Im having a neutral view of this and leveraging on both sides.
What are your thoughts?
Will crude oil prices continue to decline?On Tuesday, oil prices fell by 6%, hitting a two-week low, as market expectations that a ceasefire between Israel and Iran would reduce the risk of supply disruptions in Middle Eastern oil. WTI crude oil fell below $64 per barrel intraday, eventually closing down 3.35% at $64.96 per barrel; Brent crude oil closed down 3.7% at $67.73 per barrel. With the easing of the Israel-Iran conflict, the trading logic of the crude oil market will return to fundamentals. For now, the consumption peak season has hedged the pressure from OPEC+ production increases. Although U.S. crude oil demand has not shown eye-catching performance, OPEC+ production increases have also fallen short of expectations. In the later stage, attention needs to be paid to the geopolitical situation and the landing of OPEC+ production increases. Looking ahead to the second half of the year, factors such as continued OPEC+ production increases, weak demand, and supply surplus will still dominate oil price movements. The daily chart of crude oil closed with a bearish hammer line, in a two-day bearish pattern. After breaking the high, crude oil fell rapidly, indicating signs of the end of the oil price rally. Today, the focus is on whether the oil price continues to break down.
you are currently struggling with losses,or are unsure which of the numerous trading strategies to follow,You have the option to join our VIP program. I will assist you and provide you with accurate trading signals, enabling you to navigate the financial markets with greater confidence and potentially achieve optimal trading results.
Trading Strategy:
sell@67.0-68.0
TP:63.0-64.0
USOIL ShortUSOIL is now net short on the regression break.
The roll short is (-1.7%) roll on the front month.
I am not taking this trade.
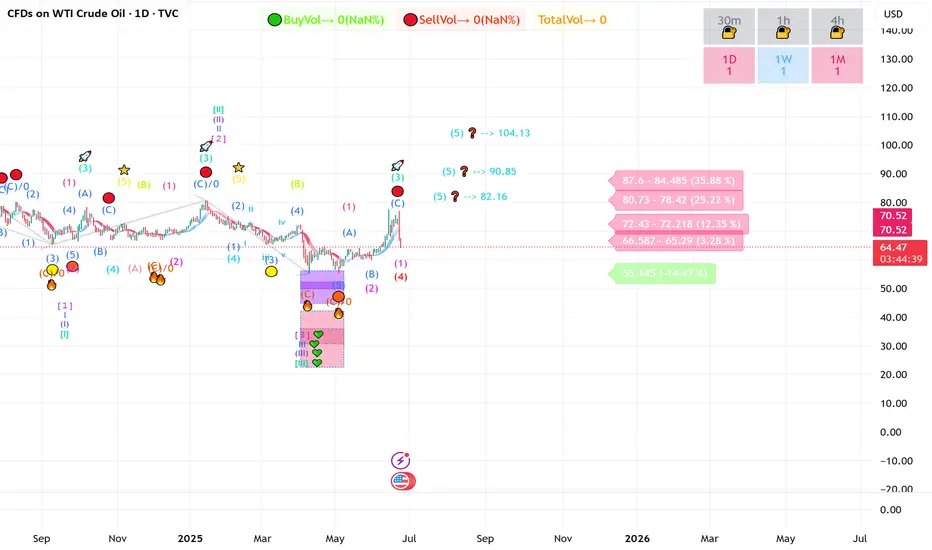
CRUDE set to fire 82 $ 90 $ 104 $ ????Crude Daily Elliot waves count suggest big UP setup in progress right now
55 $ key level to watch for buyer Extension point
Due to amid middle-east war situation may trigger Up move impulse wave towards 82 $ to 104 $ range
EW count are keeping changing during different price action in different time frame & multiple forecast .
this educational based chart as per EW theory method
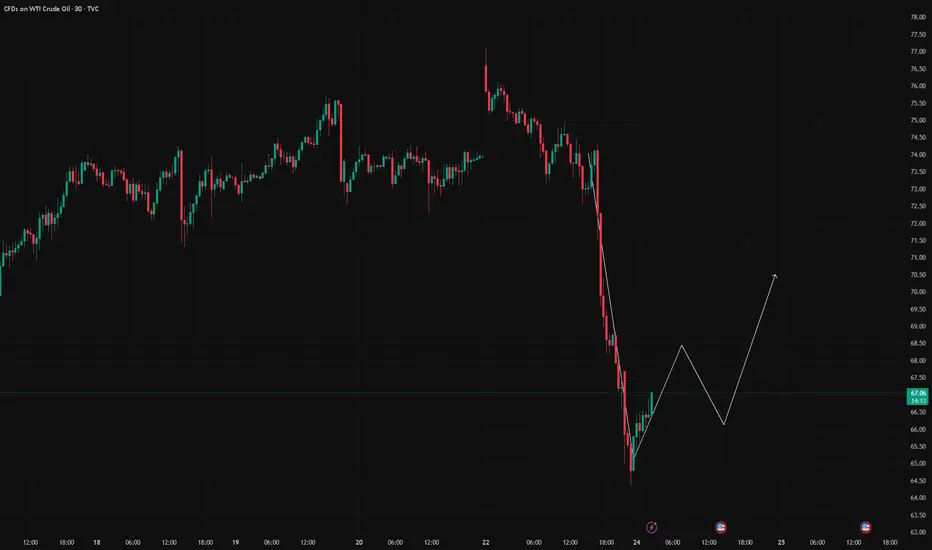
USOIL Expected to Rebound to the 68–70 ZoneUSOIL has shown signs of short-term overselling, and a technical rebound is likely during today’s session. Traders participating in crude oil can consider buying on dips, focusing on short-term opportunities with proper position management. Quick entries and exits are recommended.
Crude Oil Gets Trapped Back Inside 3-Year Down trending ChannelAfter failing to close above the upper border and the 78 resistance level, and amid renewed hopes for a Middle East ceasefire, oil prices dropped sharply back toward the neckline of the inverted head and shoulders formation—initially broken ahead of the recent war escalation—at 64.70.
A sustained move below that neckline could target crude prices toward the mid-zone of the established channel, near 63.40 and 61.40, where another rebound may take shape.
On the upside, if a clear recovery re-emerges above the 72-mark, the potential for a breakout above the 78-resistance could return, opening the door to revisit the 80 and 83.50 highs.
— Razan Hilal, CMT