USoilLatest news. If the Strait of Hormuz is closed, the restrictions on the import and export of oil and natural gas will increase greatly. Because 20% of the world's oil and natural gas exports come from the Strait of Hormuz. So the trend of geopolitics will affect the closing and opening of this important checkpoint. If the increase in geopolitics really reaches this point, the price of oil may rise to 90$-100$. This is an excellent trading opportunity for investors who like to trade oil. But at present, this is an option for Iran to negotiate. Rather than a real closure, after all, the incident has not developed to this situation. If you like to trade oil. You can also follow me. Get brand new trading opportunities and make profits. Do not trade independently to avoid losses.
OIL_CRUDE trade ideas

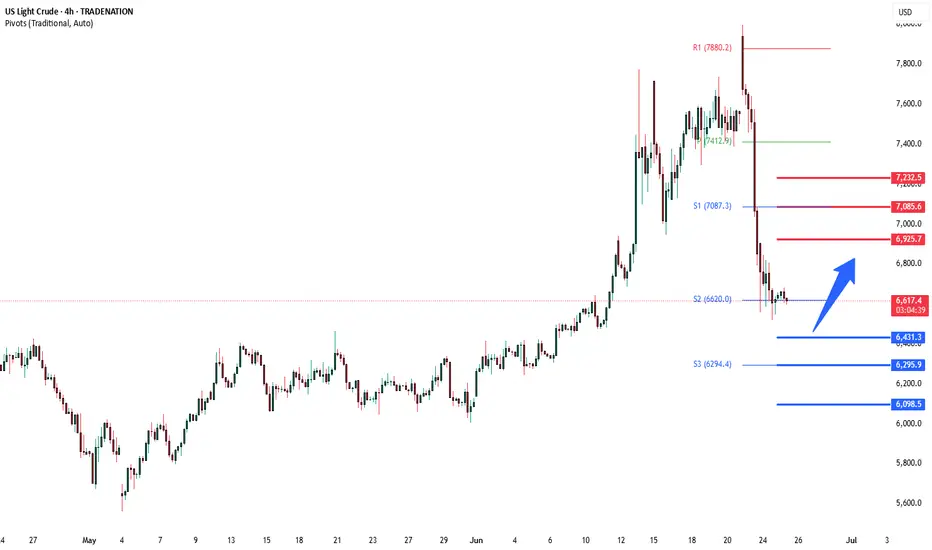
WTI Crude Oil lower ahead of US weekly inventoriesGeopolitics: The de-escalation between Israel and Iran removes near-term supply shock risks, reducing bullish pressure on oil.
Monetary Policy: Powell’s hawkish tone implies tighter financial conditions for longer, which can dampen global growth expectations and, in turn, oil demand.
Overall Bias for Traders:
Near-term pullback in WTI is possible if geopolitical risk continues to fade.
Upside may be capped unless new supply disruptions emerge or economic data justifies looser Fed policy.
Watch for inventory data and fresh comments from Fed officials or Middle East developments as catalysts for direction.
Trading Outlook: Neutral-to-Bearish near-term bias unless fresh geopolitical tension reignites risk premium.
Key Support and Resistance Levels
Resistance Level 1: 6925
Resistance Level 2: 7080
Resistance Level 3: 7230
Support Level 1: 6460
Support Level 2: 6300
Support Level 3: 6100
This communication is for informational purposes only and should not be viewed as any form of recommendation as to a particular course of action or as investment advice. It is not intended as an offer or solicitation for the purchase or sale of any financial instrument or as an official confirmation of any transaction. Opinions, estimates and assumptions expressed herein are made as of the date of this communication and are subject to change without notice. This communication has been prepared based upon information, including market prices, data and other information, believed to be reliable; however, Trade Nation does not warrant its completeness or accuracy. All market prices and market data contained in or attached to this communication are indicative and subject to change without notice.
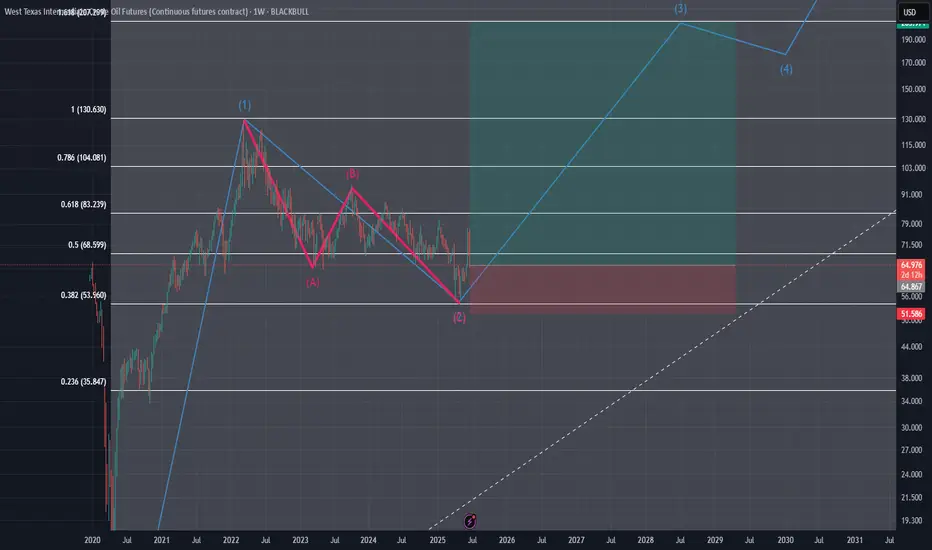
Is WW3 Coming? Crude Waves Flash Warning which I DO NOT LIKE ITI’m getting a knot in my stomach looking at this chart, it feels like a warning about what’s coming.
Chart Context
• WTI jumped from the pandemic low of 6.62 up to 131.02 on March 6, 2022.
• It then retraced to 59.86 (38 % Fib) by June 4, 2025.
• That pullback seems complete, and now price is pressing against a descending wedge.
Wave Map
• Wave 3 could extend toward 207
• A full five-wave run points up near 330
• The pattern is squeezed in a tightening channel that looks ready to break any day
Why It Feels Risky
Breaking above 200 normally requires a major supply shock—think trouble at the Strait of Hormuz, surprise OPEC cuts, or a hit to U.S. shale. The Iran–Israel cease-fire is shaky, drones are still buzzing storage sites, and even a brief chokepoint shutdown would send tanker traffic into chaos. To me, the chart is flashing that tail risk.
Trading Plan
• I’ll watch the wedge’s upper trendline around 83 for my first signal
• A weekly close above 93 would clear the path to 117, then 145
• If price closes below 51 on the week, this thesis is off
Your Thoughts?
Does this wave count make sense, or am I reading too much into it? Drop your views—especially if you’ve got the geopolitical angle covered. I hope this wave doesn’t play out, but pretending it’s not there feels reckless.
(Not financial advice)
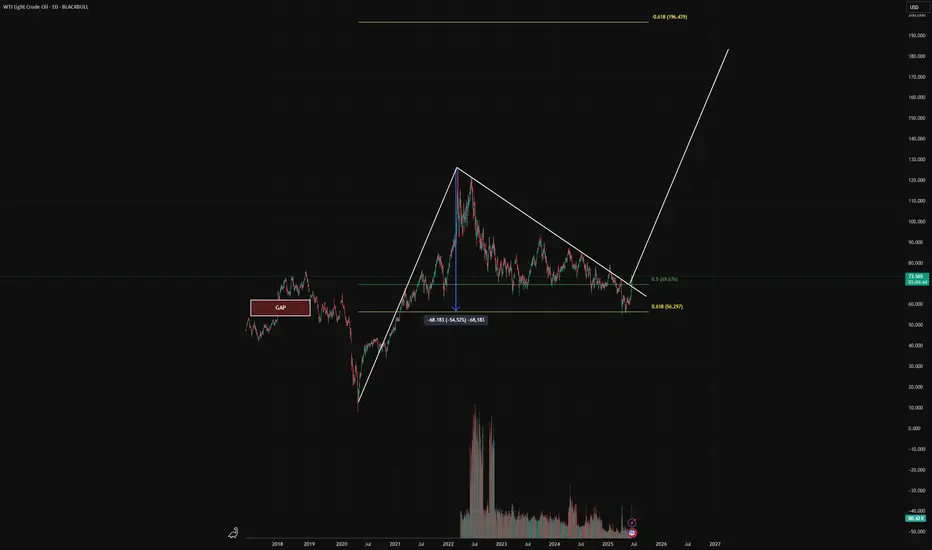
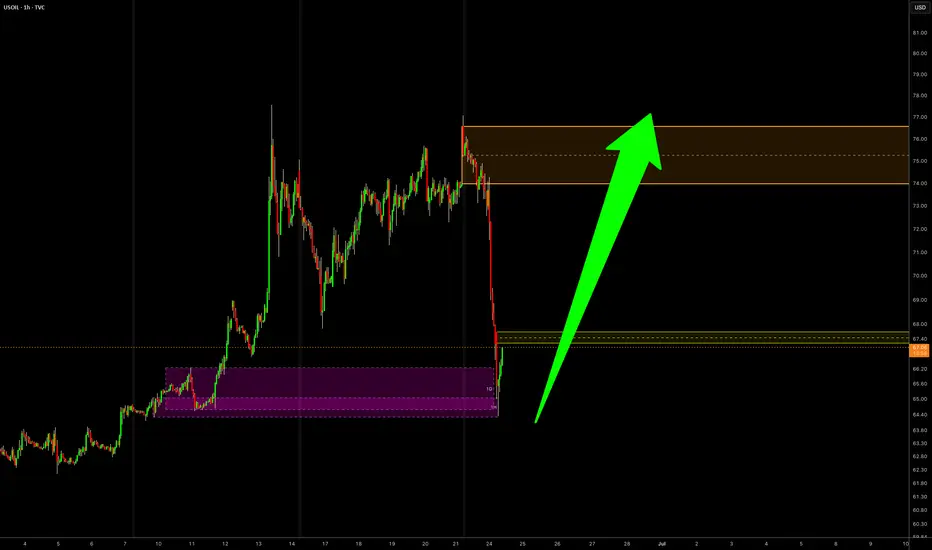
WW3 Scenario - Bull flag potentialWe bottomed at the gap fill at $57, a long term target I had been expecting. A bullish retest at the golden pocket followed, now all we need is a clean break above $80 to end the lower high downtrend. I don't want to comment on politics, but suffice to say the price of oil will tell us what's really going on. A supply shock has the potential to send oil to the $200 level. I don't know what the world will look like in that scenario, but I can assure you it will be a global catastrophe. Inflation will reignite, the interest rates will likely go up.
This is the single most important chart to be watching now. Forget Apple, forget Nvidia. Oil and the DXY is where the chart will reveal the news. Pay attention!
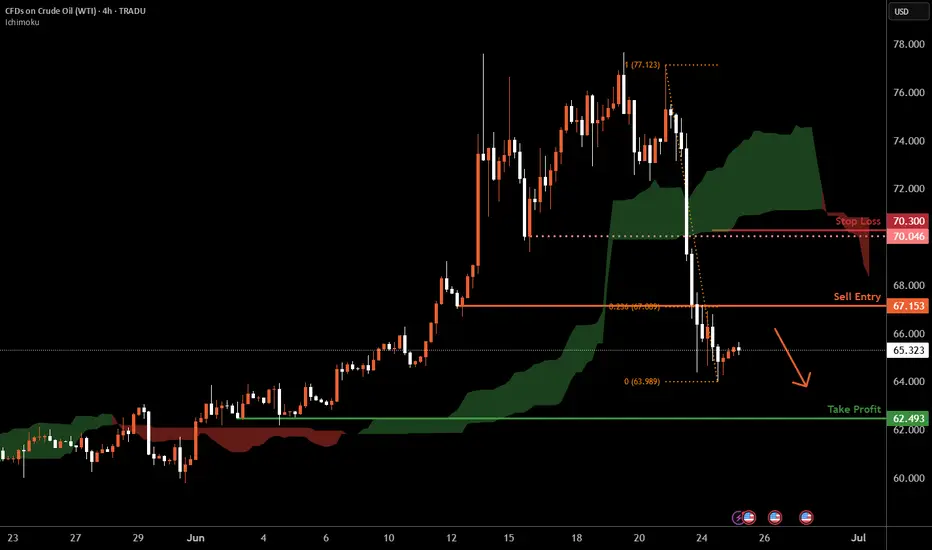
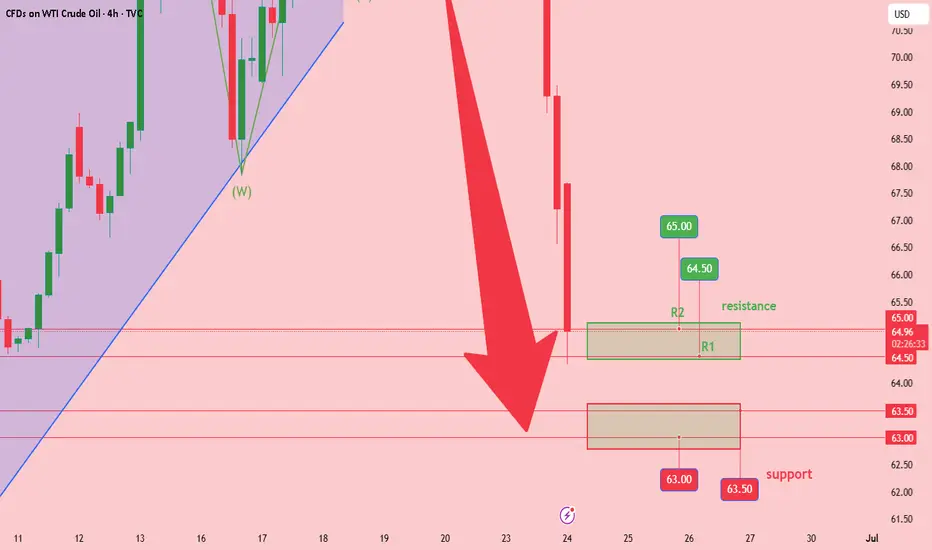
WTI Oil H4 | Continuation of downward trajectory?WTI oil (USOIL) is rising towards a pullback resistance and could potentially reverse off this level to drop lower.
Sell entry is at 67.15 which is a pullback resistance that aligns with the 23.6% Fibonacci retracement.
Stop loss is at 70.30 which is a level that sits above a pullback resistance.
Take profit is at 62.49 which is a swing-low support.
High Risk Investment Warning
Trading Forex/CFDs on margin carries a high level of risk and may not be suitable for all investors. Leverage can work against you.
Stratos Markets Limited (tradu.com ):
CFDs are complex instruments and come with a high risk of losing money rapidly due to leverage. 63% of retail investor accounts lose money when trading CFDs with this provider. You should consider whether you understand how CFDs work and whether you can afford to take the high risk of losing your money.
Stratos Europe Ltd (tradu.com ):
CFDs are complex instruments and come with a high risk of losing money rapidly due to leverage. 63% of retail investor accounts lose money when trading CFDs with this provider. You should consider whether you understand how CFDs work and whether you can afford to take the high risk of losing your money.
Stratos Global LLC (tradu.com ):
Losses can exceed deposits.
Please be advised that the information presented on TradingView is provided to Tradu (‘Company’, ‘we’) by a third-party provider (‘TFA Global Pte Ltd’). Please be reminded that you are solely responsible for the trading decisions on your account. There is a very high degree of risk involved in trading. Any information and/or content is intended entirely for research, educational and informational purposes only and does not constitute investment or consultation advice or investment strategy. The information is not tailored to the investment needs of any specific person and therefore does not involve a consideration of any of the investment objectives, financial situation or needs of any viewer that may receive it. Kindly also note that past performance is not a reliable indicator of future results. Actual results may differ materially from those anticipated in forward-looking or past performance statements. We assume no liability as to the accuracy or completeness of any of the information and/or content provided herein and the Company cannot be held responsible for any omission, mistake nor for any loss or damage including without limitation to any loss of profit which may arise from reliance on any information supplied by TFA Global Pte Ltd.
The speaker(s) is neither an employee, agent nor representative of Tradu and is therefore acting independently. The opinions given are their own, constitute general market commentary, and do not constitute the opinion or advice of Tradu or any form of personal or investment advice. Tradu neither endorses nor guarantees offerings of third-party speakers, nor is Tradu responsible for the content, veracity or opinions of third-party speakers, presenters or participants.
CRUDE OIL (WTI): Bullish Move From Support
WTI Crude Oil may continue rising from an underlined blue support cluster.
As a confirmation, I see a quick liquidity grab below that and a consequent
bullish imbalance candle on an hourly time frame.
I expect a rise to 66.24
❤️Please, support my work with like, thank you!❤️

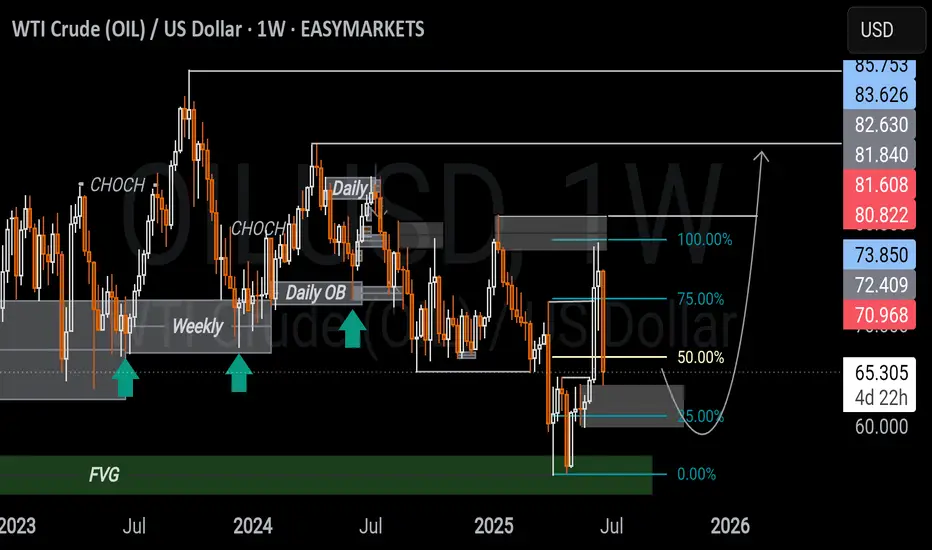
WTI CRUDE OIL USD WEEKLY ANALYSIS Price is reacting from a weekly FVG just below the 50% of a larger range, with some bullish momentum possibly fueled by recent geopolitical tensions.
But price is still within a bearish range acting as resistance, so upside may remain limited unless structure shifts.
A daily bullish OB below the 50% of that range could offer a solid pullback entry if price retraces which is aligning with the broader narrative and upside liquidity. Im having a neutral view of this and leveraging on both sides.
What are your thoughts?
Will crude oil prices continue to decline?On Tuesday, oil prices fell by 6%, hitting a two-week low, as market expectations that a ceasefire between Israel and Iran would reduce the risk of supply disruptions in Middle Eastern oil. WTI crude oil fell below $64 per barrel intraday, eventually closing down 3.35% at $64.96 per barrel; Brent crude oil closed down 3.7% at $67.73 per barrel. With the easing of the Israel-Iran conflict, the trading logic of the crude oil market will return to fundamentals. For now, the consumption peak season has hedged the pressure from OPEC+ production increases. Although U.S. crude oil demand has not shown eye-catching performance, OPEC+ production increases have also fallen short of expectations. In the later stage, attention needs to be paid to the geopolitical situation and the landing of OPEC+ production increases. Looking ahead to the second half of the year, factors such as continued OPEC+ production increases, weak demand, and supply surplus will still dominate oil price movements. The daily chart of crude oil closed with a bearish hammer line, in a two-day bearish pattern. After breaking the high, crude oil fell rapidly, indicating signs of the end of the oil price rally. Today, the focus is on whether the oil price continues to break down.
you are currently struggling with losses,or are unsure which of the numerous trading strategies to follow,You have the option to join our VIP program. I will assist you and provide you with accurate trading signals, enabling you to navigate the financial markets with greater confidence and potentially achieve optimal trading results.
Trading Strategy:
sell@67.0-68.0
TP:63.0-64.0
USOIL ShortUSOIL is now net short on the regression break.
The roll short is (-1.7%) roll on the front month.
I am not taking this trade.
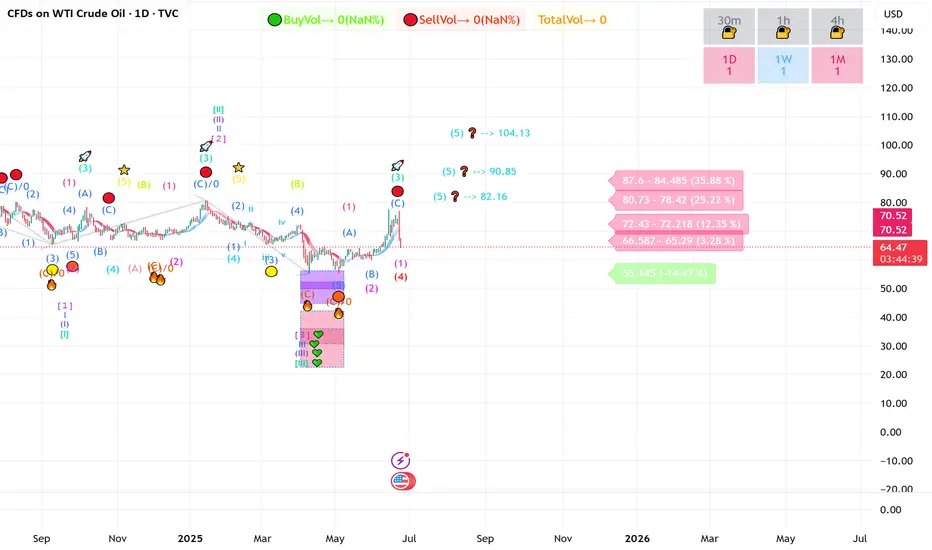
CRUDE set to fire 82 $ 90 $ 104 $ ????Crude Daily Elliot waves count suggest big UP setup in progress right now
55 $ key level to watch for buyer Extension point
Due to amid middle-east war situation may trigger Up move impulse wave towards 82 $ to 104 $ range
EW count are keeping changing during different price action in different time frame & multiple forecast .
this educational based chart as per EW theory method
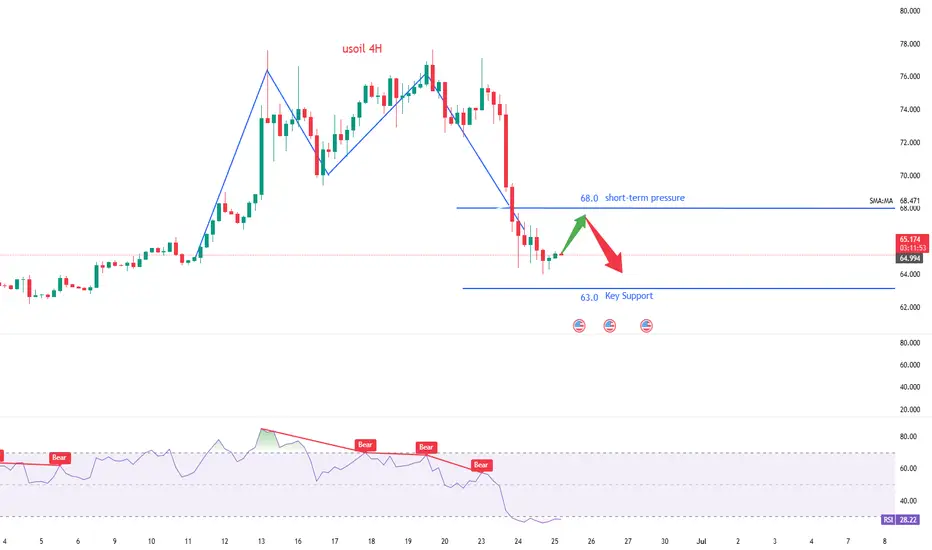
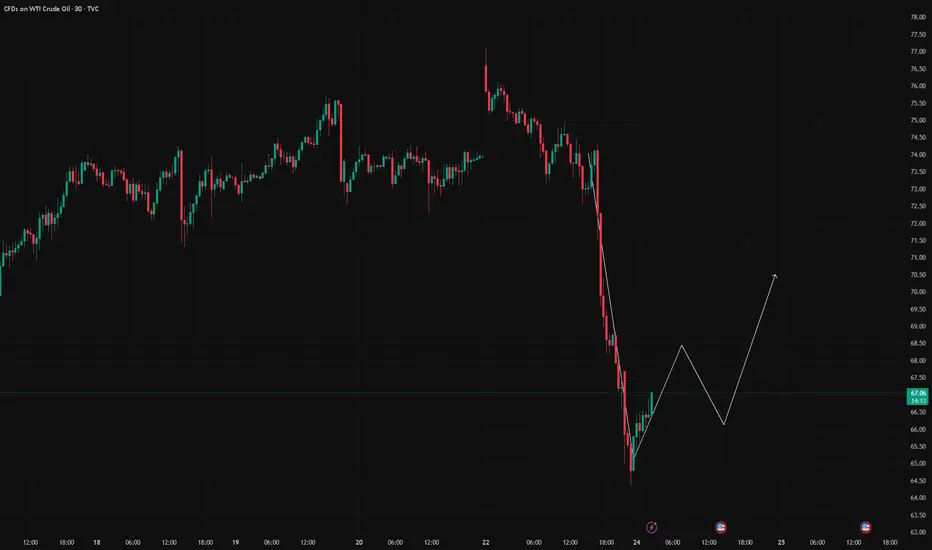
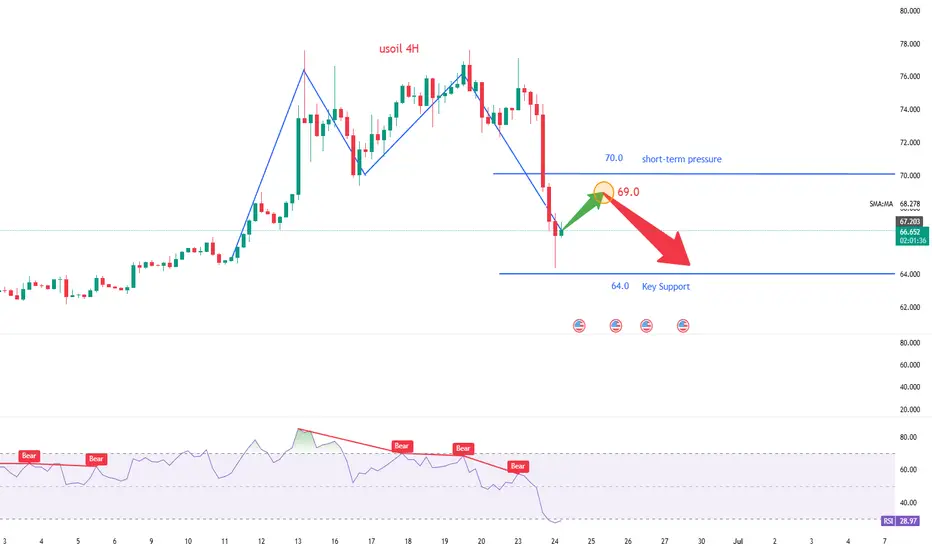
USOIL Expected to Rebound to the 68–70 ZoneUSOIL has shown signs of short-term overselling, and a technical rebound is likely during today’s session. Traders participating in crude oil can consider buying on dips, focusing on short-term opportunities with proper position management. Quick entries and exits are recommended.
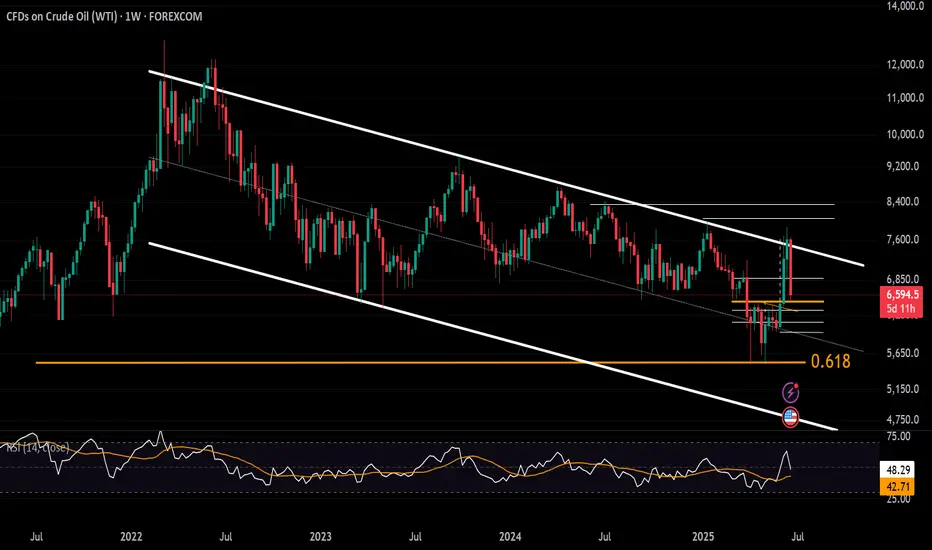
Crude Oil Gets Trapped Back Inside 3-Year Down trending ChannelAfter failing to close above the upper border and the 78 resistance level, and amid renewed hopes for a Middle East ceasefire, oil prices dropped sharply back toward the neckline of the inverted head and shoulders formation—initially broken ahead of the recent war escalation—at 64.70.
A sustained move below that neckline could target crude prices toward the mid-zone of the established channel, near 63.40 and 61.40, where another rebound may take shape.
On the upside, if a clear recovery re-emerges above the 72-mark, the potential for a breakout above the 78-resistance could return, opening the door to revisit the 80 and 83.50 highs.
— Razan Hilal, CMT
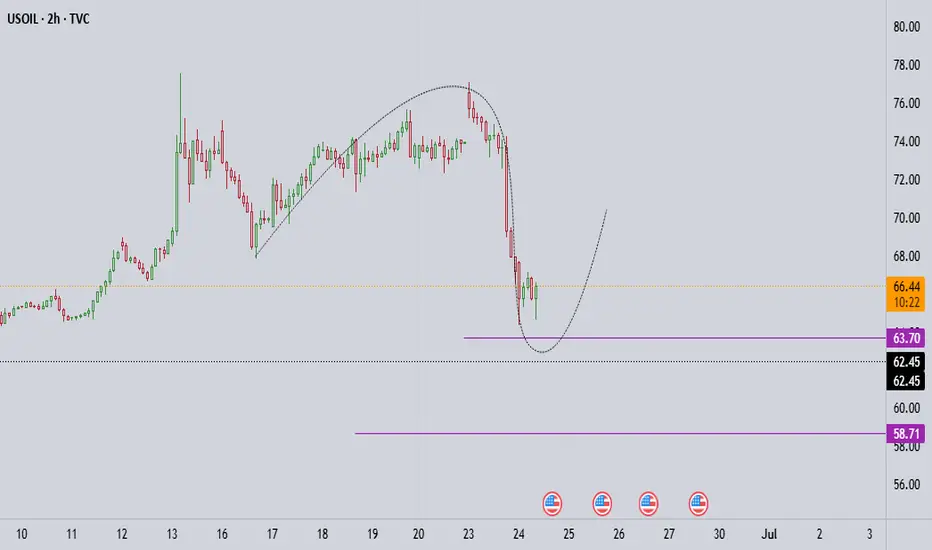
WTI Oil: further downside?Front page news this morning focussed on the ceasefire between Israel and Iran, first announced by US President Donald Trump on his Truth Social platform. However, reports recently emerged of Iran firing missiles, seemingly violating the ceasefire, but no confirmation has been received yet. The point is that things remain somewhat uncertain as of writing.
The technical front, nevertheless, is interesting on WTI Oil (West Texas Intermediate), and ultimately points to a moderate pullback before heading lower.
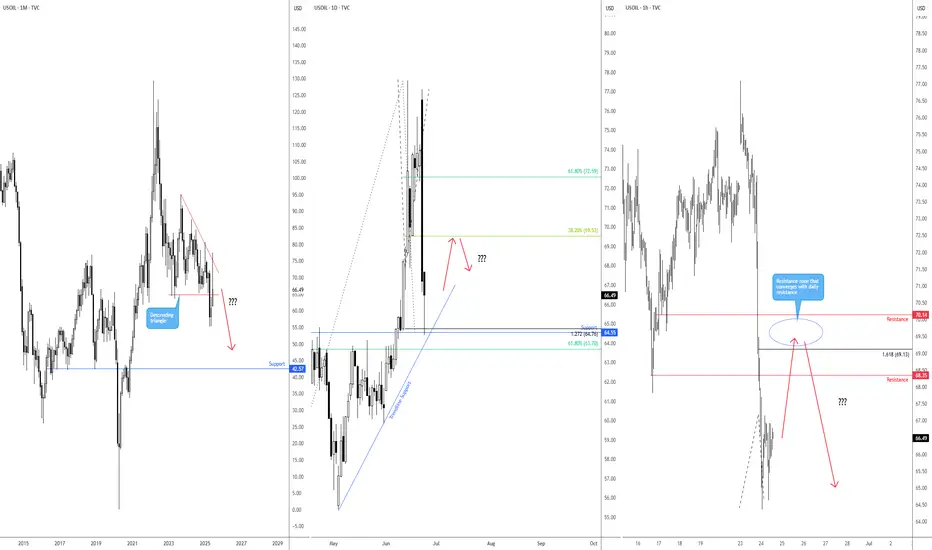
Monthly descending triangle in play
The flow on the monthly chart reveals that price action completed a descending triangle in April this year, formed between US$95.00 and US$64.41. Following the breach of the lower boundary and refreshing year-to-date (YTD) lows of US$55.15, a determined pullback materialised and resulted in the unit testing the upper barrier of the pattern. As you can see, the test has held for now, with June poised to end the month considerably off its best levels.
Given that price has aggressively rejected the upper boundary of the triangle formation, and if we see WTI push to fresh YTD lows, this would unearth a possible bearish scenario in the direction of support from US$42.57.
Daily Fibonacci resistance
Across the page on the daily chart, you will note that recent flow touched gloves with support at US$64.55, a level complemented by a 1.272% Fibonacci projection ratio at US$64.76, a trendline support (extended from the low of US$55.40), and a neighbouring 61.8% Fibonacci retracement level at US$63.70. Given that the 1.272% Fibonacci projection ratio also represents an ‘alternate’ AB=CD support pattern, traders that are long from US$64.55 may aim for the 38.2% and 61.8% Fibonacci retracement ratios of US$69.53 and US$72.59. Consequently, both of these lines serve as potential resistance levels to watch.
H1 confluence
With monthly price suggesting further selling, and daily resistance on the table, the H1 chart shines the spotlight on two levels of resistance at US$68.35 and US$70.14. However, I am more drawn to the latter level as a potential resistance. This is because it converges closely with the 38.2% Fibonacci retracement ratio on the daily timeframe mentioned above at US$69.53, as well as a nearby 1.618% Fibonacci projection ratio on the H1 chart at US$69.13.
As a result, my focus will be on H1 resistance between US$70.14 and US$69.13.
Written by FP Markets Chief Market Analyst Aaron Hill
WTI Is Madness Right NowOil impresses with insane movements. Today, the price lost almost 16 % of its value within one day. Time to speculate on a small countermovement - we are hopelessly oversold!
The latest layout for crude oil today.With geopolitical risks gradually easing, oil prices have deviated significantly from macroeconomic and fundamental guidance. While Iran's situation has shown signs of mitigation, the single-day decline in oil prices was excessive. We believe current oil prices have reached a reasonable range: short positions can still be held, but chasing further shorting is no longer advisable.
On the daily chart, crude oil formed a large bearish candlestick with both no upper and lower shadows, directly breaking below support and continuing to decline. After breaking above the previous high, the breakdown of support indicates that oil prices are falling back again to seek a new trading range. Today, the focus remains on the sustainability of the bearish momentum.
you are currently struggling with losses,or are unsure which of the numerous trading strategies to follow,You have the option to join our VIP program. I will assist you and provide you with accurate trading signals, enabling you to navigate the financial markets with greater confidence and potentially achieve optimal trading results.
Trading Strategy:
sell@68.5-69.0
TP:64.5-64.0
USOIL Buy- Go for buy if entry setup given
- Refine entry with smaller SL for better RR, if your strategy allow
A Message To Traders:
I’ll be sharing high-quality trade setups for a period time. No bullshit, no fluff, no complicated nonsense — just real, actionable forecast the algorithm is executing. If you’re struggling with trading and desperate for better results, follow my posts closely.
Check out my previously posted setups and forecasts — you’ll be amazed by the high accuracy of the results.
"I Found the Code. I Trust the Algo. Believe Me, That’s It."
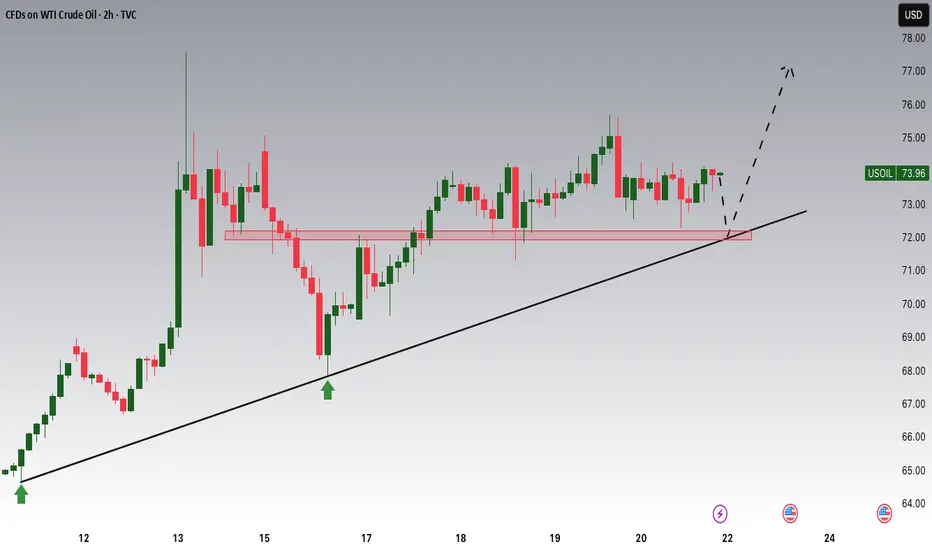
USOIL Potential UpsidesHey Traders, in tomorrow's trading session we are monitoring USOIL for a buying opportunity around 72.00 zone, USOIL is trading in an uptrend and currently is in a correction phase in which it is approaching the trend at 72 support and resistance area.
Trade safe, Joe.
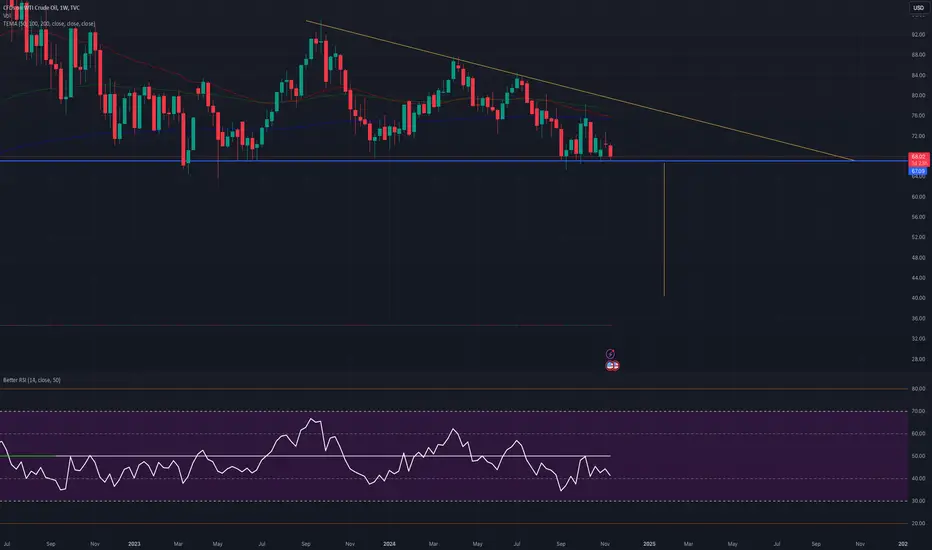
Crude oil is displaying serious weaknessCrude oil is trapped in a descending triangle after a blow off top. might take some time to play out but target for crude oil based on the triangle is 42-40 crude oil.
Today's crude oil trading strategy, I hope it will be helpful toThree Driving Logics Behind Oil Price Collapse: From Geopolitical Ebb to Supply Loosening
(1) The "Security Pledge" for Strait of Hormuz Materializes
As the "lifeblood" for 30% of global seaborne crude oil, blockade expectations for the Strait of Hormuz were the core support for oil prices above $75. However, during the recent attacks, Iran deliberately avoided the strait's vicinity and even issued navigation safety bulletins via the International Maritime Organization (IMO)—this explicit signal of "no supply disruption" eliminated market panic over a "11 million bpd supply outage." Historical parallels show that after Iran attacked U.S. bases in 2020, oil prices surged 4.5% before rapidly reversing to a 1% decline due to the same "uninterrupted supply" logic—a pattern repeating today.
(2) OPEC+ Production Hike Expectations "Undercut the Foundation"
Despite escalating geopolitical tensions, OPEC+ has stuck to its plan to increase output by 411,000 bpd in July, with producers like Saudi Arabia hinting at "further capacity releases if necessary." This combination of "production pledge + supply stability" directly hedges against geopolitical risk premiums. More crucially, while U.S. crude inventories dropped by 11.47 million barrels last week, strategic reserve replenishment demand remains uninitiated, leaving markets focused on potential "oversupply" from OPEC+'s actual production increases.
(3) Aftermath of Trump's "Ceasefire Smokescreen"
Trump's earlier announcement of a "comprehensive Israel-Iran ceasefire"—though unconfirmed by official sources—planted expectations of "conflict resolution" in the market. When Iran opted for "symbolic attacks" over all-out retaliation, capital accelerated its exit from geopolitical risk exposures: data shows WTI net long positions have dropped from 179,100 contracts to 123,000 contracts, with the rapid exodus of speculative capital amplifying price declines.
Today's crude oil trading strategy, I hope it will be helpful to you
USOIL sell@64~64.5
SL:66
TP1:63.5~63
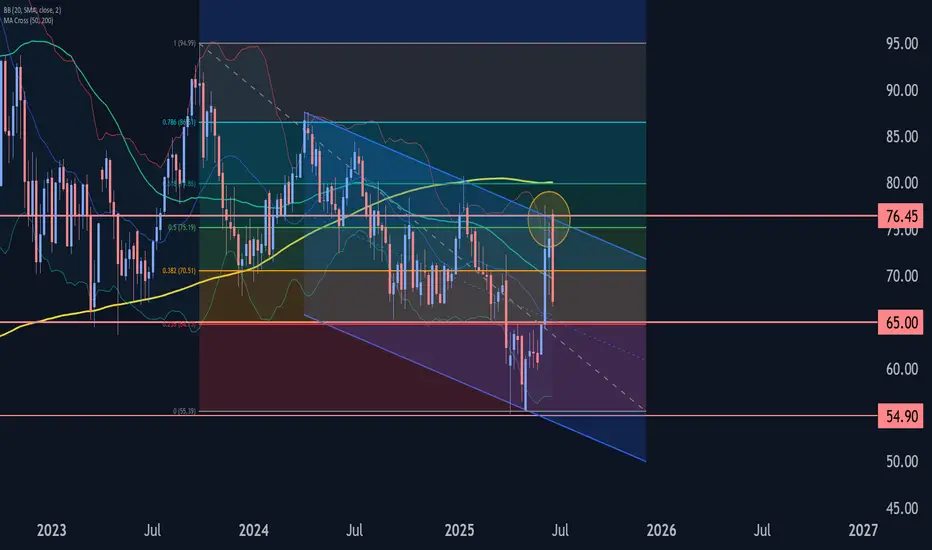
WTI Wave Analysis – 23 June 2025
WTI: ⬇️ Sell
- WTI reversed from the resistance area
- Likely to fall to support level 65.00
WTI crude oil recently reversed down from the resistance area located between the pivotal resistance level 76.45 (which has been reversing the price from the middle of last year), the upper weekly Bollinger Band and the resistance trendline of the weekly down channel from 2024.
The downward reversal from this resistance zone stopped the C-wave of the earlier weekly ABC correction (4) from April.
Given the clear weekly downtrend, WTI crude oil can be expected to fall to the next support level 65.00 (a former yearly low from 2024).
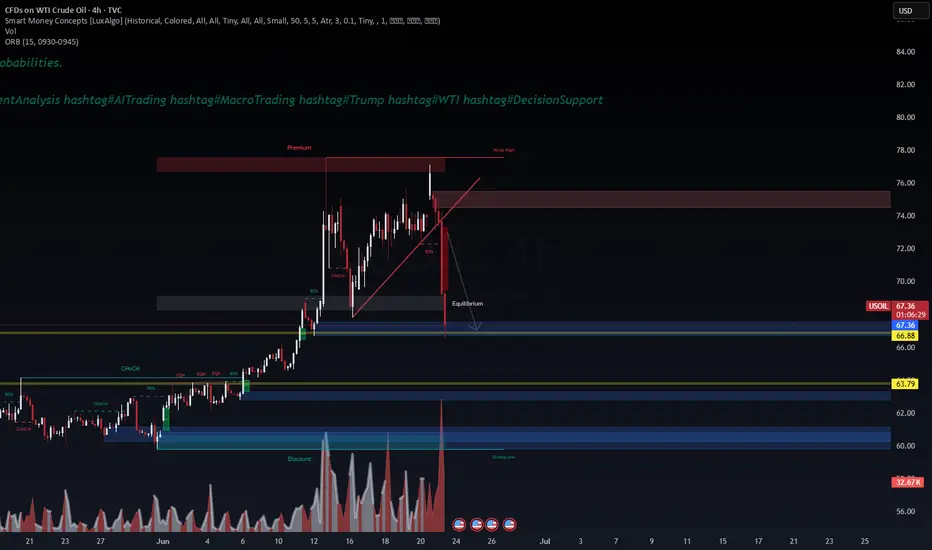
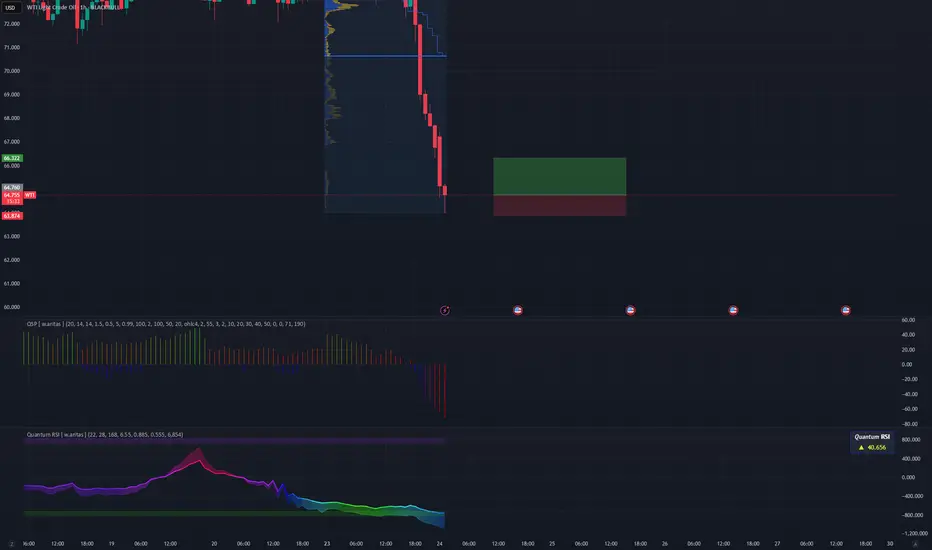
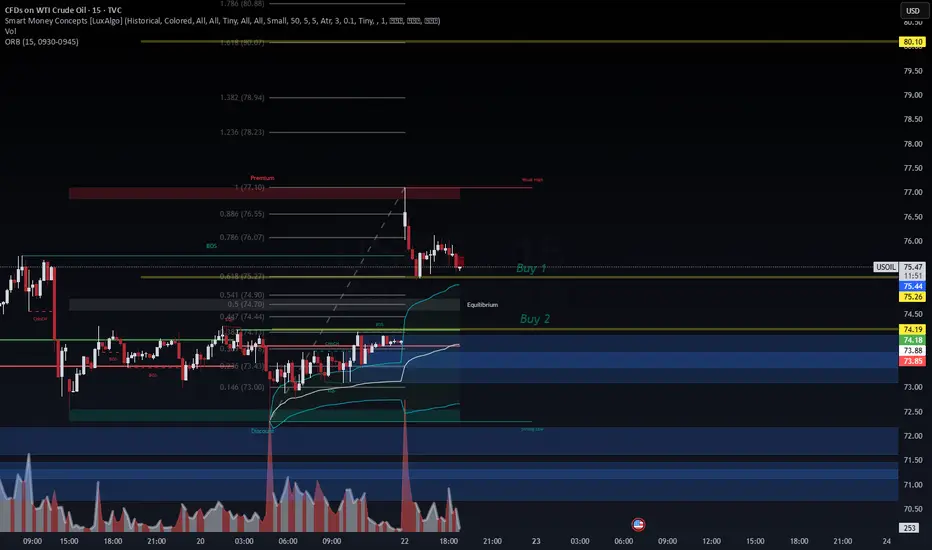
Crude Oil Trade Setup – Macro Narrative Aligned | WaverVanir DSS📍Instrument: WTI Crude Oil (USOIL)
📊Timeframe: 15M | Methodology: Smart Money Concepts + Fibonacci + Volume Profile + ORB
🔍Framework: VolanX DSS | WaverVanir International LLC
📈 Trade Thesis
While much of the world remains fixated on short-term rate expectations and gold/oil volatility, this chart reflects clear SMC structure aligned with the macro backdrop:
Geopolitical Tensions in the Middle East and strategic energy hoarding by global players continue to apply pressure to oil supply narratives.
Inventories remain tight while BRICS+ nations move toward commodity-backed currency talks—oil being the anchor.
The Fed’s neutral stance combined with softening global PMIs points to a fragile growth phase, supporting rebalancing trades into tangible assets like oil.
🧠 Technical Breakdown
Premium/Discount Model in Play:
Current price retraced after rejecting the premium zone at 77.10 with strong bearish volume and confluence at the 1.0 Fib level.
Buy Zone 1:
Around 75.26, near 0.618 retracement—ideal for short-term scalpers with tight invalidation.
Buy Zone 2:
74.18–73.85 marked as Discount OB zone + ORB LOD + VWAP deviation.
Liquidity engineered below BOS—favorable risk-reward for swing re-entry.
Volume Spike Confirmation near 73.90 during London session sweep = high-probability demand.
🧭 Trade Plan
✅ Entry #1: 75.26 – Speculative order flow entry
✅ Entry #2: 74.18 – Confirmed bullish OB zone
🛑 SL: Below 73.70 (invalidates BOS reclaim + OB)
🎯 TP: 77.10 (weak high) and partials at 76.00–76.50
⚠️ Trailing stop after reclaiming 75.70
🧠 Narrative Alignment
As the world shifts toward resource realism, oil becomes more than a trade—it's a proxy for power, policy, and protectionism. This isn’t just a chart—it's a window into the realignment of global influence.
📌 Volatility will be harvested. Order will emerge from imbalance.
—
#CrudeOil #SmartMoneyConcepts #WTI #MacroTrading #WaverVanir #VolanX #OrderFlow #EnergyMarkets #BRICS #FibonacciStrategy #LiquiditySweep #TradingView #TraderMindset
USOIL: Target Reached!Noice! I mean my dss is fully functional and working ! This is going to be my permanant edge.