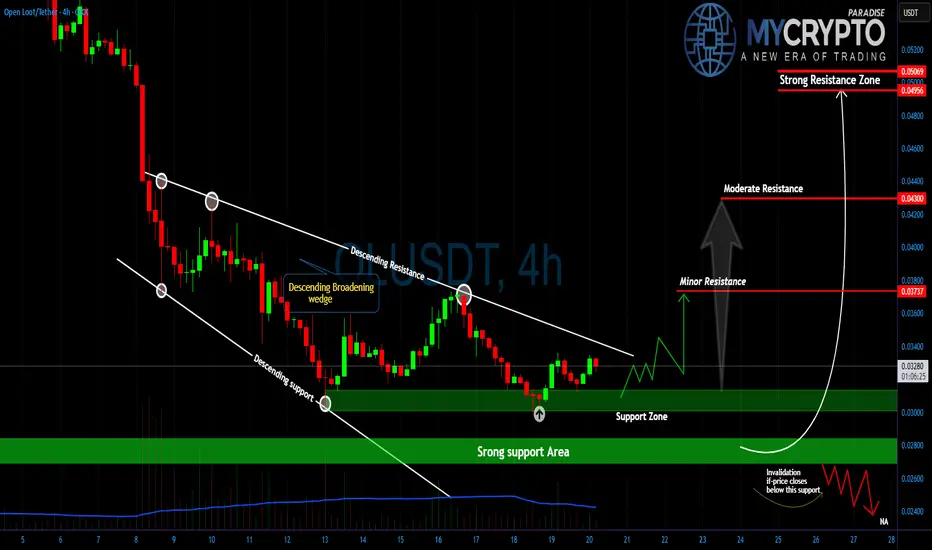
OLUSDT Ready to Explode? Don’t Miss This SetupYello Paradisers, is this the calm before the storm? #OLUSDT has just bounced off a key support zone and is now grinding right under a critical resistance. If you’ve been following our recent plays, you know exactly how this pattern can end with an explosive move that catches the herd completely off
Keep an Eye on OLBinance’s June 8–9 airdrop of 16M OL tokens (Binance announcement) created immediate selling pressure:
📌 Recipients claimed 1,836 OL each (worth ~$73 at $0.04 pricing)
📌 Historical patterns show 60–80% of airdrop tokens get sold within 72 hours- OL’s 24h volume surged 185% to $281M, confirming d
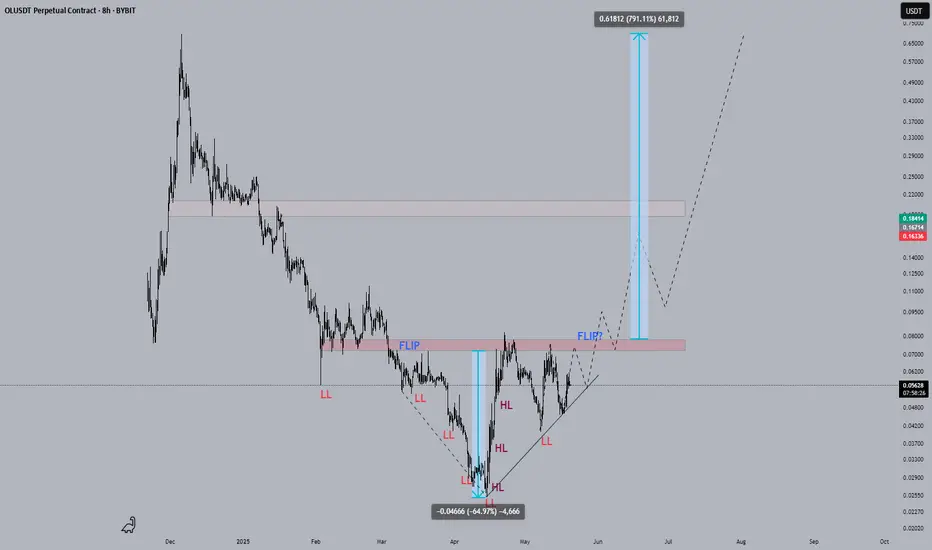
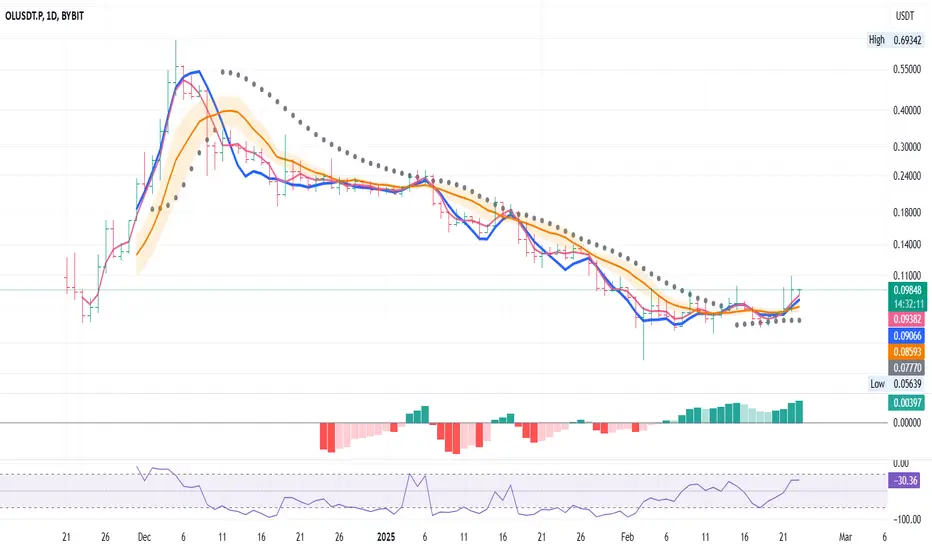
OLUSDT ProjectionFollowing a significant -65% decline after a failed support FLIP, the market has begun to shift structure with a series of higher lows (HL) and a potential accumulation pattern forming in the shape of a contracting triangle.
Key Observations:
Initial breakdown came after a support-to-resistance FL
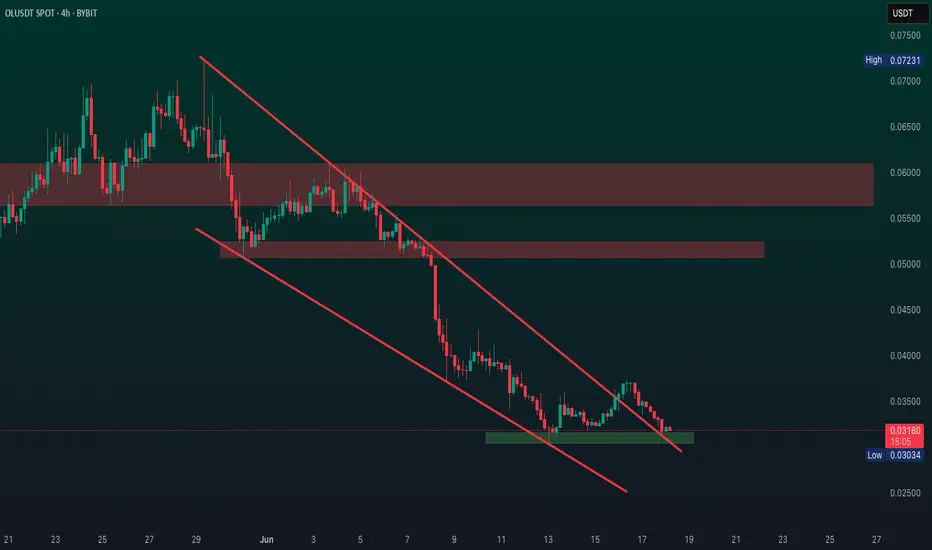
Open Loot: A low-cap coin worth considering.Open Loot is a newly launched Web3 gaming token, and after a prolonged downtrend, it has finally shown a strong rebound of 220% over the past couple of weeks.
The price is currently trending above a key support level (previously a resistance), and with a slight retest, it’s likely to begin its next
OL/USDT Long Re-entry signal
On February 15th, we received an entry signal when the PSAR turned bullish. On February 18th, the PSAR was hit, signaling an exit. On February 22nd, the day closed above the initial entry level from February 15th. This gives us a potential opportunity to enter again since we had a close above the o
OLUSDT | Mapping Out Possibilities | Near Term (4HR)OLUSDT | Mapping Out Possibilities | Near Term (4HR)
As part of my profit taking strategy, I like to go through and map out potential levels of interest based on semi-bullish to very bullish mock up price action using fractals and fibs.
Based on concept of money flow... BTC, then ETH, then Larg

See all ideas
Summarizing what the indicators are suggesting.
Oscillators
Neutral
SellBuy
Strong sellStrong buy
Strong sellSellNeutralBuyStrong buy
Oscillators
Neutral
SellBuy
Strong sellStrong buy
Strong sellSellNeutralBuyStrong buy
Summary
Neutral
SellBuy
Strong sellStrong buy
Strong sellSellNeutralBuyStrong buy
Summary
Neutral
SellBuy
Strong sellStrong buy
Strong sellSellNeutralBuyStrong buy
Summary
Neutral
SellBuy
Strong sellStrong buy
Strong sellSellNeutralBuyStrong buy
Moving Averages
Neutral
SellBuy
Strong sellStrong buy
Strong sellSellNeutralBuyStrong buy
Moving Averages
Neutral
SellBuy
Strong sellStrong buy
Strong sellSellNeutralBuyStrong buy
Displays a symbol's price movements over previous years to identify recurring trends.