OMG graph damaged not cup teain cup have 6 number but no have 7, OMG will fall severe beware at 17 aug 2020 wait 2 week for buy this is signal fake OMG do fail, i go buy LTC 100% my money, LTC be cup upside down full signal 7 number
OMGUSD trade ideas
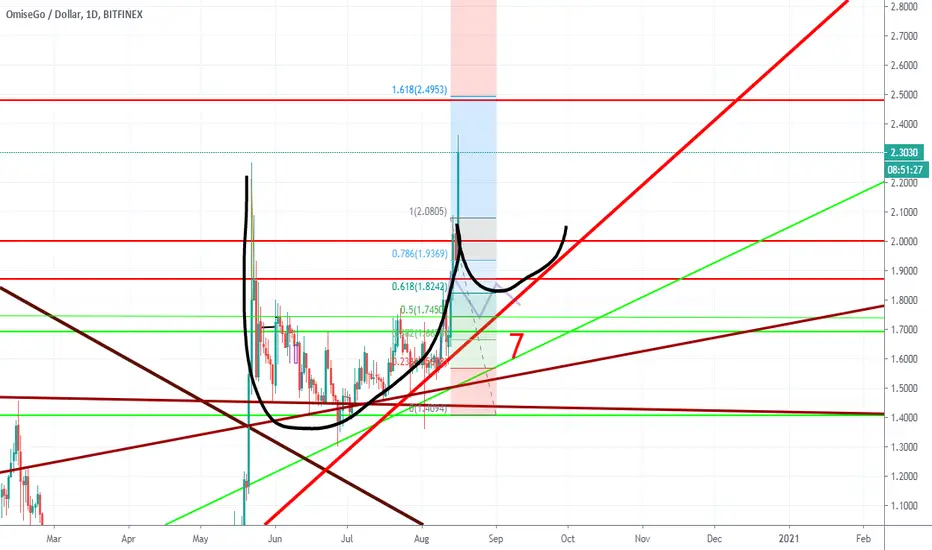
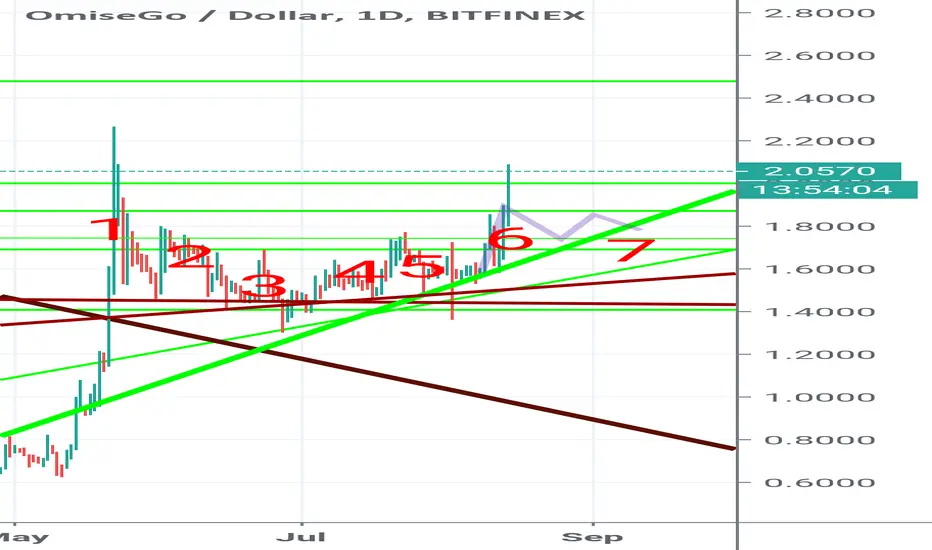
VISA use system OMGChainLink coin go and other, OMG at 0.7 fibo to 1.fibo, all this is brake for go continue

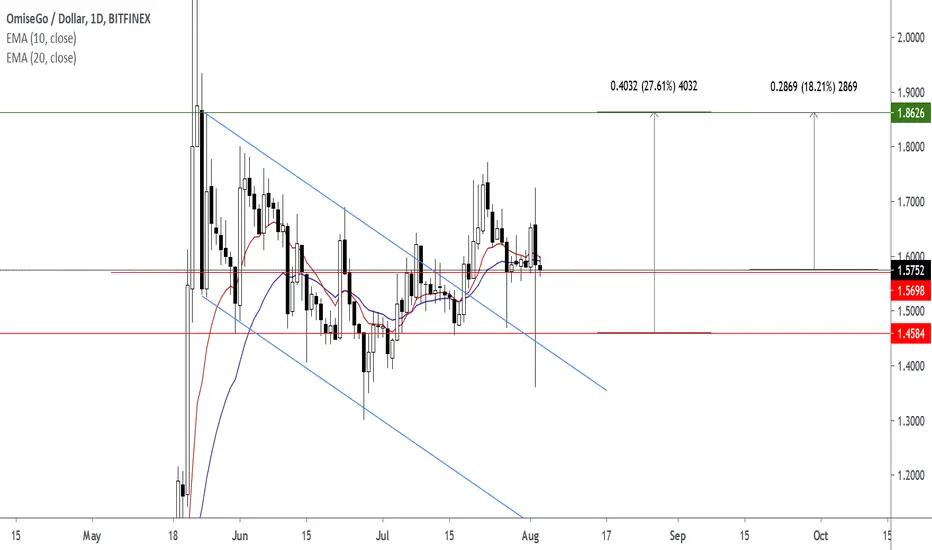
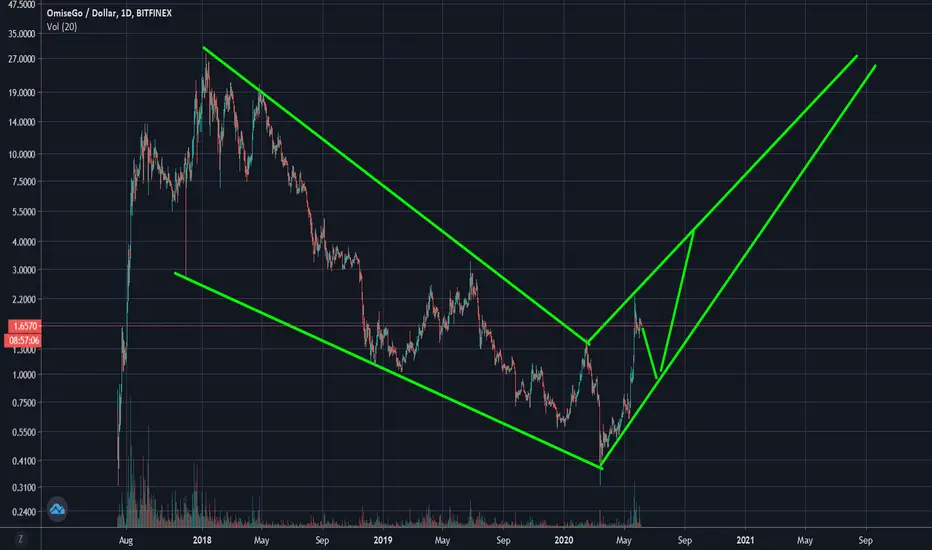
OmiseGo PossibilitiesPossibilities for this flag like formation that has formed on the USD pair
not the strongest bull flag ive seen, hence the bearish scenario.


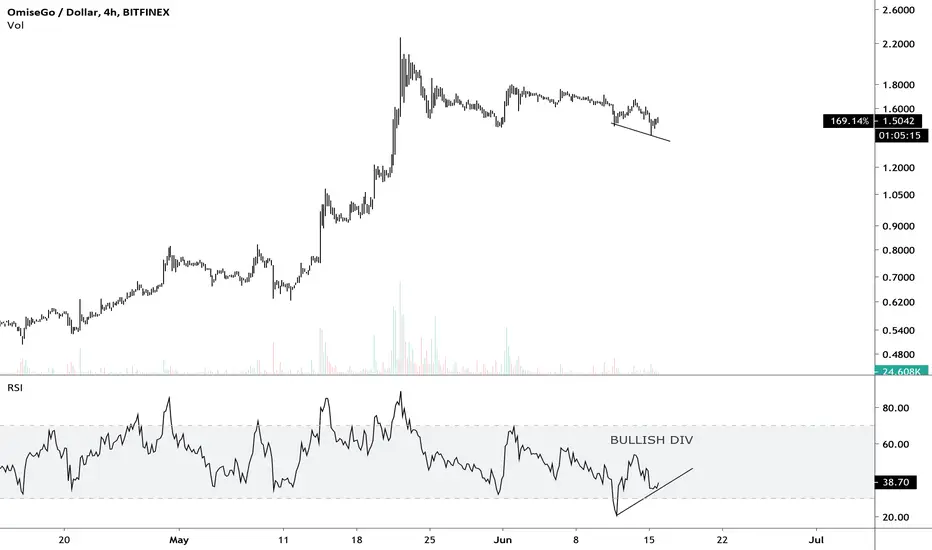
Where is omisego about to go?Smaller time frame resistance has been broken and is currently retesting so I'm expecting a launch soon or we may just stay flat for a while

Patience Will Reap Rewards For $OMG We're taking a look at $OMG because the Quant Market Scanner recommended that we take a peak at these guys (their price action is noteworthy over the past few days).
We're going to start with on the one day resolution.
Above we have a case of a classic overhead downtrend resistance (short-term) that's been broken (with volume).
The latest screenshot shows failed attempts by the price to break above the overhead diagonal downtrend resistance (four failures).
All of these failures lead up to the eventual explosion above the overhead downtrend diagonal resistance.
Zooming in a bit closer, we can see that there was substantial volume accompanied with this break as well (which is typically what we want to see as a *confirmation* of a legitimate break above the overhead diagonal downtrend resistance).
Another Look at Things
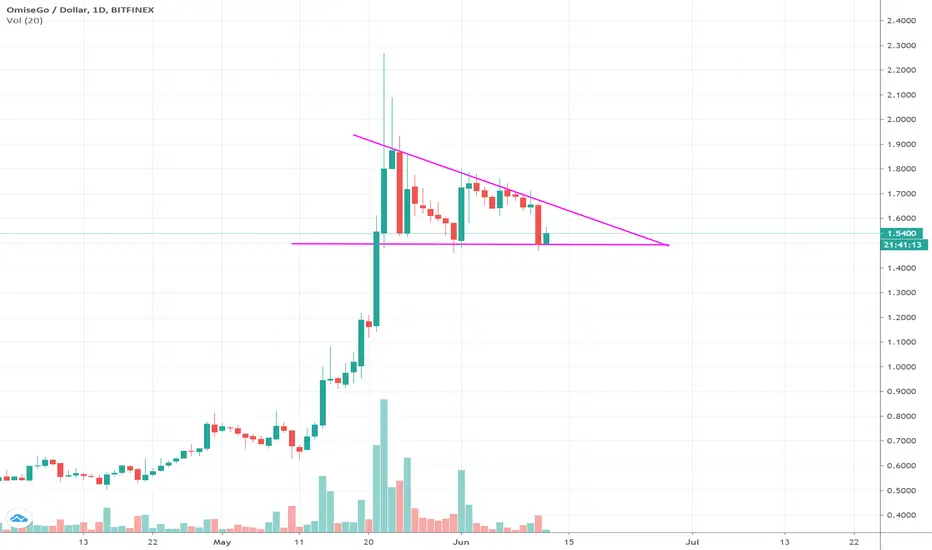
If you're not a believer in the idea that there was a legitimate overhead diagonal downtrend resistance suppressing the price, then perhaps the overhead horizontal resistance presents itself as a more palatable theory.
See below:
If This is the Case
Then we'll have an easier time plotting a potential 'retouch' (if there is one) for the price.
> 'Retouch?'
Typically when there is a break over an overhead resistance of some sort (or vice versa), the price tends to retest the former resistance as a support point during its ensuing consolidation period (if it comes to that).
Conversely, if the price breaks below a major support that had ben thwarting continued price action, then there is usally a re-test of the support as a resistance point before the price moves further south.
Here is What That Would Look Like
Assessing Distance Between Current Price Action and the Underlying Support (former overhead resistance)
We're going to map our trading strategy around the assumption that the price does consolidate at some point in the near future to re-test that previous overhead horizontal resistance as a support before continuing north.
However, before we can solidify this as an idea, we need to make sure that the distance between where the price is at (at the time of writing) and the (now) underlying support is not too great (otherwise, this may be a no go).
Perfect, just -5% from entry position (if we were to place a bid at th8e current floating exchange rate for $OMG).
Looking For the Next Overhead Resistance
There isn't a lot to go from...but there is something.
See below:
As shown in the chart above, we drew our overhead resistance by using the previous localized ATH on the chart (dating back around May 21st/22nd, 2020) - which is priced at $1.90.
Distance Between Current Price Action and the Overhead Resistance We Drew
To get a sense for our potential upside on this move (assuming it plays out), we're going to measure the distance between where the curren floating exchange rate for $OMG and that overhead resistance point ($190).
Conclusion
1. $OMG is already on a "winning streak" currently (heavy uptrend over the last few weeks), so we're not going to waste too much time looking at momentum indicators here since we're not in a rush for this move to play out.
2. There's a clear underlying support point that **should hold up** (unless there is some catalyst for negative price action for $OMG that creates this bearish price actoin with such volatility that it breaks straight through the underlying support). We doubt that any such event will manifest (unless it involves the broader crypto markers in some way).
3. The overhead resistance is pretty intuitive at this point as well (there's no other logical place to draw an overhead resistance target ; the $176 price amrket has no other interactions with $OMG's price action that would justify us marking it out as an overhead resistance point).
Drawing Up an R/R From Here
This feels like a fair R/R for $OMG currently:

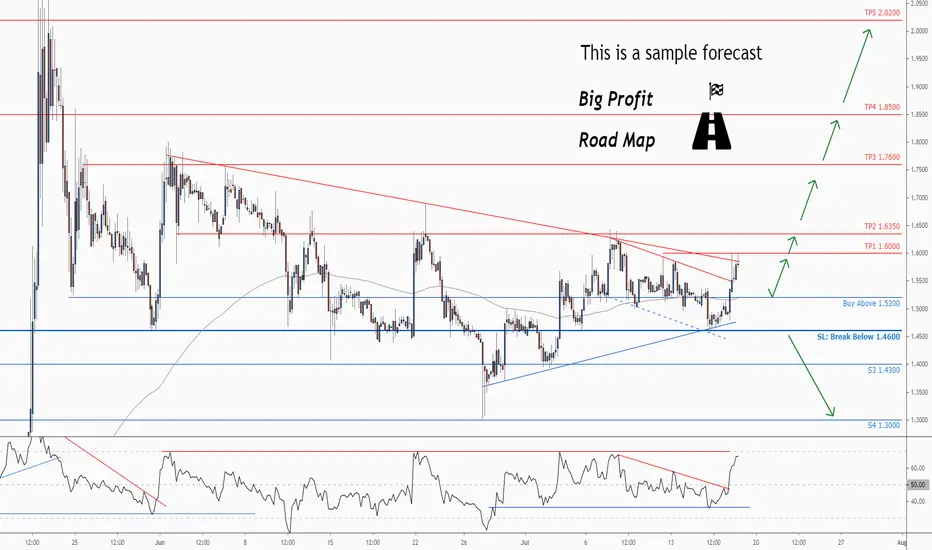
Don't miss the great buy opportunity in OMGUSDTrading suggestion:
. There is a possibility of temporary retracement to suggested support line (1.5200). if so, traders can set orders based on Price Action and expect to reach short-term targets.
Technical analysis:
. OMGUSD is in a range bound and the beginning of uptrend is expected.
. The price is above the 21-Day WEMA which acts as a dynamic support.
. The RSI is at 65.
Take Profits:
TP1= @ 1.6000
TP2= @ 1.6350
TP3= @ 1.7600
TP4= @ 1.8500
TP5= @ 2.0200
SL= Break below S2
❤️ If you find this helpful and want more FREE forecasts in TradingView
. . . . . Please show your support back,
. . . . . . . . Hit the 👍 LIKE button,
. . . . . . . . . . Drop some feedback below in the comment!
❤️ Your Support is very much 🙏 appreciated! ❤️
💎 Want us to help you become a better Forex trader ?
Now, It's your turn !
Be sure to leave a comment let us know how do you see this opportunity and forecast.
Trade well, ❤️
ForecastCity English Support Team ❤️
When get in long for OMG?Every vertical line represent a fixed time of each day, 12 AM +11 UTC.
We can deduce that each break up occurs a slight instant after these lines, so it would be ideal to enter just before.
Of course not every time this theory works, but we can see that each mounted is preceded by these lines. It's just a theoretical entry for a long time in the market
media.discordapp.net
I have circled the times the theory has worked.*
please give me your opinions on this theory, and tell me yours, we will progress like that ♥

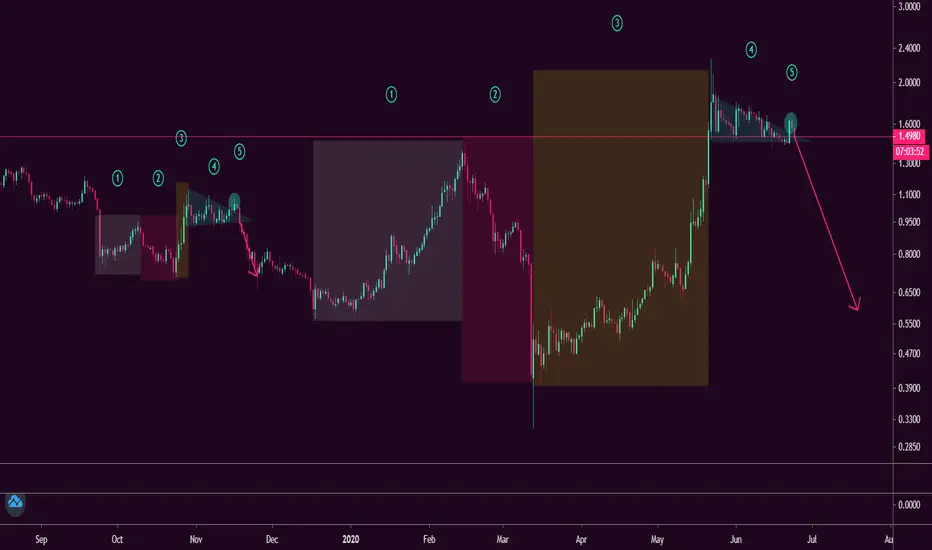
OMG fractalA lot of alts making similar fractals now pointing down.
Good location for a short position with a stop above fakeout of triangle.
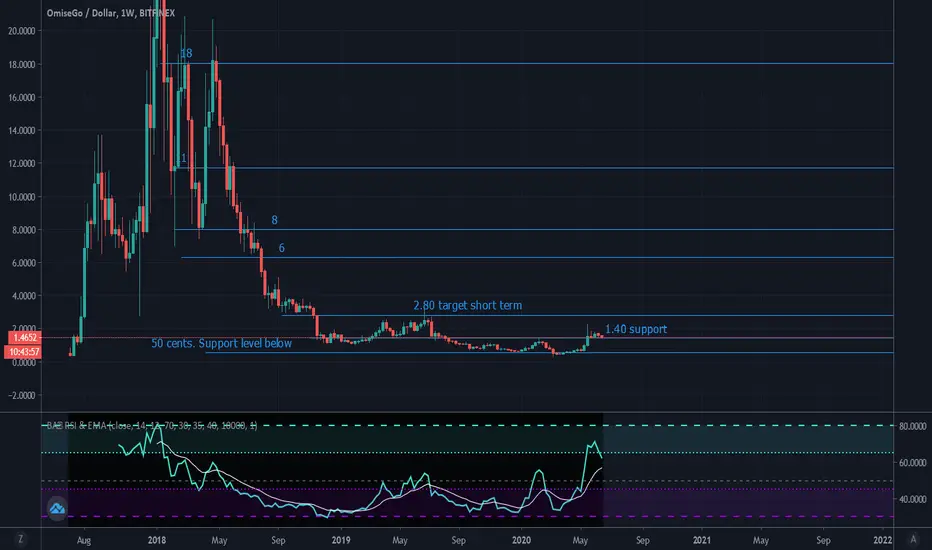
OMGNETWORK 6.21.20OMG has been in a low volatility descent for around 18 months. It seems to have found some strong support around 1.40. Short/medium term targets I am looking for a 2x. OMG Plasma scaling solution looks like a real competitor in the space and is absolutely necessary. The question is can it compete with networks like Matic and Loopring and will their be a need for multiple scaling solutions?
I like the fact that OMG has a low circulating supply and is a true low cost solution for Ethereum transactions .

OMG 1d candles lining up with Bitfinex USDT intergration?CTO of Bitfinex stated that USDT integration onto the OMG network would be within a month. Just following some candles put against news again. Not financial advice.
Sideways or temp downtrend?~1m until bitfinex USDT is put on OMGCTO of Bitfinex Paolo Ardoino tweeted "We're still actively working on the implementation.
Within 1 month I think" in response to the question "OMG is very wise choice. 👍👍 When can we expect the first tnx on the network?"
We could POSSIBLY (things are getting crazy right now so who knows) see a temporary downtrend until Bitfinex's USDT volume is put on the OMG network or it could go sideways. Not expecting this to last long as the bitfinex USDT integration on the OMG network is a HUGE first step & unveil for Omise let alone all the news of more integration that is soon to come. Not financial advice.

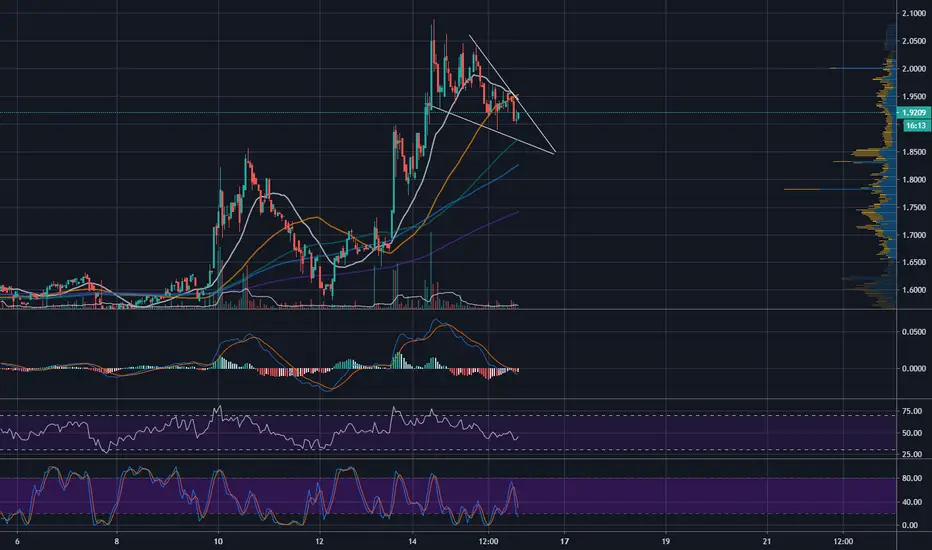
OMG, Flag pattern ? Huge Breakup ?We can see a potential Flag pattern here.
A previous on left from 21 May bring us to the moon, and all this with small volumes.
Next candle need to be red.

USDT Move to OMG Plasma sidechain Transferring USDT coins to the OMG network will save money fee, work 2 network, june 1 use Proof of Authority do reduce fee, use OMG to OMG easy,OMG Reduce global warming process use energy little

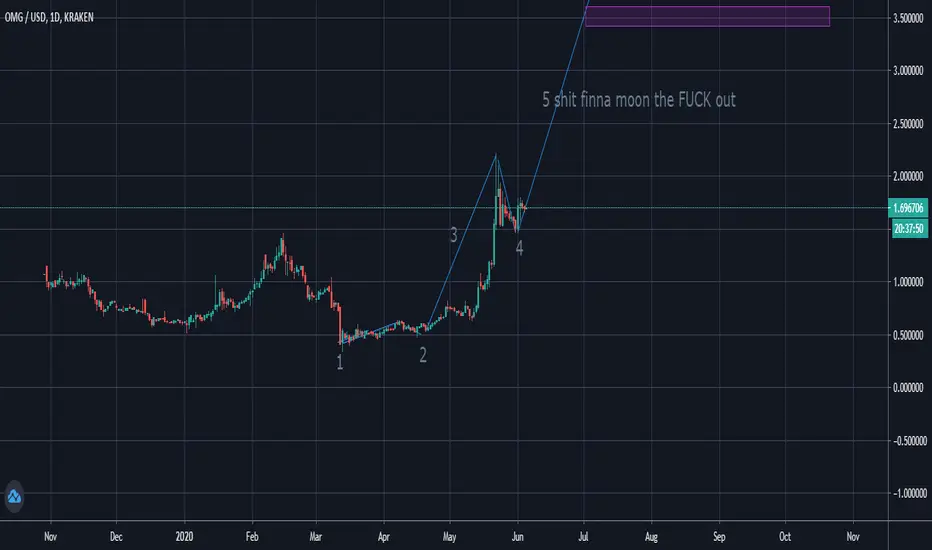
ohmygod 6.5.20this token has tons of upside potential. just being added to coinbase will pump it to at least 5-6 dollars in a short time. easy money. long term play.
OMG tether news, shit about to pop offTether gonna be moving volume to OMG Network, volume finna pop out the roof on their network, trend gets me rock hard