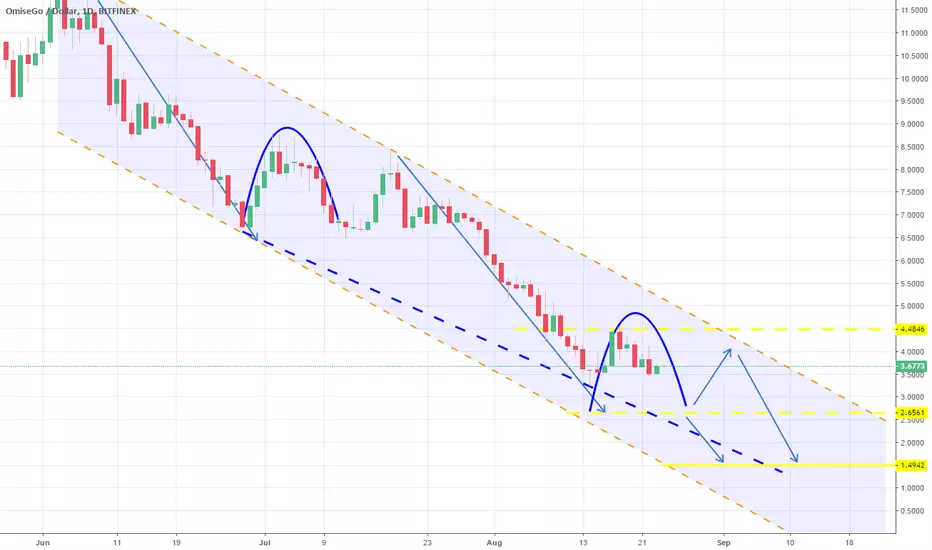
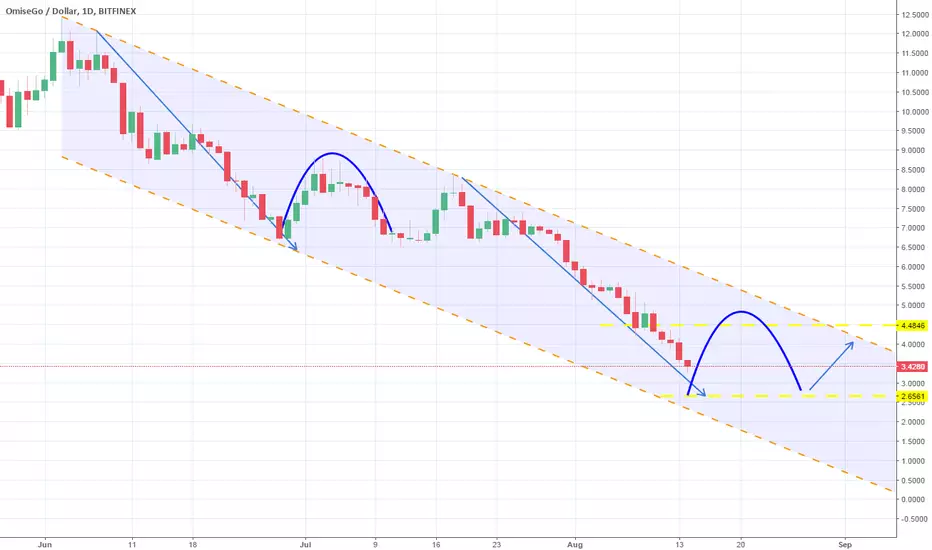
Rebound successful. Now resuming the downtrend. Short.OMGUSD has followed the curve pattern making a new Lower High within the 1D Channel Down (RSI = 35.624, MACD = -0.624, Highs/Lows = 0) and will now either trade sideways to 4.000 in order to exhaust the consolidation or test 2.6561. In both cases the underlying trend will remain bearish. TP = 2.6561 and 1.4942 in extension (but under circumstances for which updates will follow).
OMGUSD trade ideas
OmiseGO: Scalping a Long Here Let’s take a look at $OMG and see what’s it’s been doing as of late.
Above is a view of $OMG on the 3-Day chart.
To say that the support line that I drew horizontally across the chart that you see above is strong in any way, would be an overstatement.
However, if you look closely, it does appear as though the price has failed to move the price below this level. Although, it’s relatively untested and there are no indicators that appear to give any signs that things will be changing anytime soon.
It appears that once the price through the long-term $7.50 support that was holding (it’s the overhead resistance now in the chart that you’re currently viewing if you’re following along on TV).
Let’s Zoom in to the 1-Day Settings
When you look more closely at the 1D settings, you can see that the price of $OMG, is indeed at a support point.
Once again, this is only the second time that the price has tested this support, so there isn’t really enough credence to suggest that it’s strong other than its apparent repelling of the price after that zone was hit. ‘
The touching of the support twice before bouncing (slightly) on the second test shows a potential double-bottom play evolving in the future.
Potential Gains
The downtrend resistance that is directly overhead from where the price is right now, represents a 43.66% appreciation in the price:
However, this is far from a guarantee.
If the price falls through the support that it is at currently, then $OMG holders would be screwed.
Fibonacci Chart
If we draw the Fib chart where the ‘support is at currently’, which assumes that $3.50 is the 100% retracement point, then we get a solid visual of the chart for users to check out ^^.
Currently, it has no major bearing on the price.
Conclusion
$OMG could be due for a bounce soon.
However, this is far from guaranteed; so we need to make sure that we set a solid R/R on this, because a break through this support point could seriously spell disaster for holders.
Target hit. Approaching a support.TP = 4.4846 hit, as the 1D Channel Down (MACD = -0.838, Highs/Lows = -1.1547, B/BP = -2.4051) continued its decline and OMGUSD now looking to price the Lower Low near the second target at 2.6561. With RSI on 1D oversold at 20.599 along with another 4 indicators, it is not unlikely to see a minor rebound (within the channel down) before hitting the target.
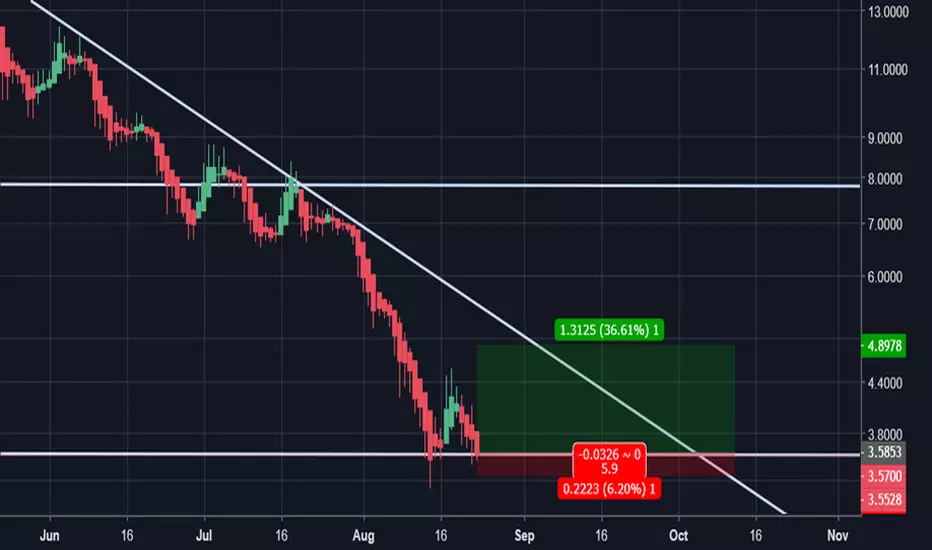
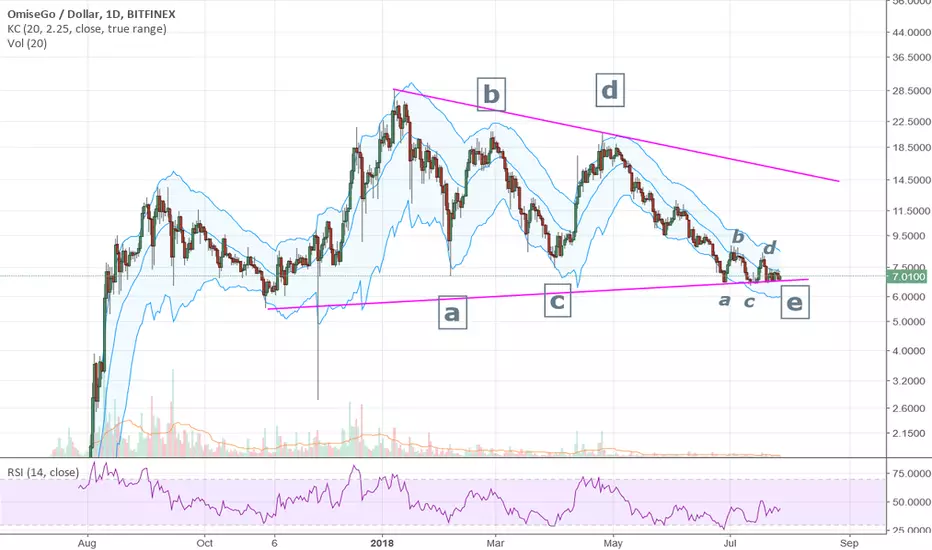
Omise Go Could Be In For a Massive DropGood morning,
I am looking at a massive triple top on the daily chart of OMG. We are currently testing the neckline, if we are to breakout the measured move would be to the $2.75 to $3.65 range. I expect to see a lot of buyers step in at that point to signal a reversal, I will be one! Until this pattern resolves itself or proves me otherwise I will remain in cash.
Happy Trading!

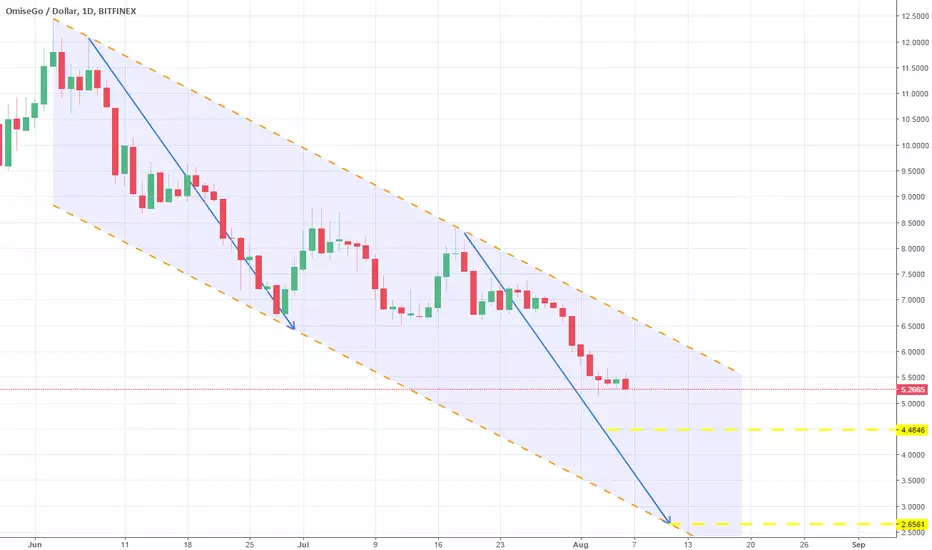
Channel Down on 1D. Short.OMGUSD is trading on a clear 1D Channel Down (RSI = 28.391, MACD = -0.560, Highs/Lows = -0.8476, B/BP = -1.2255), which since pricing its Lower High near 7.000 still has significant downside potential, despite the oversold STOCH, STOCHRSI, Williams. Our position on Omisego is short with TP = 4.4846 and (under circumstances that will be updated on the next post) 2.6561.
OMGUSDDouble top or triple bottom?
The triple bottom is a simple reversal figure of technical analysis which consists of three minima and presages a price increase
It all depends on BTC if you manage to hold above 7800 then the OMG will form a triple bottom and you can expect the test of the line and the channel resistance
If Bitcoin does not stand then a breakdown of the support line will follow and a double top will form with a break through the support line
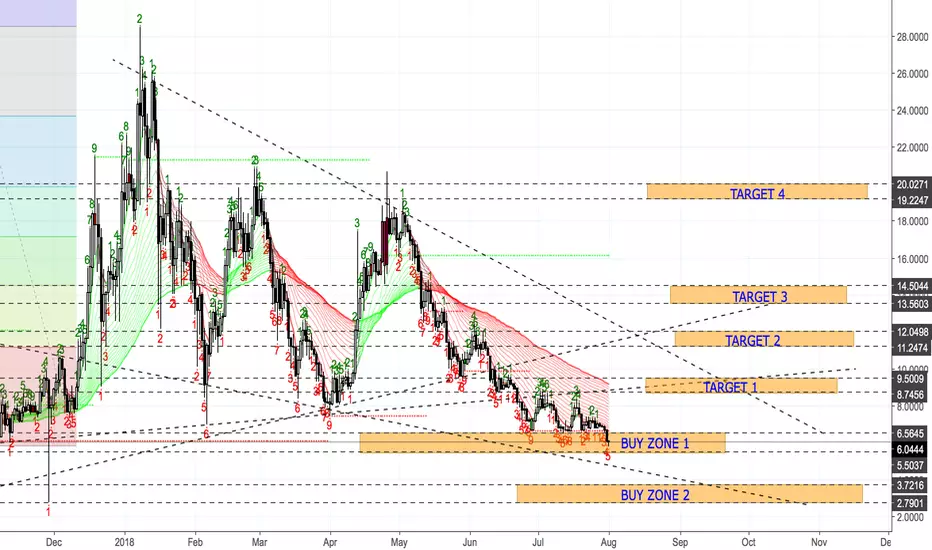
OMG/USDT - Signal - Buying and HoldingWelcome Guys, this time as I said we just buy and hold, not sell for all Alt coin/USDT.
You can enjoy some last analysis post, I just use the same indicator and same method to find the BUY ZONE and TARGET ZONE.
This time I reveal about OMG/USDT so I just post the zone for all you can buy and hold for long time.
BUY ZONE 1: 5.5$ - 6.56$
BUY ZONE 2: 2.79$ - 3.72$
TARGET 1: 8.74$ - 9.5$
TARGET 2: 11.24$ - 12.04$
TARGET 3: 13.56$ - 14.5$
TARGET 4: 19.22$ - 20.02$
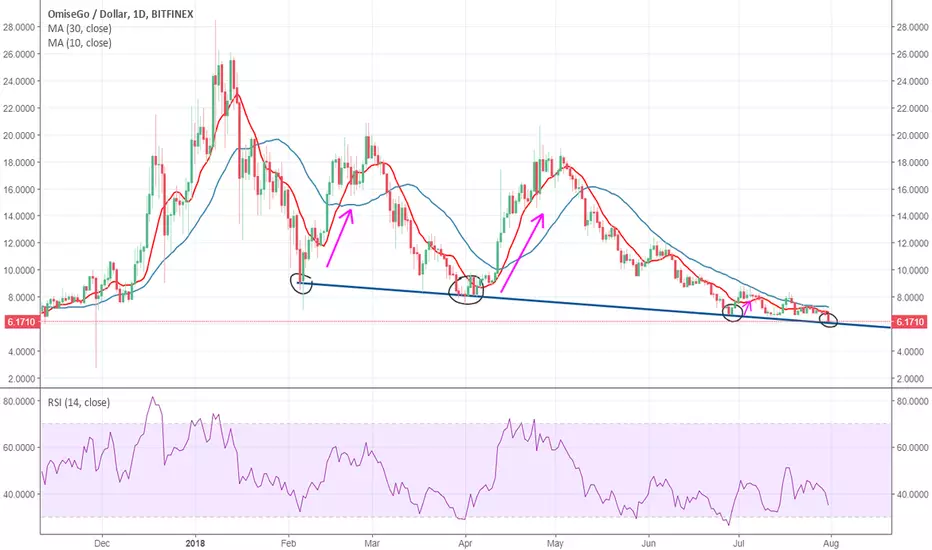
OMG/USD - Easy profit or not?Hello everyone, I'm back with my new trading idea. As you can see, OMGUSD has touched the descending support ( BLUE LINE ) few times in the past 3 months. Everytime it touched the support, the price went significantly up. RSI is 34 , which is near the oversold level. In my opinion, we can expect the price to go up in the next 2-3 days. Maybe it could drop a bit lower, but this is still a good time to get on the train :)
Have in mind that I'm still a beginner and this idea might fail quickly after posting this idea. Always do your own research before getting in any trades. Good luck. :)
Please tell me what do you think about this idea in the comments and if you agree with me, please rate it up :)
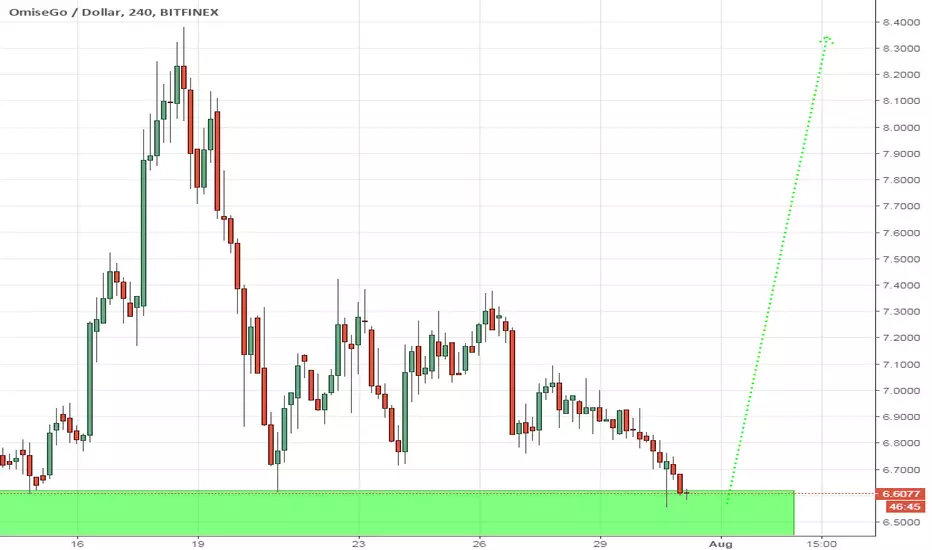
OMG is getting ready for a pumpIt has been consolidating lower just above the big support level at 6.50, so we expect at least a pump up to $8 if we dont have any drastic big down move in the broader market.
OMG/USD my idea - Please don't judge, I'm a newb :)Just my idea for OMG/USD pair in the upcoming 2-3 days. Please note that I'm a total beginner and this idea might fail the moment after I post this.
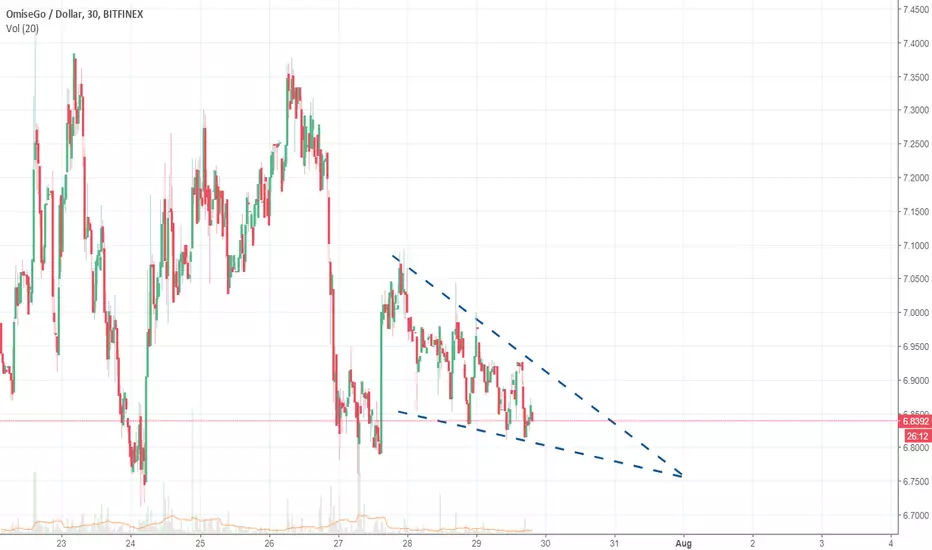
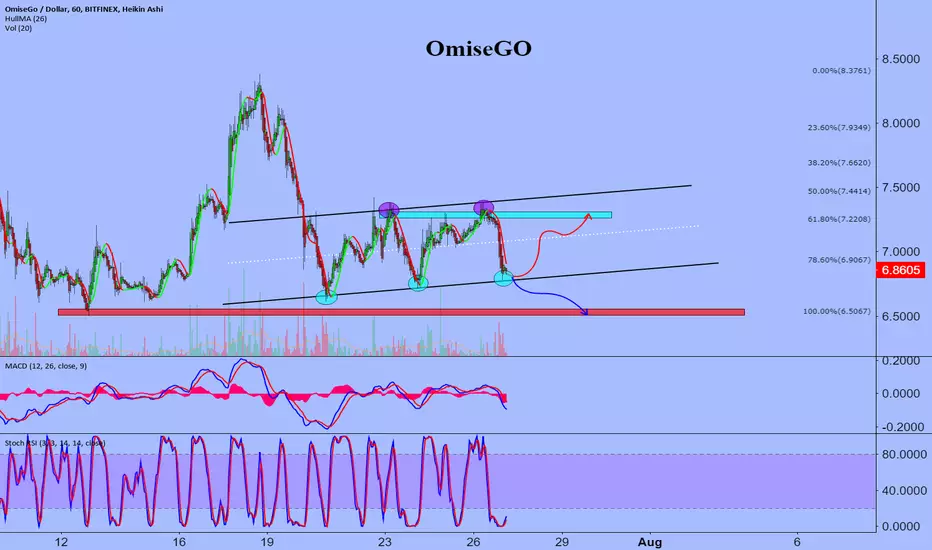
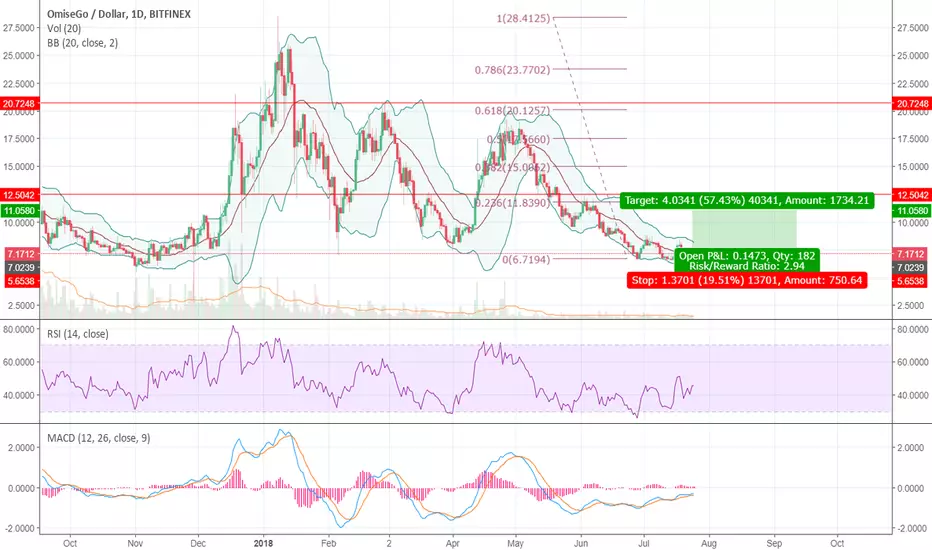
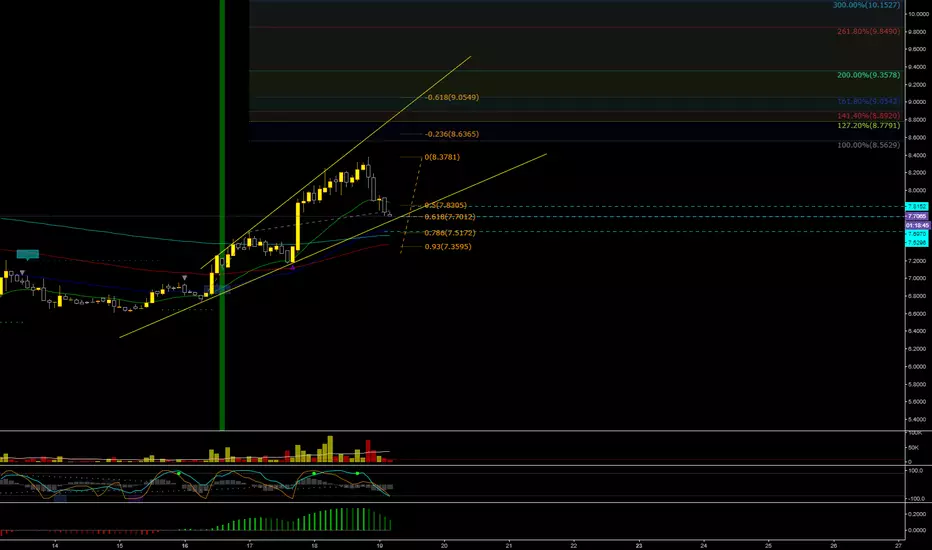
OMG/USD Long 1:2 Mid-Term TradeLong Entry: 6.65-6.90
Target 1: 7.19
Target 2: 7.27
Target 3: 7.35
Stop Loss: 6.58 for tighter one
Risk:Reward 1:1.78 to 1:2 according to your entry level.
Time: 3 days 12hours.
This is a trade I'm in right now, I got in a bit early at 6.96 but I will accumulate my position down between 6.8 and 6.65 range. OMG has upcoming 3 events. 2 Exchange Listing and a summit.
July 30 - Listing on Coinx(www.coinevents.co)
July 31 - Listing on BitPanda
August 1 - Decentralized Web Summit
Also they have an Airdrop - Electrify.Asia in August according to coincalendar.com
If we reach the targets according to plan I might hold the position and change the targets for a potential uptrend reversal. Also you can see the 2 possible scenarios by looking at the white and yellow elliot waves. Let's see how this is gonna work out.

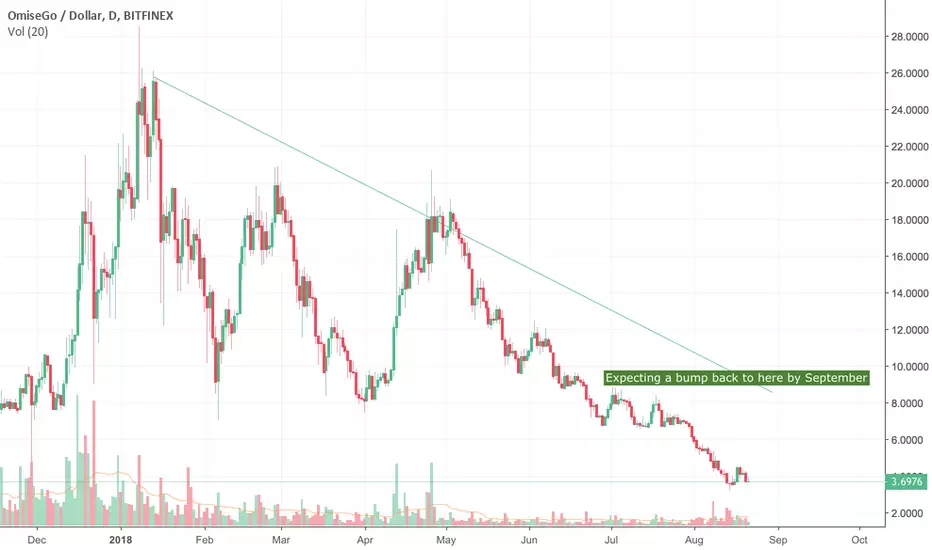
OmiseGo Triple BottomAppears to be a triple bottom for OmiseGo and would expect to take some profits at $9.50, $10.00 and possibly $10.50 in the coming weeks.

There is a possibility for the beginning of an uptrend in OMGUSDTechnical analysis:
. OMISEGO/DOLLAR is in a range bound and the beginning of uptrend is expected.
. The price is below the 21-Day WEMA which acts as a dynamic resistance.
. The RSI is at 41.
Trading suggestion:
. There is a possibility of temporary retracement to suggested support zone (7.00 to 5.50). if so, traders can set orders based on Price Action and expect to reach short-term targets.
Beginning of entry zone (7.00)
Ending of entry zone (5.50)
Entry signal:
Signal to enter the market occurs when the price comes to "Buy zone" then forms one of the reversal patterns, whether "Bullish Engulfing" , "Hammer" or "Valley" in other words,
NO entry signal when the price comes to the zone BUT after any of reversal patterns is formed in the zone.
To learn more about "Entry signal" and the special version of our "Price Action" strategy FOLLOW our lessons:
Take Profits:
TP1= @ 8.72
TP2= @ 9.60
TP3= @ 11.68
TP4= @ 14.90
TP5= @ 18.20
TP6= @ 20.09
TP7= @ 28.50
TP8= Free

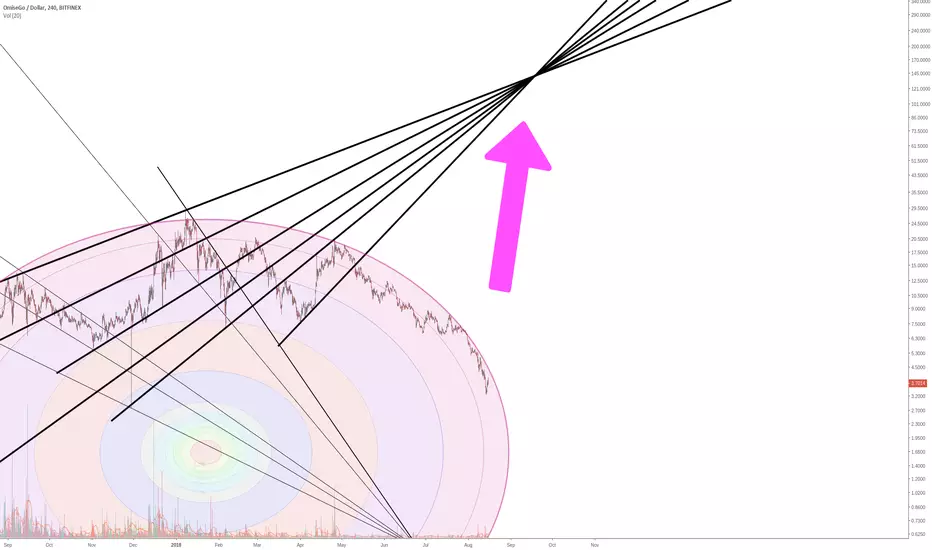
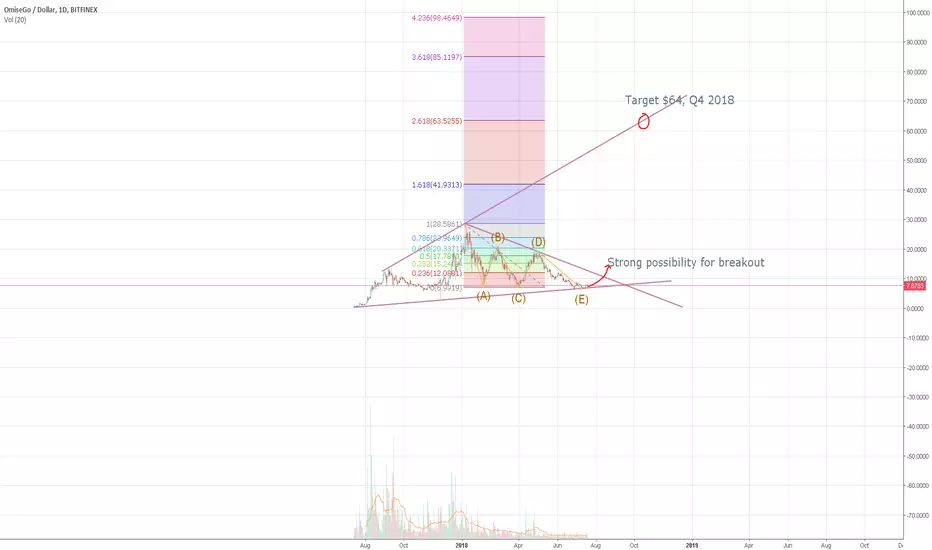
OMG MASSIVE GAIN 1000% 2018 Q4OMG reached bottom and will follow btc up.
Would also like to add that I had a dream 11 months ago, saw coinmarketcap omisego at $64, and now its all lining up.
Ive had dreams about crypto earlier which turned into reality.
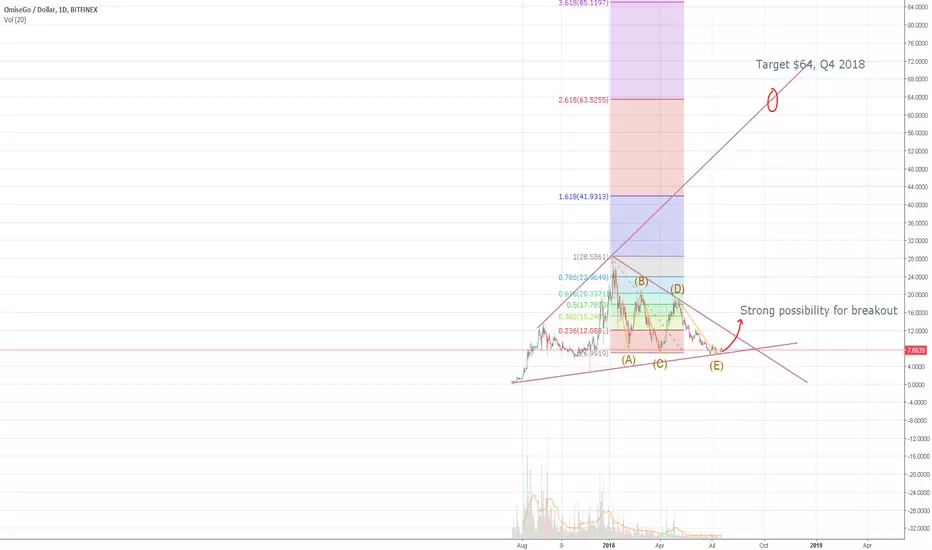
LONG OMG TARGET $64, 1000% gain 2018I would also like to add that I had a dream when I first bought in OMISEGO at $1.6.
In my dream I saw the number $64 on omisego coinmarketcap, I do not lie, have had dreams earlier about crypto that later on turned into reality.
OMG maybe a buyEverything is easy when things are bullish. Things go to shit when drop happens. But I think this will kick up. I think $10 or $11 but chart says $9. Eathier ways its a good gain.
BTC, I think it has 30% gains.
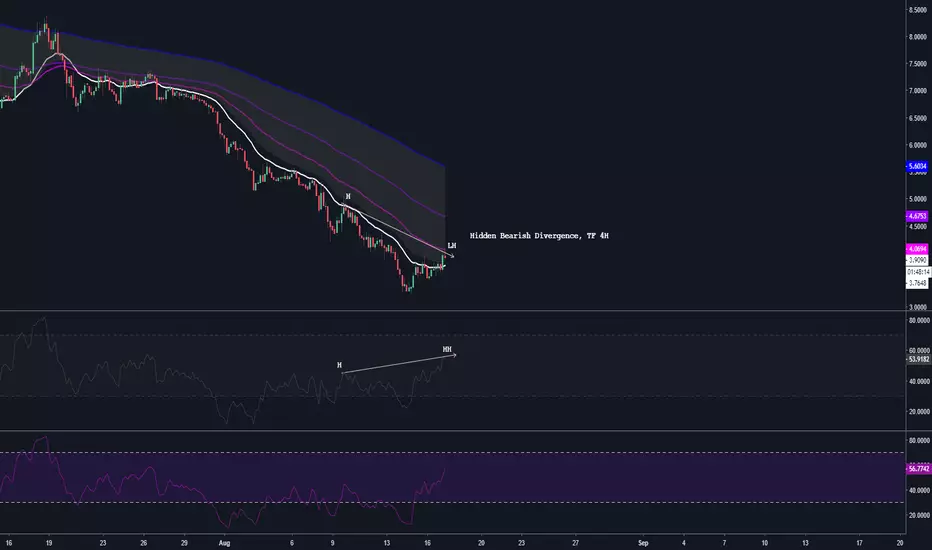
OmiseGo - OMG wen volume- Divergence on OBV Oscillator
- OBV high/low cross for big move
- Tapering volume
- Retested support
- One of the coins that didn't blow up like every other coin
