OMGUSD (OmiseGo) wave analysis update: 4hr tfMy previous post on OMGUSD (4hr tf) can be found here:
It was mentioned in the previous post that a price close below ~$12.50 favored a bearish scenario for OmiseGo (OMGUSD). Price swing downwards from ~$17.82 on April 26, 2018 is therefore identified in this analysis to be a triple zigzag Elliott wave structure (W-X-Y-X-Z) that is not yet complete as we are in the last leg of the structure i.e. Wave Z.
The horizontal red lines on the chart from the previous post mark the region that is still favored for the termination of wave Z, before any bullish momentum can be sustained by OmiseGo (OMGUSD).
The point of invalidation (POI) of this analysis is a price close above ~$16.05 at which point OmiseGo (OMGUSD) would have invalidated the proposed Elliott wave structure.
OMGUSD trade ideas
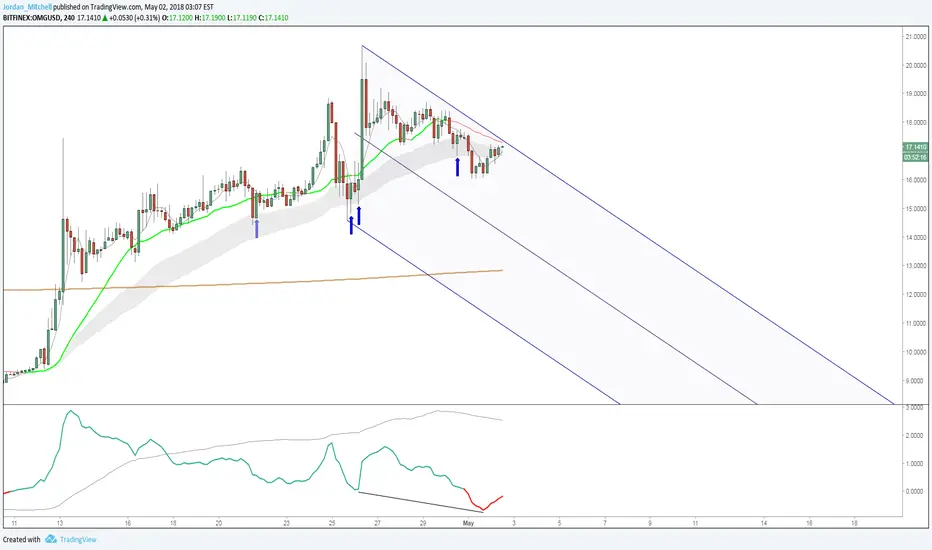
OMG - Do Ichi Clouds help?One thing I've been studying and practicing over the past few weeks is the use of Ichi clouds. And one thing I've picked up on is cloud twists. For those of you that don't know, a cloud twist is where the cloud gets really thin and turns from a green cloud to a red cloud or vice-versa. Not always, but on many occasions, especially at higher time frames, a cloud twist can signify a reversal from a drop to a rally, or rally to a drop.
Look at the OMG chart for instance. I've circled areas where the cloud gets thin or does do a complete flip, and you can definitely see significant price movements along most of those points.
I'm not introducing this tool to help me forecast when BTC might be reversing a trend ... and by the way the kumo on the BTC daily says something big may be coming around May 23 .... maybe an end to this bear trend?
As for OMG, the clouds would suggest on the hourly that we have heavy resistance above, so perhaps we shouldn't expect a rally any time soon. I do like OMG as a project, but perhaps will buy a little later when I see things improving with the indicators.
Remember only a fool relies on one potential outcome.
Do not make financial decisions with this information. For educational purposes only.

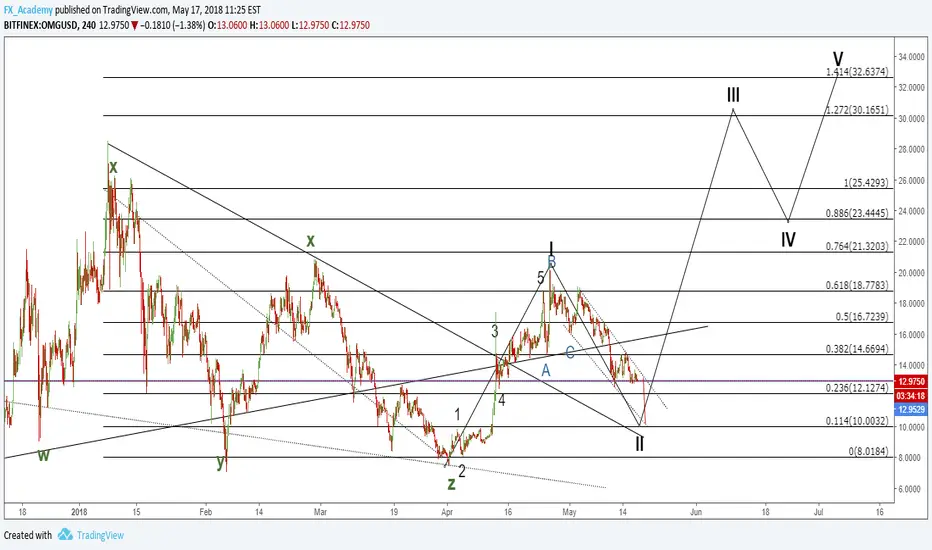
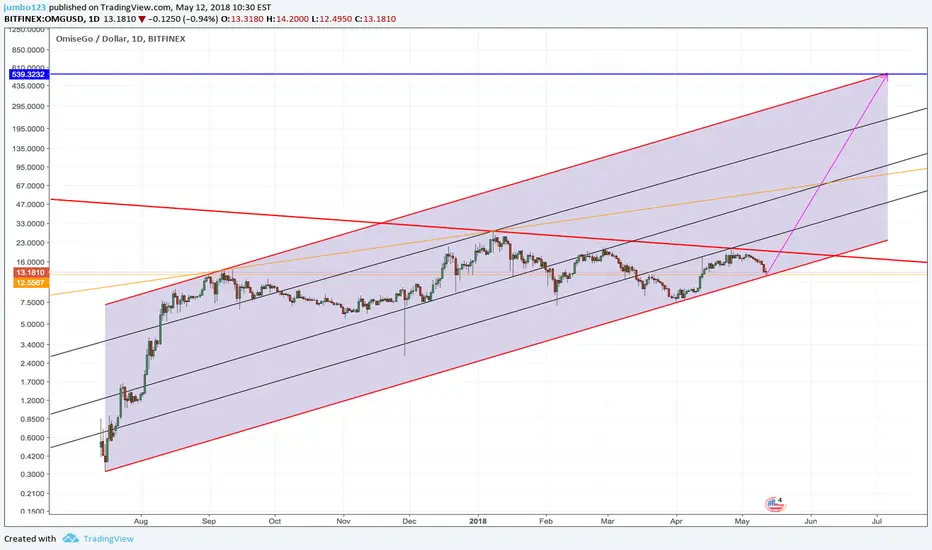
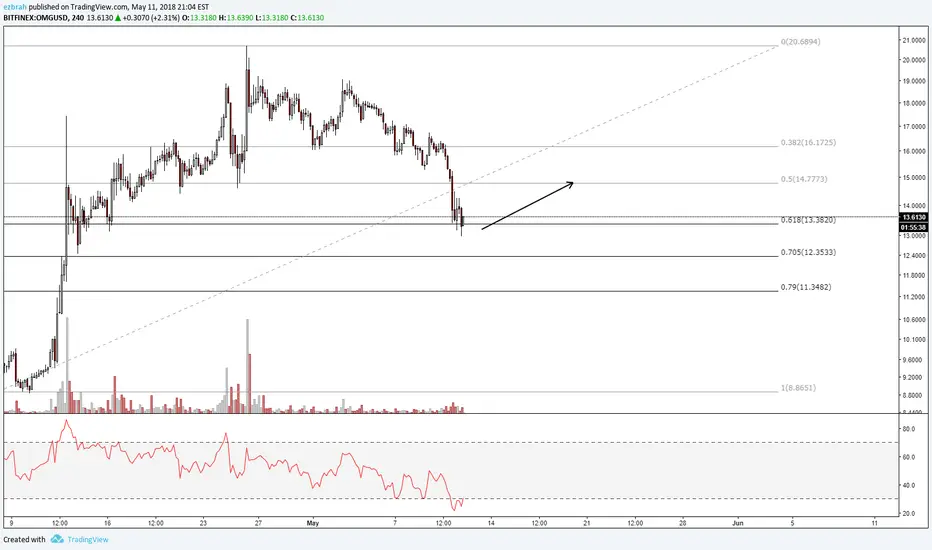
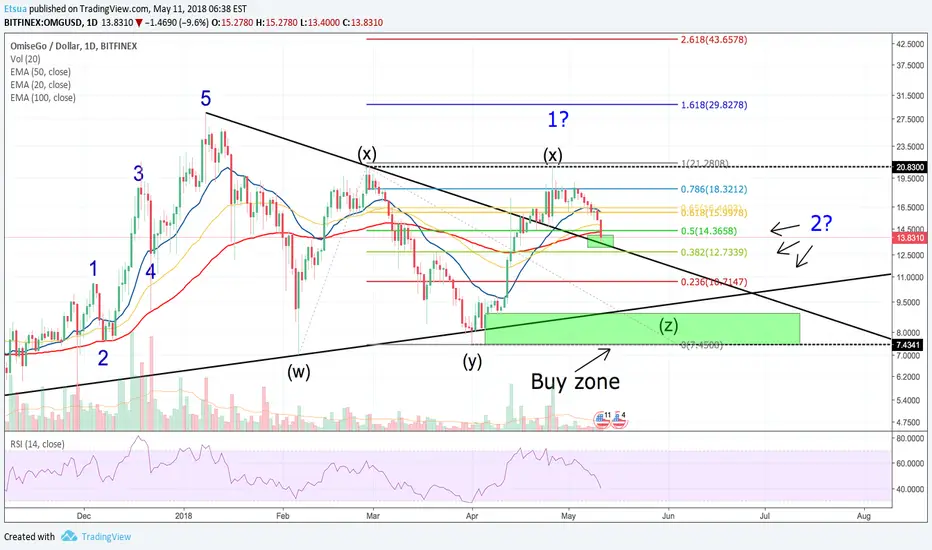
OmiseGo (OMGUSD) more downside expected After WXYXZ correction, OmiseGo's price went upward in a 12345 impulse wave and had an ABC correction. Since the price action formed a downward channel and is currently interacting with the support at 13$. If that support is being broken I am expecting the price to fall further to 0114 Fibonacci level or 10$. In the grand scheme of things, this will be the wave 2 of a larger cycle count. If this scenario plays out accordingly, after the expected downfall we are going to see new all-time highs as the target of wave 5 is at 32.6$.
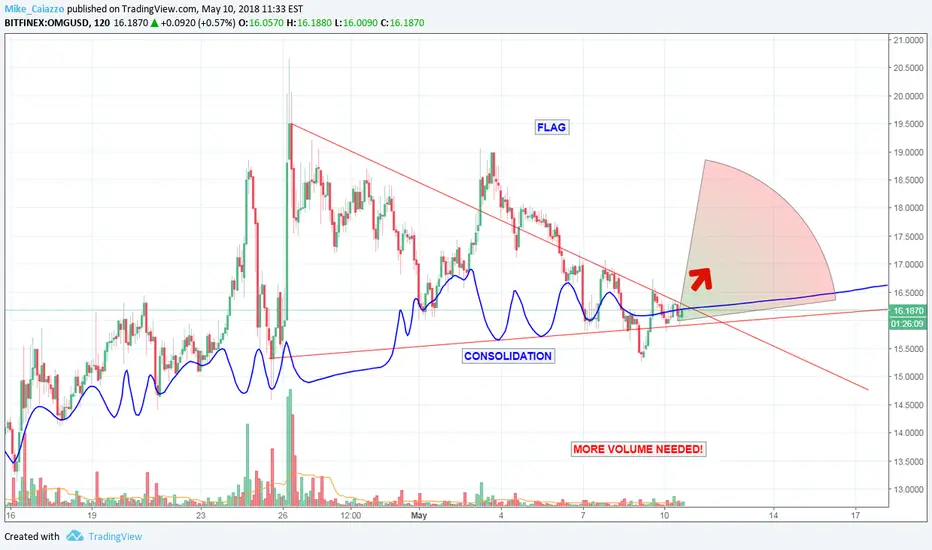
OMG/USD Triangle Consolidation Pattern Alts and BTC are displaying a very prolonged Triangle consolidation pattern which to me shows a serious spring board foundation is being built for all of these projects to catapult once they hit their apex or climax points. Yes, some of them will fail and fade away, but to me this shows me that this summer is going to be an explosive time in the crypto sector
You can pretty much look at many of the charts and see this pattern either nearing the end or still in the process. I have ladders placed already in my favorite projects so that I don't buy all at once. Each leg down, I nibble a bit until my bags are full.
As long as the stock market doesn't tank or we have some sort of Black Swan event, we should be in pretty good shape in the next couple of weeks
Hope everyone is well

OmiseGO (OMGUSD) wave analysis: 4hr tfMy previous post for OmiseGo (OMGUSD) can be found here:
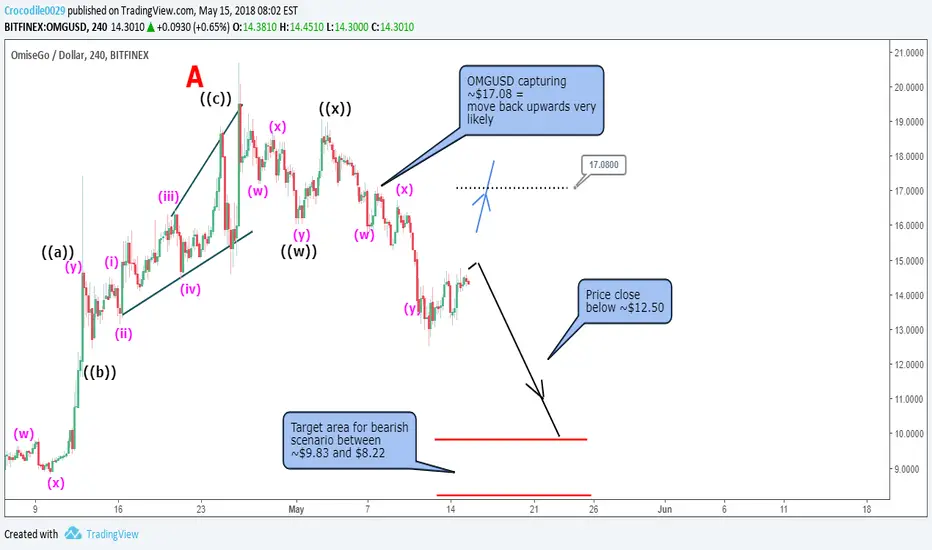
It was mentioned in the previous post that OmiseGo (OMGUSD) had a limited upside potential before bears pulled the plug on the bulls. Price swing from ~$12.76 on April 14, 2018 to a price close of ~$19.50 on April 26, 2018 is identified in this analysis as an ending diagonal (wedge) Elliott wave structure. The implication of this is a reversal in price to at least the origin of the wedge, which seems to be the case for OmiseGO (OMGUSD).
The best course of action based on this analysis is therefore to be patient to see how price action further unfolds for OmiseGo(OMGUSD). The reason for the previous statement is because there is a bullish or bearish scenario that could possibly play out for OmiseGo (OMGUSD).
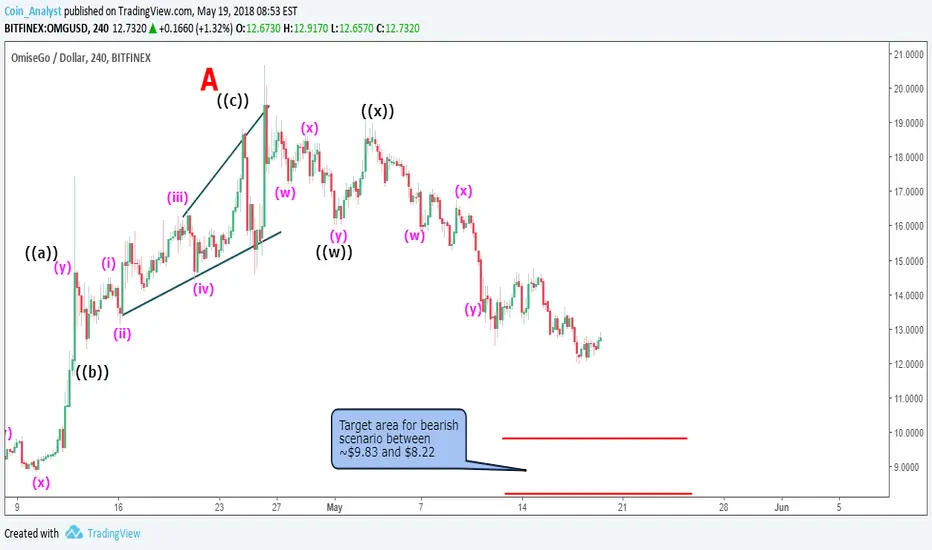
Bearish scenario: (Price closing below ~$12.50)
If this is the case, this analysis favors OmiseGo (OMGUSD) targeting support as indicated by the horizontal red lines.
Bullish scenario is only been considered here because the price move $19.50 to ~$13.84 on May 11, 2018 is a 3 wave price swing which implies potential movement in price back to the $19.30 area or even finishing past it as either a minute wave ((b)) of a regular flat or expanded flat respectively.
It is therefore best to be patient in this case to see how price action transpires inorder to take the appropriate action for OmiseGo (OMGUSD).
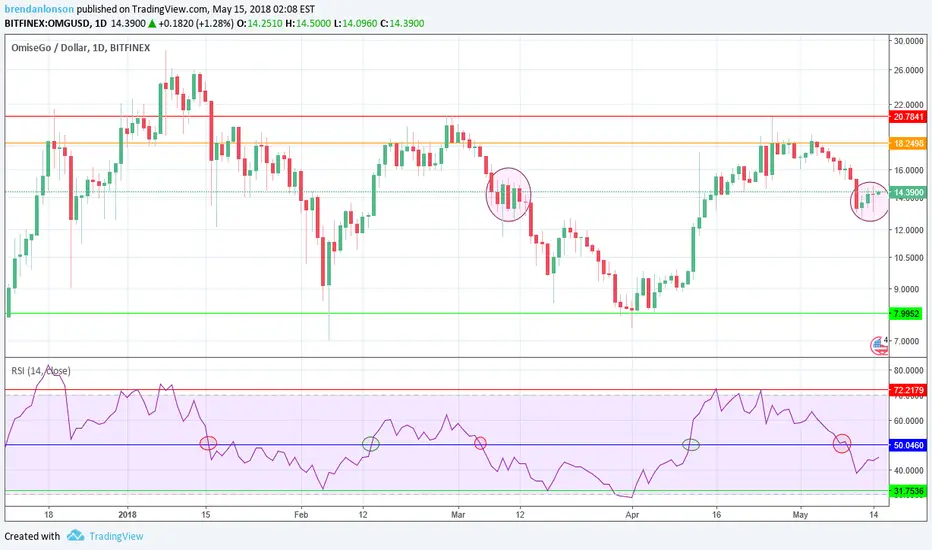
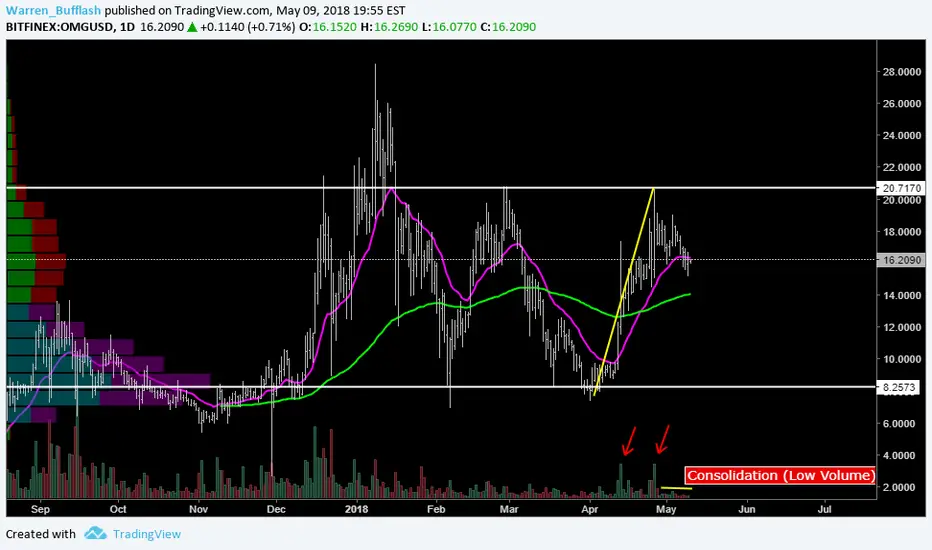
OmiseGoing down to $8History tends to repeat itself. Support at $8 x7. Resistance at $20.7 x4. Support at 31 RSI. Resistance at 72 RSI. Crossing above 50 RSI or bouncing up off 50 RSI = Bullish. Crossing below 50 RSI = Bearish. 31 RSI = I buy now. Patience is a virtue. I will wait to buy OMG at $8.
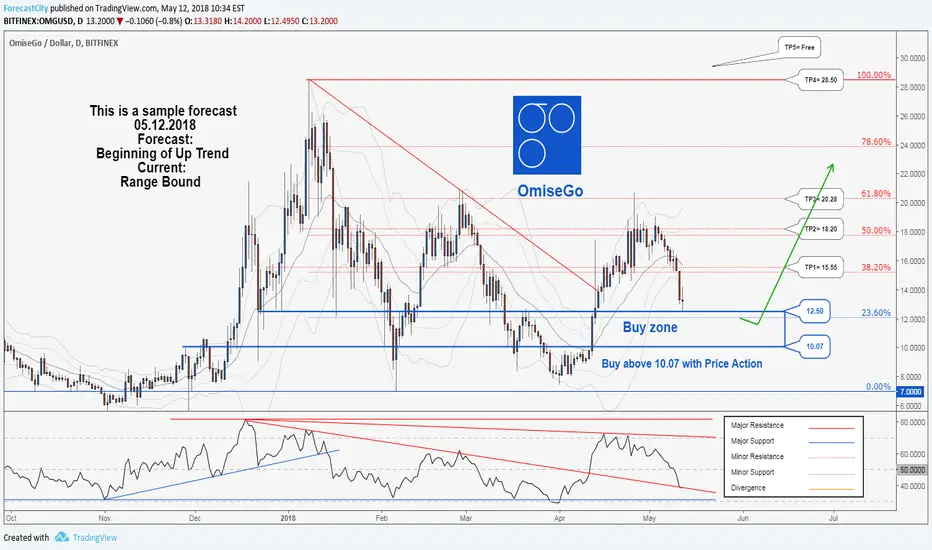
There is a possibility for the beginning of uptrend in OmiseGoTechnical analysis:
.OMISEGO/DOLLAR is in a Range Bound and Beginning of up trend is expected.
.The price is below the 21-Day WEMA which acts as a dynamic resistance.
.The RSI is at 38.
Trading suggestion:
There is a possibility of temporary retracement to suggested support zone (12.50 to 10.07). if so, traders can set orders based on Daily-Trading-Opportunities and expect to reach short-term targets.
.Beginning of entry zone (12.50)
.Ending of entry zone (10.07)
Entry signal:
Signal to enter the market occurs when the price comes to "Buy zone" then forms one of the reversal patterns, whether "Bullish Engulfing" , "Hammer" or "Valley" , in other words,
NO entry signal when the price comes to the zone BUT after any of reversal patterns is formed in the zone.
To learn more about "Entry signal" and special version of our "Price Action" strategy FOLLOW our lessons:
Take Profits:
TP1= @ 15.55
TP2= @ 18.20
TP3= @ 20.28
TP4= @ 28.50
TP5= Free

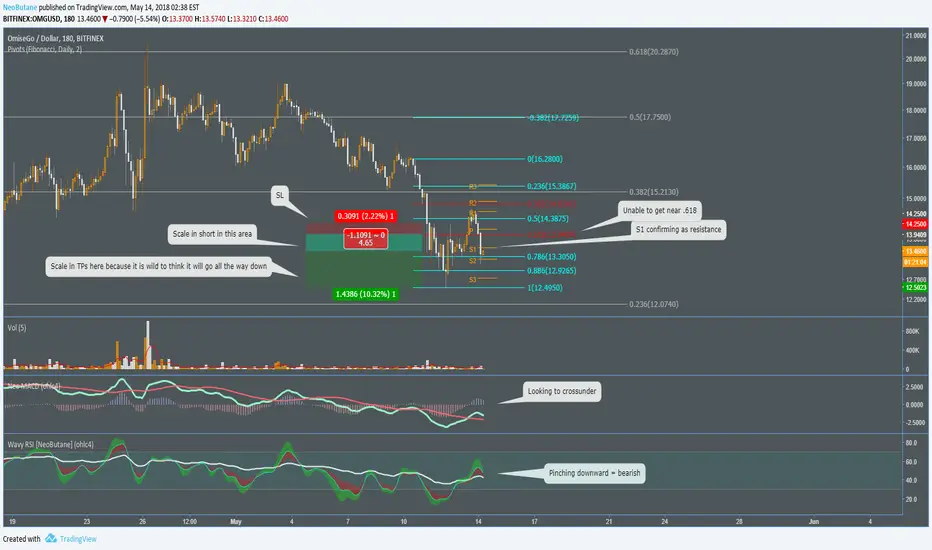
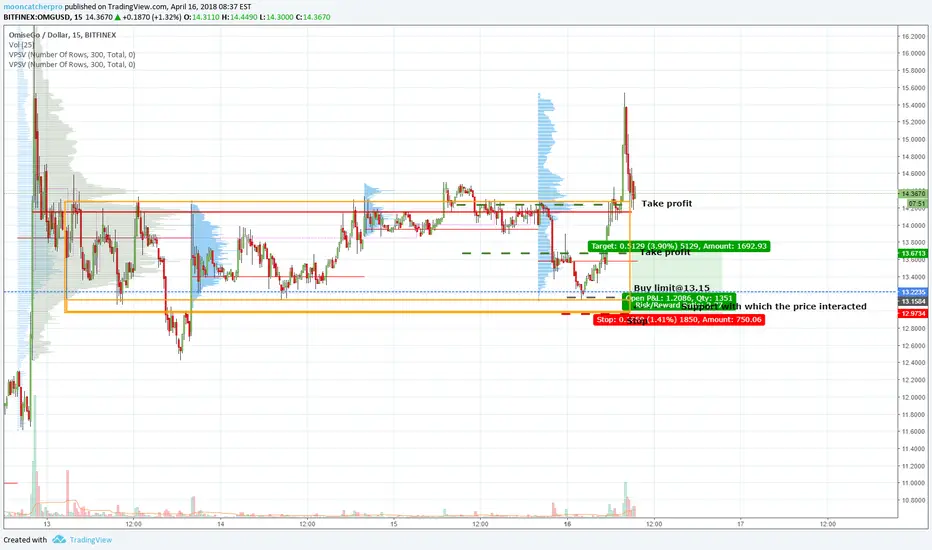
OMGUSD (Volume Analysis Prediction 4/16/2018)Ticker: OMGUSD
Exchange: BITFINEX
Signal: short-term @Long
The price in consolidation after the upward movement
Trading idea:
Most of the market duplicates bitcoin traffic
OMG moves completely independently
We buy from the support itself with which the price has already interacted,
with the closing of the position on the opposite boundary of the consolidation.
This is a short-term transaction, since the market (globally) is in consolidation,
and it is difficult to give long-term quality recommendations
Entry point: 13.15
Stop: 12.96
Target1: 13.66
Target2: 14.23
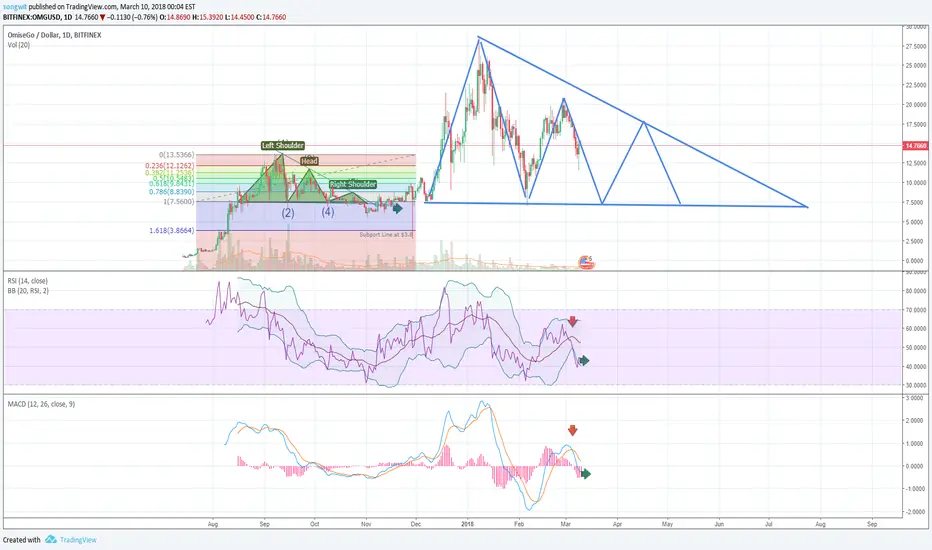
OMG! SEEKING A GOOD ENTRY POINT?So we can see we have found trendline support currently, but will it hold?
Here is something interesting, if I take a fib extension, and pull from W-X-Y, you can see that we've hit the 100% fib level, and found firm resistance at the 0.786! So we can see the Algos are at work.
Currently as far as I can see, we've double topped and are now retracing, and at this point in time, I'm seeing this as an extended correction, HOWEVER...we still have 2 possible BULL scenarios on the table!
BULL SCENARIO = We can still count this as a wave 1 up, and now we are coming down for our wave 2. This possibility is always on the table until we retrace past the origin of wave 1.
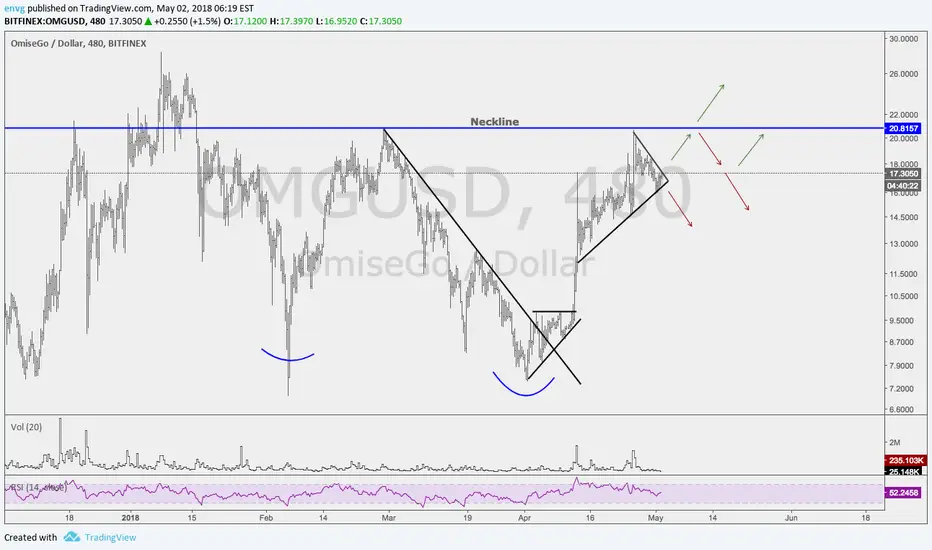
INVERSE HEAD AND SHOULDERS SCENARIO = If we break through the top black trendline, and continue our correction down, there is the possibility, that if we bounce of the bottom black trendline, we could be shaping up for a perfect inverse Head and Shoulders pattern. So ill be definitely watching for that potential.
However until then, it'll take me a lot of convincing before I go long. I'll be looking to enter, either when It reaches my buy zone, because I can't see it dropping past there, unless it continues following BTC down, but by then ill have more data to work with, then I can do a more detailed count.
I will also consider entering, if I see a solid bounce off the trendline we've found support at now for a quick scalp, but I don't see the market strong enough to push it up at this point. Also I have never found trendlines to be reliable/strong supports, unless correlated with a fib level.
So for now, I'm watching to see where it could land, and how it reacts when introduced to each fib level / trendlines, but as far it goes for now, we double topped and are retracing.
Thanks
**NOT FINANCIAL ADVICE, JUST SHARING WHAT I SEE**

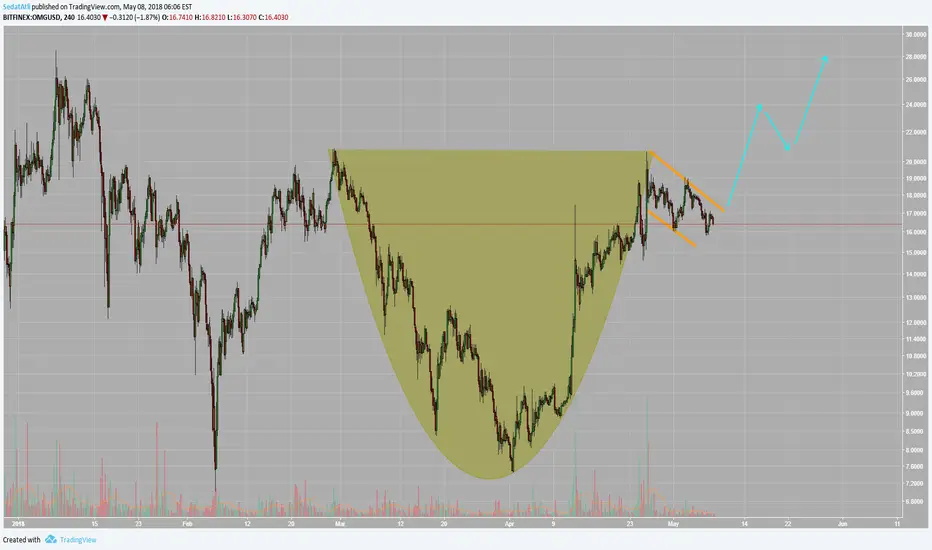
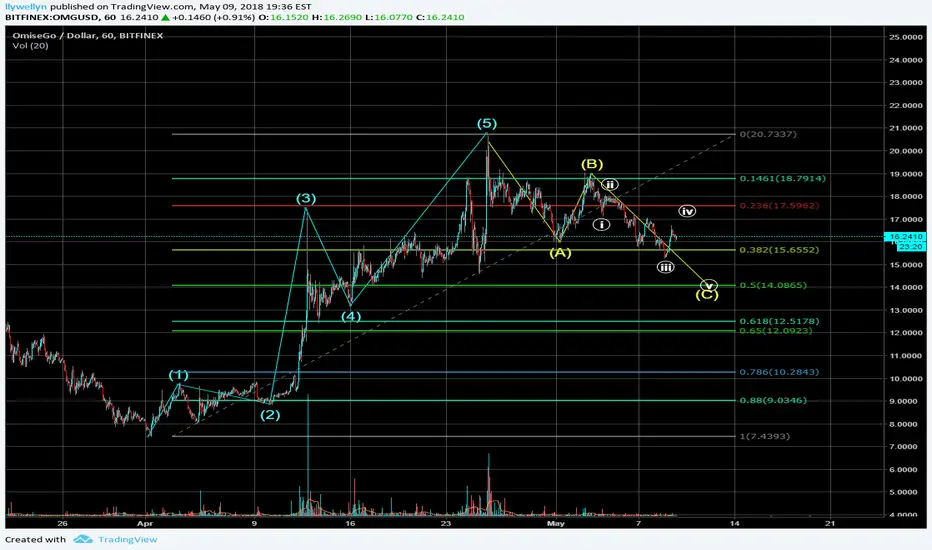
$OMG Nearing a Completed Correction? #omisegoHere's my current OMGUSD Elliott Wave count. It's possible OMG could wrap this thing up & get back at it shortly.
OmiseGo short termOmiseGo (OMGUSD) has been dropping following the rally from the last few weeks.
If price drops down to the support level around $13, we can expect a new rally up to the resistance around $20.
If price breaks below the support level, the next support level is below $10.
At the moment it's best to wait and see what price does once it hits $13.
Good Luck,
CryptoTrendline

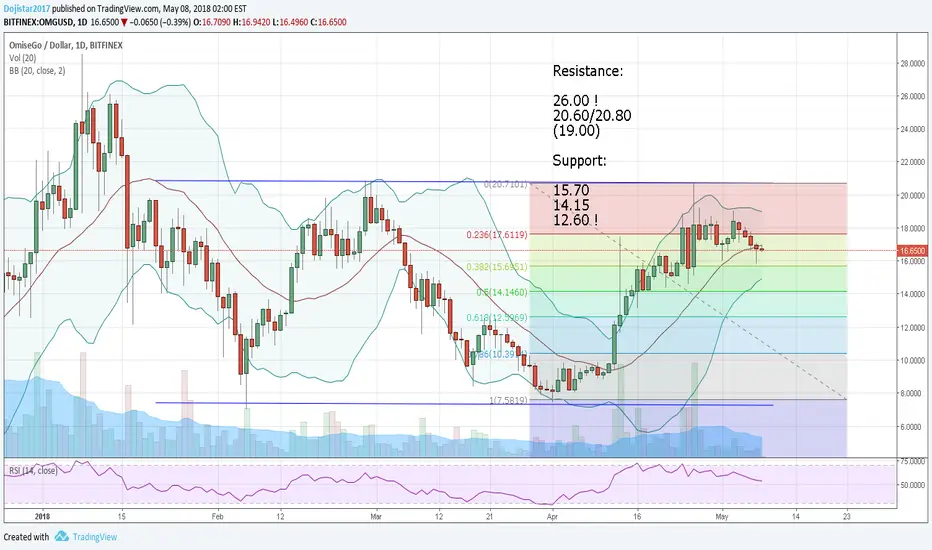
OMGUSD: At top end wider sideways channelThis coin swing sideways between roughly 7.00 and 20.80 this year and has tested the top end recently and is backing off a bit.
However, the shape of recent bearish candles and lower volume suggests this move south implies no more then some technical profit taking. When looking at Fibonacci's, ideally dips toward 14.15/12.60 should be picked up. 15.70 is first support however.
For now it seems likely that bulls will provide another attack to that 20.60/20.80 area after this mild move south. A move on better volume with a close over 20.80 suggests the channel will flip putting a target at around 33.00/34.00.
OMGUSD. Omise. Long. Divergence. Trigger
Hey. The trend is bullish. There is a divergence. The breakdown of the channel will be conservative trigger. From there it will be possible to buy it So g I have my own paid signal group, so if you want to join email me. Put likes and subscribe, so you will give me motivation and fight with my laziness. All the best