OMGUSD - breakout with Adam and Eve patter soonSafe entry would be waiting for the breakout and buy at the re-test.
OMGUSD trade ideas

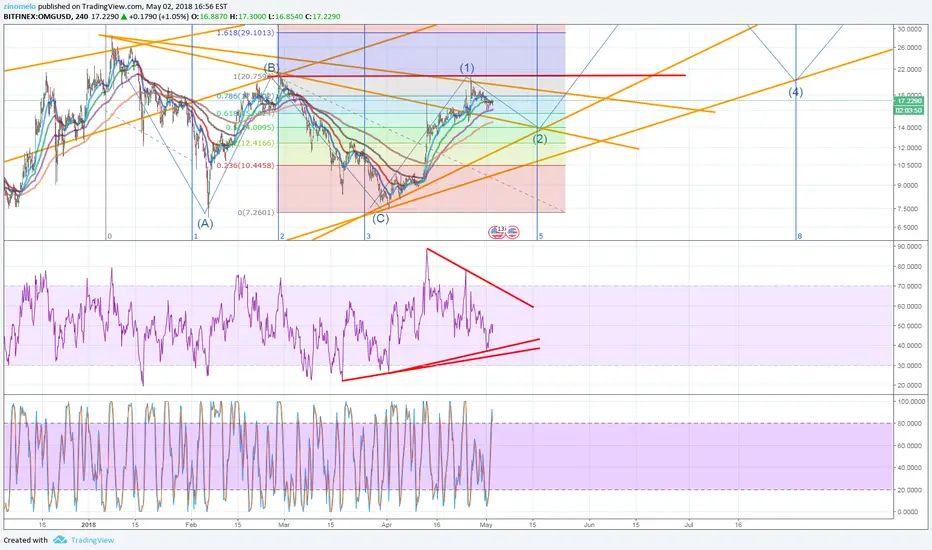
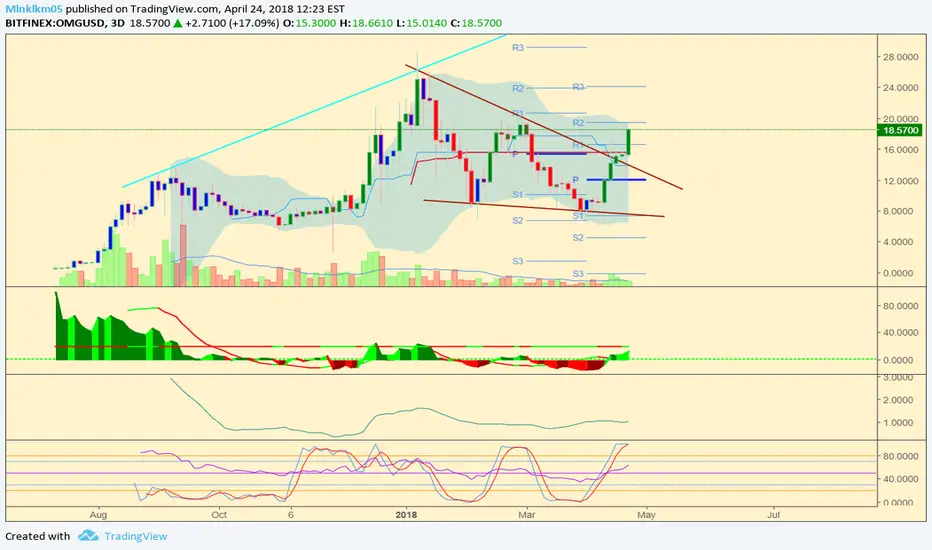
OMG is not looking very bullish. $14 in the next 2 weeks?it will likely be retraced to 0.5 fib level ($14) by may 15th... many support line i have drawn also support my idea.
wave 5 might not go very far as we approach the bearish 3rd quarter.
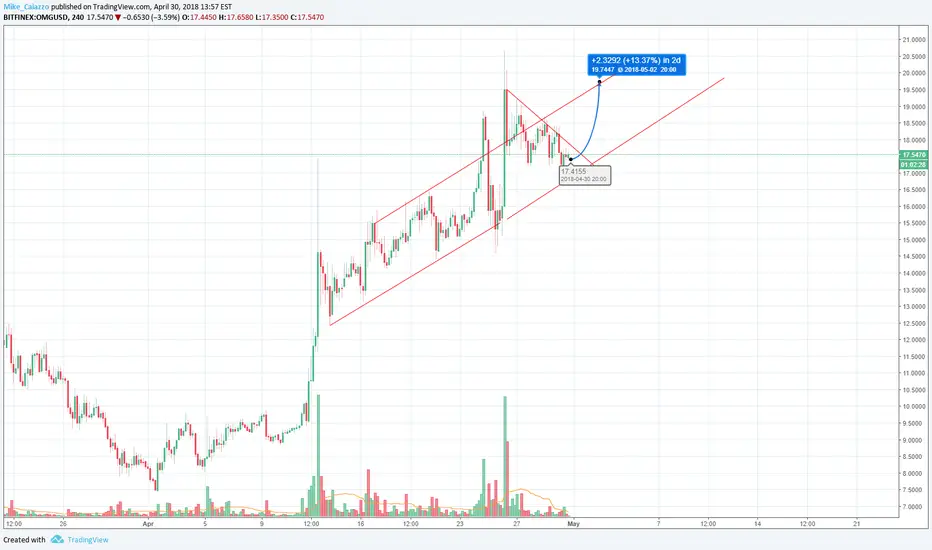
OMGUSD break imminent One of the only charts I have been watching today just because the range is so tight! A break of either of the blue lines will give us some clues in which way this is headed. Blue lines are taken from the high and low on the hourly TF and the yellow lines are from the 4H. Take some time and go look at the entire tightening range for yourself on the 4H. I am leaning bullish but am not entering a position until we see a break of the local top. Be prepared from some volatility because with a range this tight I'm sure we will see a big move play out. It is worth mentioning that if we break below $17.2 we will dump, short accordingly.

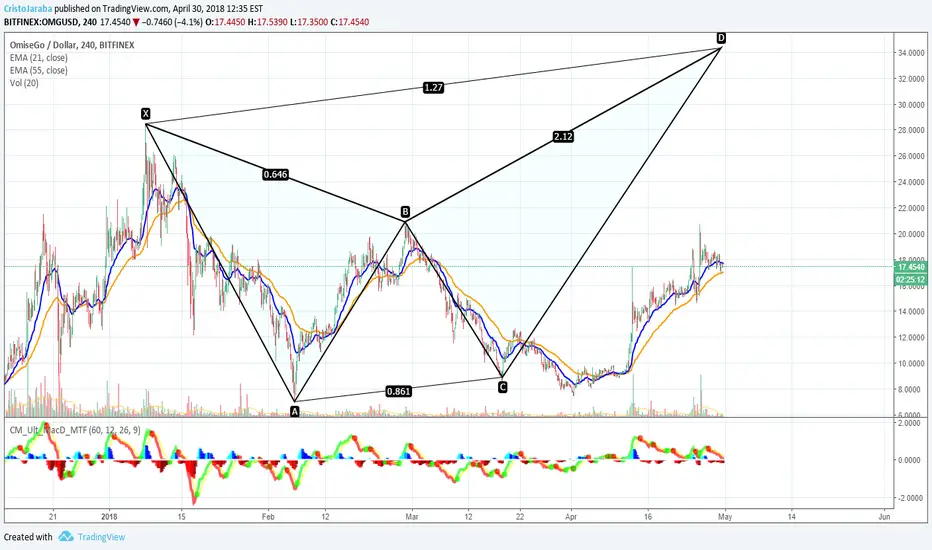
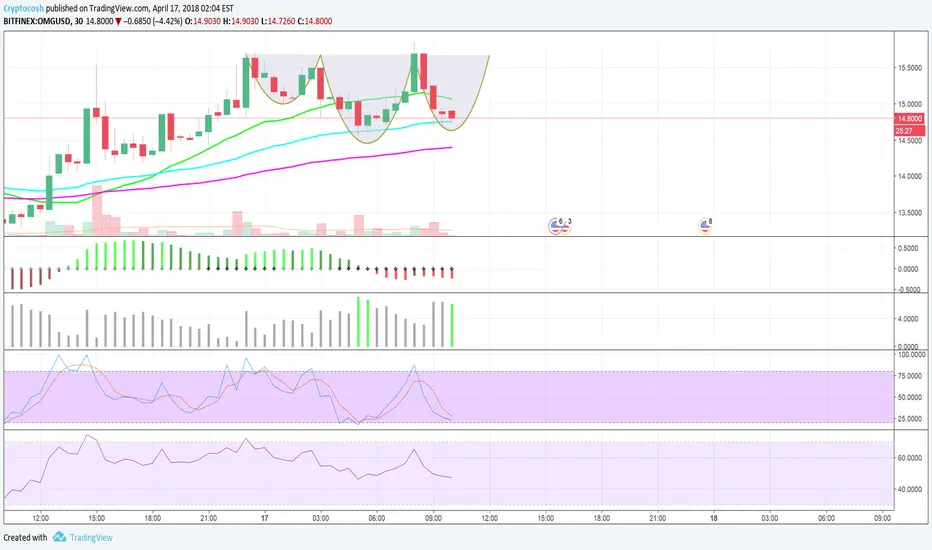
OMGUSD- Bearish gartley formation and cup-handle patternOMGUSD- Bearish gartley formation and cup-handle pattern

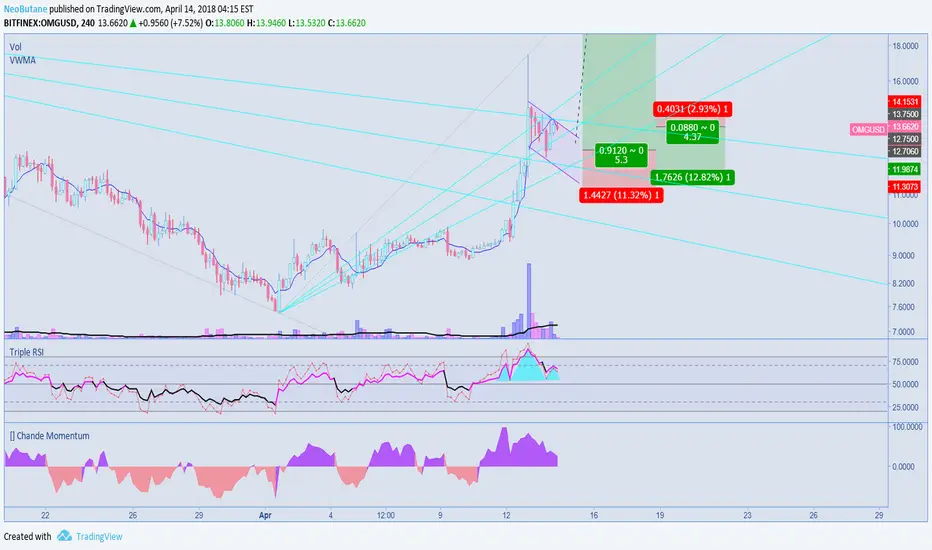
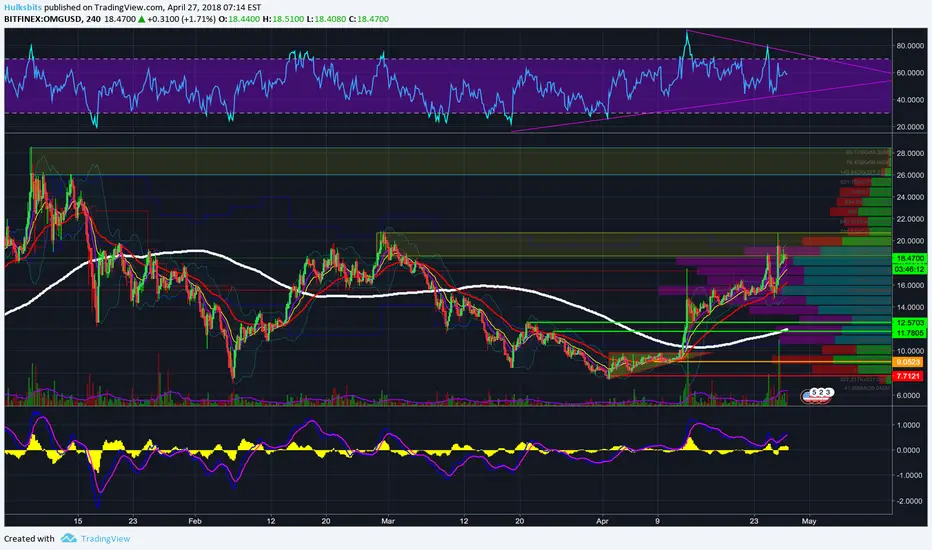
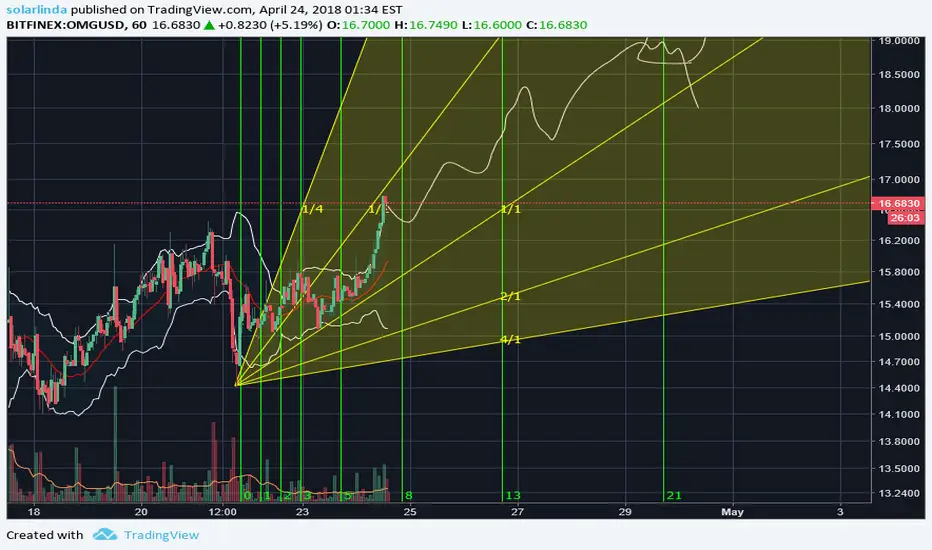
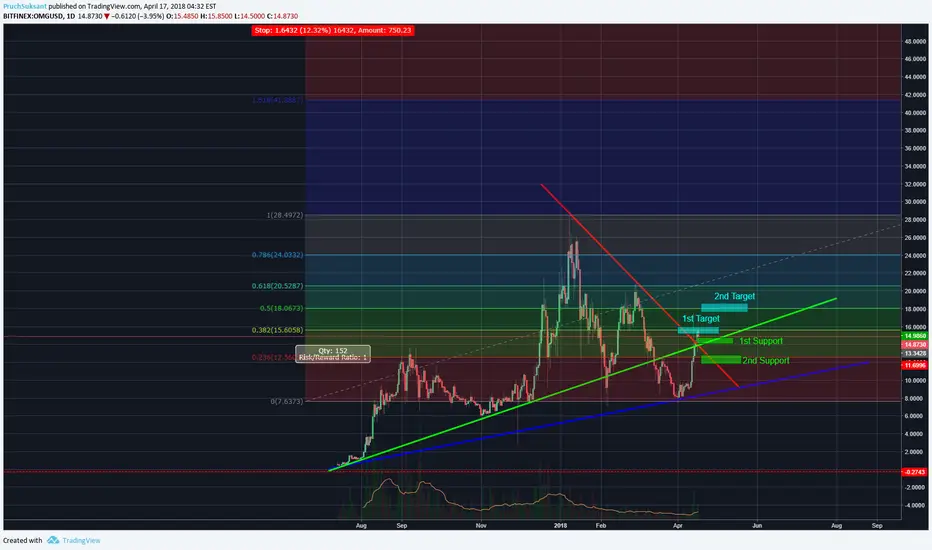
OMGUSD - Scale in orders for longTools used:
Fibonacci speed resistance fans
Chande Momentum
RSI
VWMA (Length: 8, length of 20 on hourly)
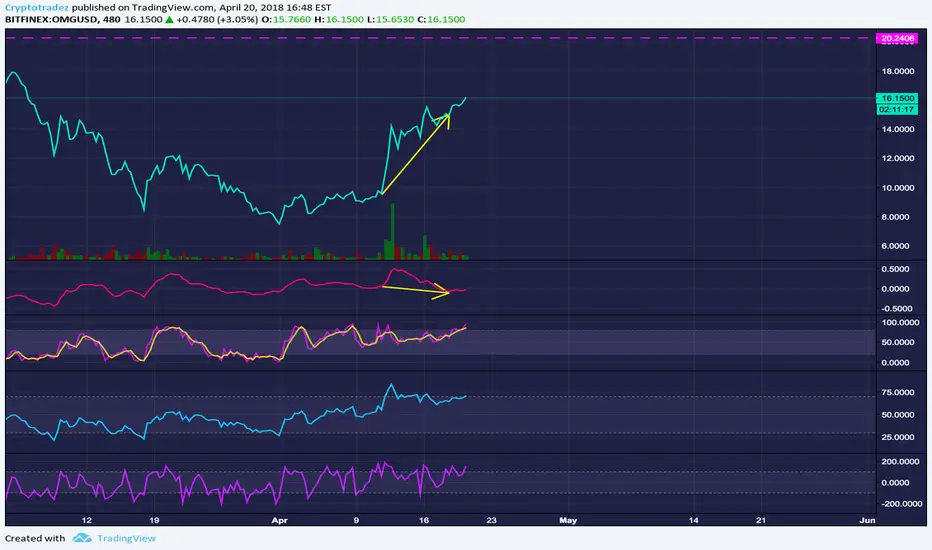
OmiseGO popped up to $17 and quickly dropped. Currently forming a bull flag, looking forward to a confirmation for a continuation of it.
Regression channels:
Arguments for a long position:
Taking the traditional method of finding target price of a bull flag, OMG should hit $20 after breakout
ATH is just around $40
Bull flag pattern
Strong FA, both team and community wise; verifiedtopics.com
Re entering main (green) regression channel after it failed to break out under it. (Poor correlation ratio at ~.5 however)
Arguments for a short position:
Currently in a correction phase after a huge rally
Top of bull flag channel, expecting it to drop again in the flag channel
Seems to have failed to break out from cyan regression channel
Weakening momentum
RSI making a hns pattern (lol)
Safest move would be to scale in long orders from $10 onwards as BTC is still grappling with its identity crisis.
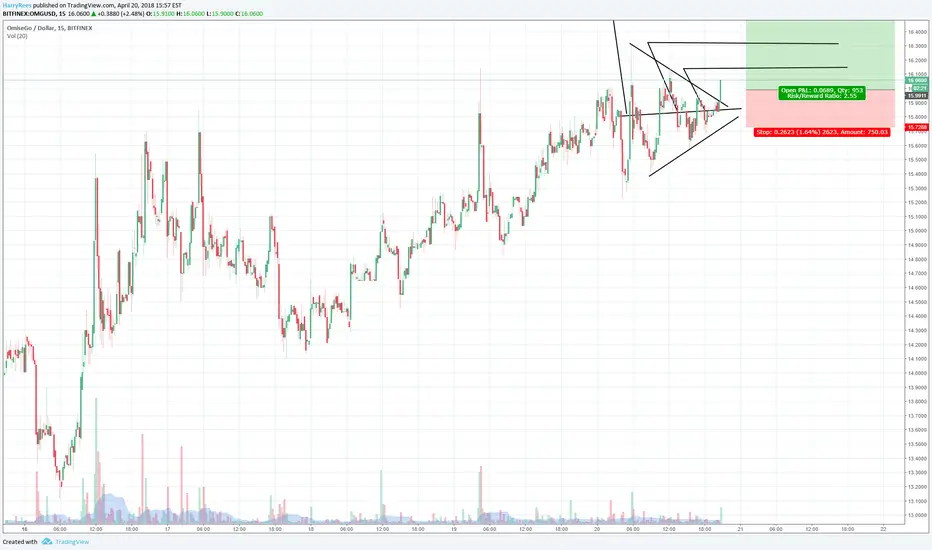
OMG facing critical resistanceOMG is at a critical resistance level. It is making steady but seemingly stronger moves higher, however, this could be cut short if the broader market turns to the downside. If OMG breaks through this resistance I think the next stop will be $25.00. If you're in OMG already I think it's a good place to be. If you are looking to get into OMG, unfortunately, I don't see a good set up right now. Entering here would be pure gambling. Although it looks very strong and has some of the best fundamentals behind it in the space, it could easily be dragged down with the market if it lets go.
You can see a previous trade of mine still on the chart: orange is my average buy price, red my stop-loss, green my take profit levels. I had less confidence in the market when I set those levels. I bought wisely (at the bottom of an ascending triangle); the pattern presented itself, I acted on it and, lucky for me, it was successful. I ended up having to buy back in at $14.00 however when a symetrical triangle pattern formed, signifying the likelihood of continuation to the upside. I'm leaving it there as a reminder to myself of how quick things can change in these markets.
As I'm in this coin already I'll update this as things change. Let me know your thoughts. Good luck trading people.
OmiseGO Upside potentialOmiseGO (OMGUSD) rallied this morning and reached the resistance level around $20.
If price starts dropping down we can expect the support around $13 to hold and the rally to resume.
If price continues to trade above the resistance level and it becomes support, we can expect it to reach new all time highs.
There is a possibility that the resistance level around $25 holds price, but ultimately it looks like it's heading to new all time highs.
Good Luck,
CryptoTrendline

omise go new targethopsss w or more than w
targeting 25 usd, we called when its 9 and 100% already
trade safe

Omisego time to tangoShort Term analysis of Omisego
I am looking at Omisego and ETP personally and i will trade only this 2 coins for the next few days
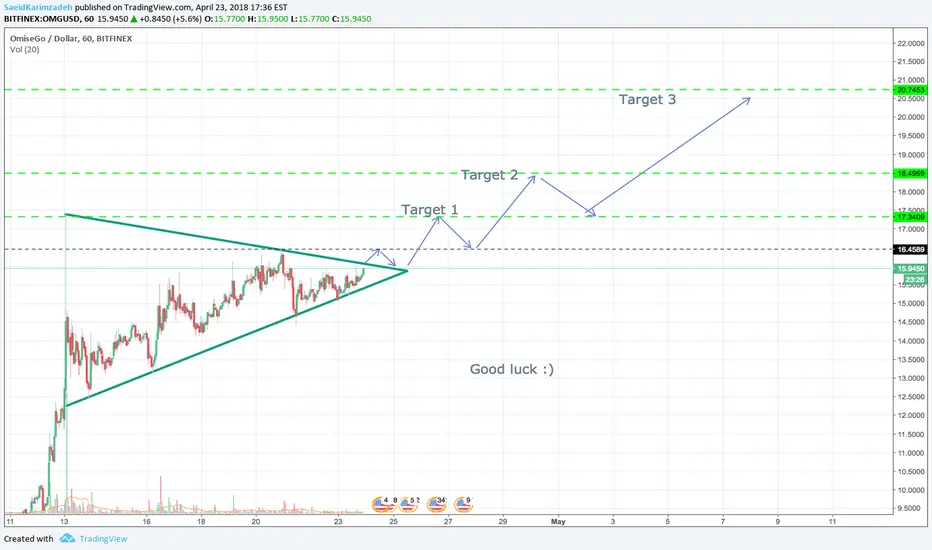
Not much to say here really.
It looks like its ready for a breakout.
Targets are shown on the graph
Good luck
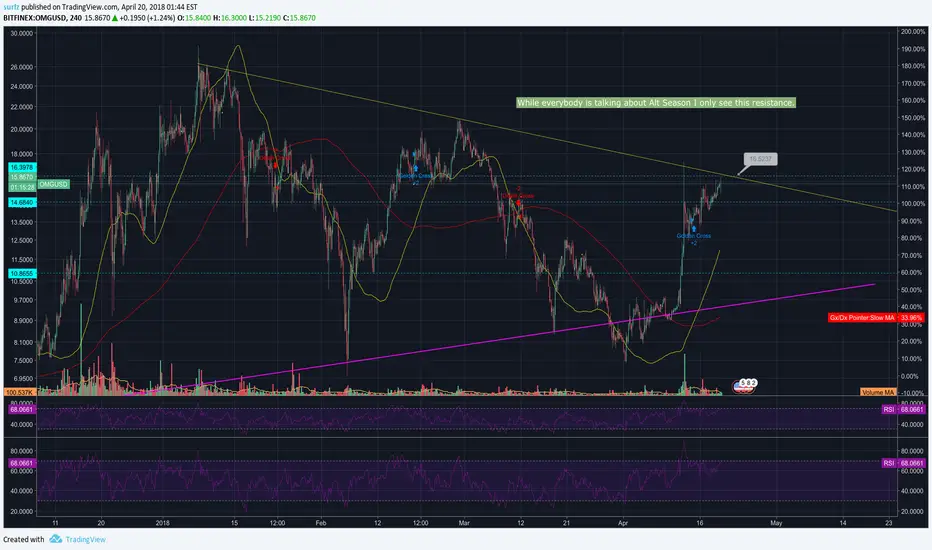
OMG - USD Will we break resistance?While everybody is talking about Alt Season I only see this resistance. Will we break it? Everything green for some days.. take your bet.
OMG Next target around $20 Expect the best for Omg !!!
You will take off for the moon !
Next target : around $20 (pink line)
OMGUSD - Upside Continuation - HVFOMGUSD - Upside Continuation - HVF
- Just broke out
- price didn't get that tight, probably a slow grind up rather than an explosion
*New Trader*
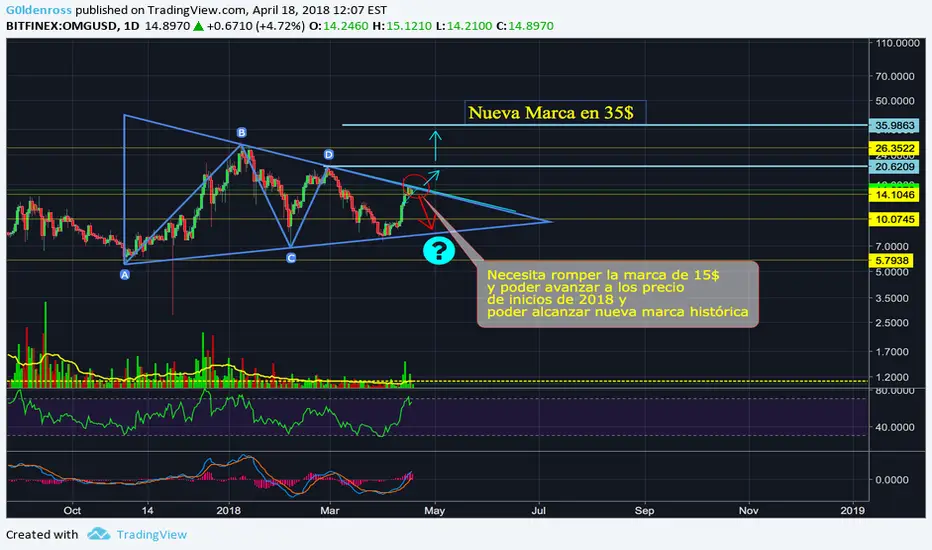
Bullish idea on OMGIt has behave so well these days, now it faces resistance above the 15$ area, where it needs to breakout descending line of the triangle to reach levels at 18$ again and continue the uptrend to new highs!. This range will get us all the way up to 35$. So for now that would be my target for mid term.
On the other hand, if it can´t cross above the triangle, it should retest the bottom at 8.5$-10$ and from that point I expect a strong Bounce. RSI shows almost overbought levels at 65, it seems a little difficult to have a big bullish rally starting from this point. As for now, we can say we have a consolidated market in OMG, now there's only one way to go, so we can continue the Uptrend for the year.
I'll keep this idea updated.
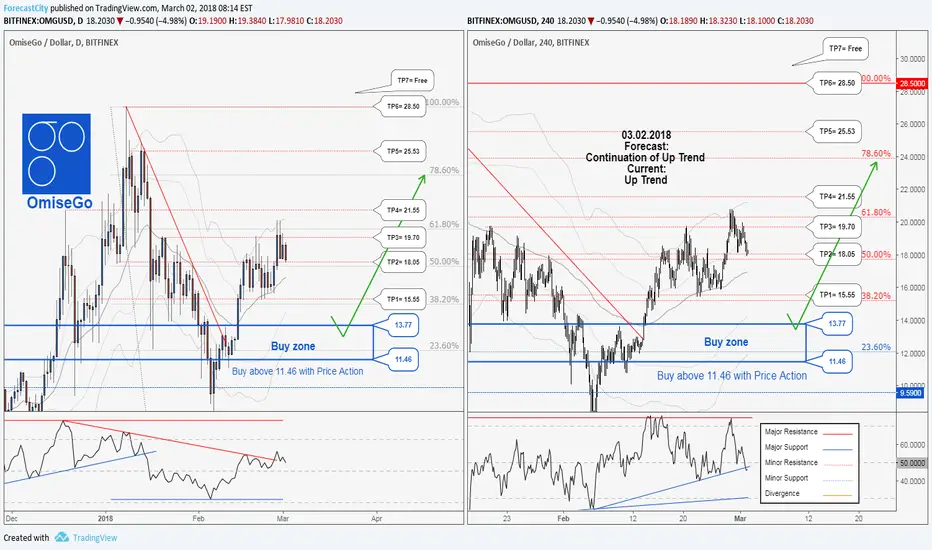
A long-term trading opportunity to buy in OMGUSD. Wait to hunt!Technical analysis:
OMISEGO/DOLLAR is in an up trend and continuation of up trend is expected.
The price is above the 21-Day WEMA which acts as a dynamic support.
The RSI is at 55.
Trading suggestion:
There is possibility of temporary retracement to suggested support zone (13.77 to 11.46), if so, traders can set orders based on Price Action and expect to reach short-term targets.
Beginning of entry zone (13.77)
Ending of entry zone (11.46)
Entry signal:
Signal to enter the market occurs when the price comes to "Buy zone" then forms one of the reversal patterns, whether "Hammer" or "Trough" , in other words,
NO entry signal when the price comes to the zone BUT after any of reversal patterns is formed in the zone.
To learn more about "Entry signal" and special version of our "Price Action" strategy FOLLOW our lessons:
(We have started to prepare these lessons in TradingView. If you want us to continue, give us feedbacks!)
Take Profits:
TP1= @ 15.55
TP2= @ 18.05
TP3= @ 19.70
TP4= @ 21.55
TP5= @ 25.53
TP6= @ 28.50
TP7= Free
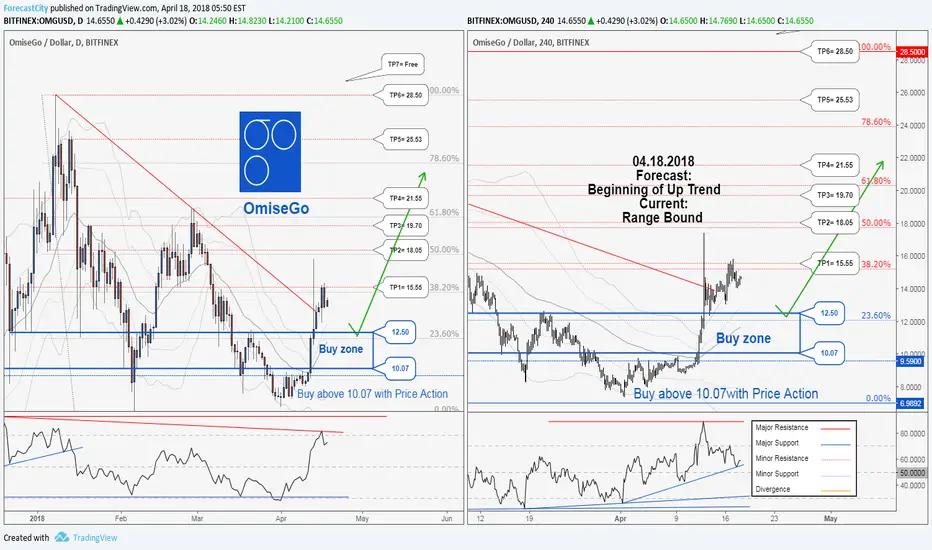
A long-term trading opportunity to buy in OMGUSD. Technical analysis:
OMISEGO/DOLLAR is in a Range bound and Beginning of up trend is expected.
The price is above the 21-Day WEMA which acts as a dynamic support.
The RSI is at 65.
Trading suggestion:
There is no trend in the market and the price is in a range bound, but we forecast an uptrend would begin.
There is possibility of temporary retracement to suggested support zone (12.50 to 10.07), if so, traders can set orders based on Price Action and expect to reach short-term targets.
Beginning of entry zone (12.50)
Ending of entry zone (10.07)
Entry signal:
Signal to enter the market occurs when the price comes to "Buy zone" then forms one of the reversal patterns, whether "Hammer" or "Trough" , in other words,
NO entry signal when the price comes to the zone BUT after any of reversal patterns is formed in the zone.
To learn more about "Entry signal" and special version of our "Price Action" strategy FOLLOW our lessons:
(We have started to prepare these lessons in TradingView. If you want us to continue, give us feedbacks!)
Take Profits:
TP1= @ 15.55
TP2= @ 18.05
TP3= @ 19.70
TP4= @ 21.55
TP5= @ 25.53
TP6= @ 28.50
TP7= Free
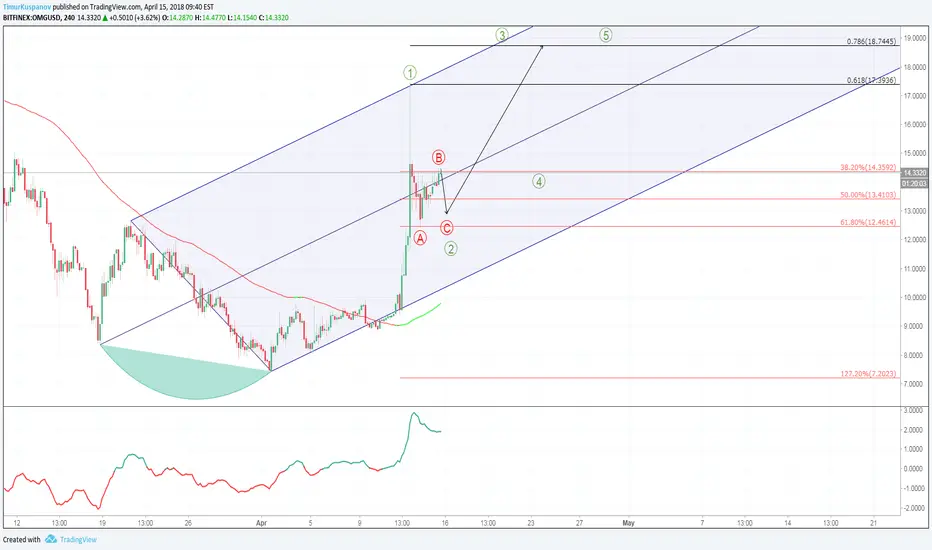
OMGUSD. Uptrend. Bull Trend
We continue the analysis of cryptocurrency tokens. At this time, we pair OMGUSD. The trend is bullish. Rising Pitchfork, as accurately they describe his movement. At the moment, making a flag to wave 2. The trend has just begun. The goals are described in the chart. Breakthrough Vil will have bad consequences, but now that the danger is minimal. I think the wave will not reach the low of wave A of correction. Therefore it is already possible to buy
OMGUSD@Bitfinex possible InvH&S
Following MagicPoopCannon i'm trying now to find different H&S or inverted H&S patterns in crypto.
This time let's look at OmiseGo to USD pair @Bitfinex.
Zoomed in to 30min chart i think there is a possibility, that another shoulder could form.
Not a trade advice. 4 education only.
OMG entered corrective wave 4OMG has left the triangle pattern to the top as mentioned in the last analysis.
It rose to fib retracem 38.2% (15,59$) as we have expected. This is / was the profit take - level.
This was also the turning point from wave 3 (motive) into wave 4 (corrective).
Now the price can fall till support at around fib retracement 23.6% (12,45$), perhaps even to swing trend line at 10.90$; this support shows more impact on the OMG-price than the fib retracement.
At that point we should have finished the wave 4 and should re-enter in motive wave 5, which could lead us to fib retracement 61.8% (20$).
Long investors can stay and hold, traders can take profit at this level and come back on lower levels.
If OmG stops the actual correction and breaks the resistance at 38,2% to the top or if OmG falls deeper than 9.5$ the EW-wave is false.
Indicators (RSI and ADX) are signalling a correction as well. We ´ll see.
Good luck!
