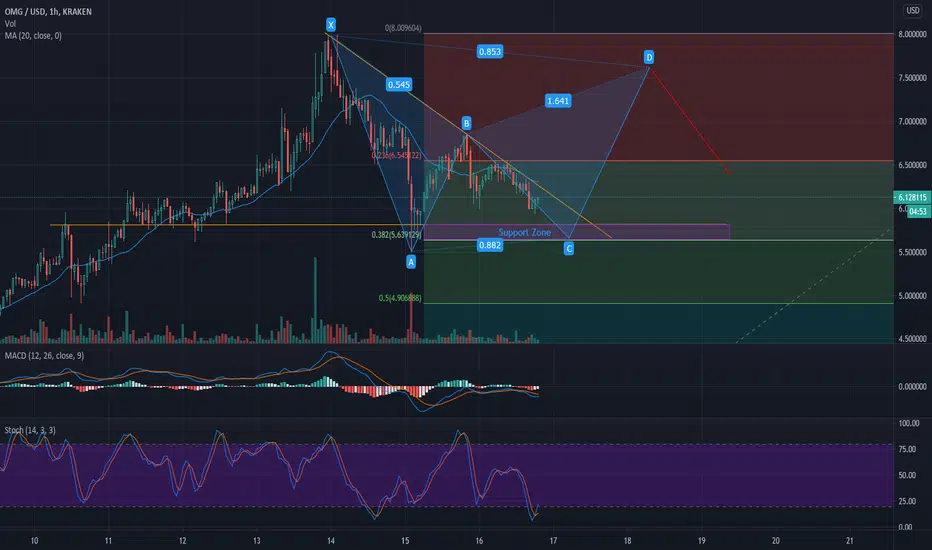
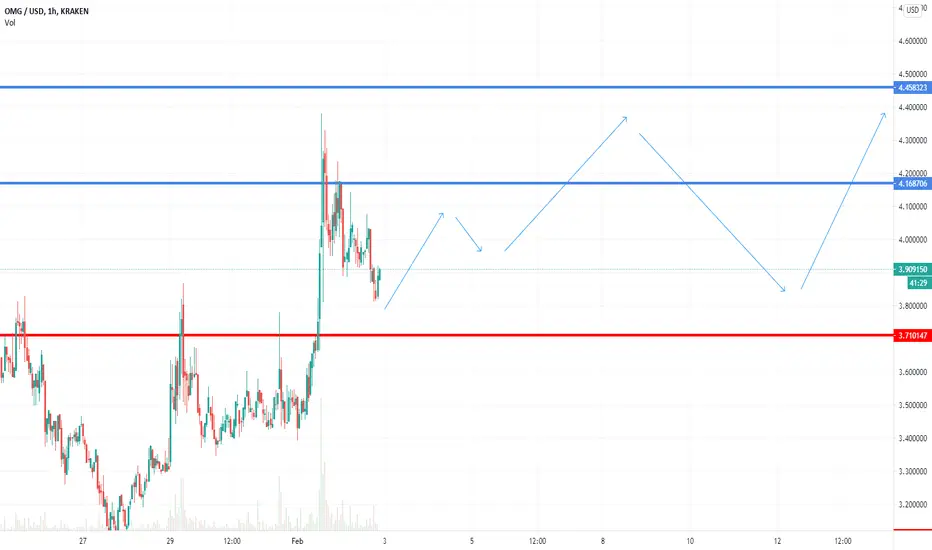
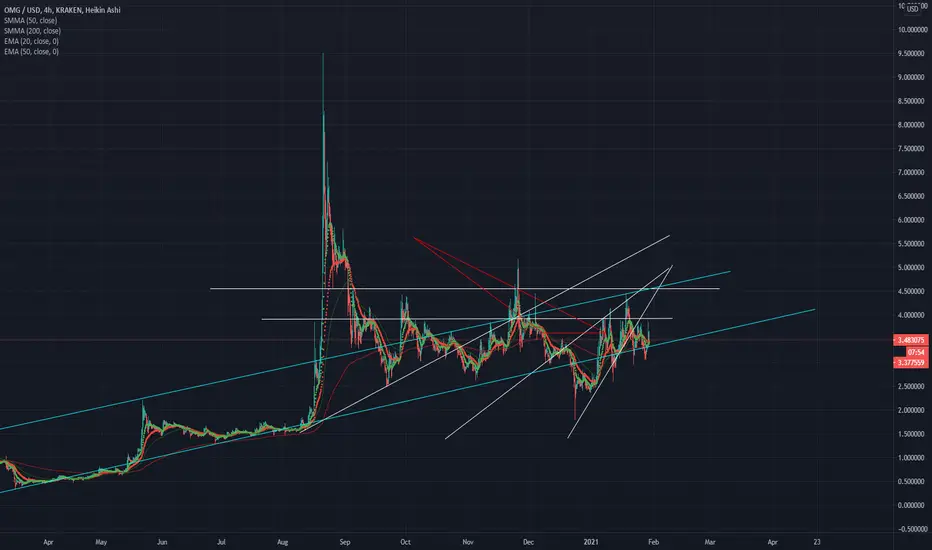
XABCD Pattern on OMGUSD? (Practicing my TA)Hi guys! Still learning Technical Analysis, any feedback or thoughts are much appreciated!
If it follows the XABCD, OMGUSD should bounce off the support around 5.8-5.6 and then break out of that wedge and rise toward 7.5-7-6 where we can look for selling opportunity.
OMGUSD trade ideas
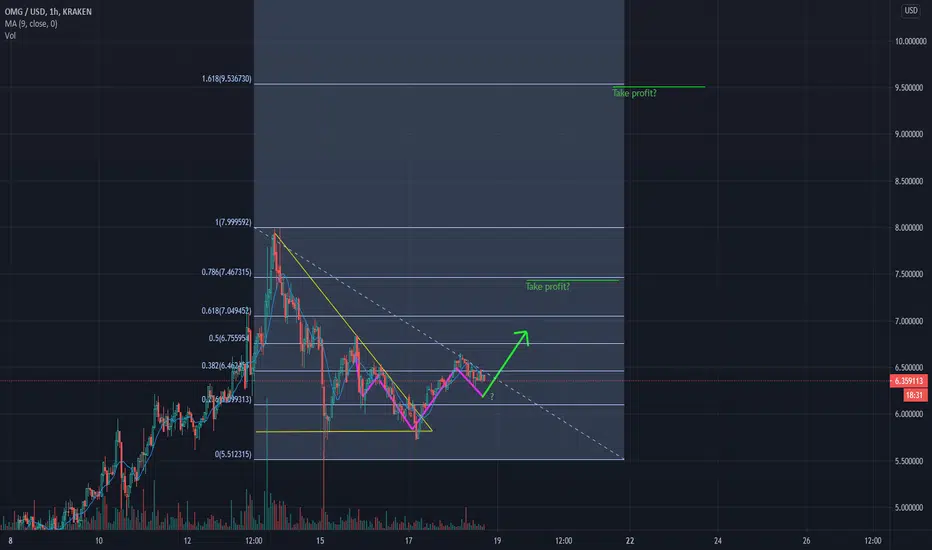
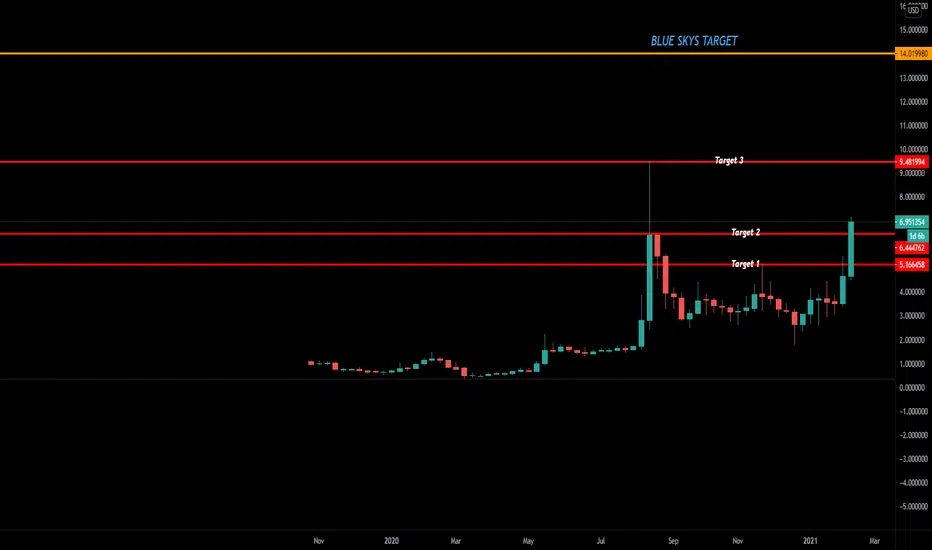
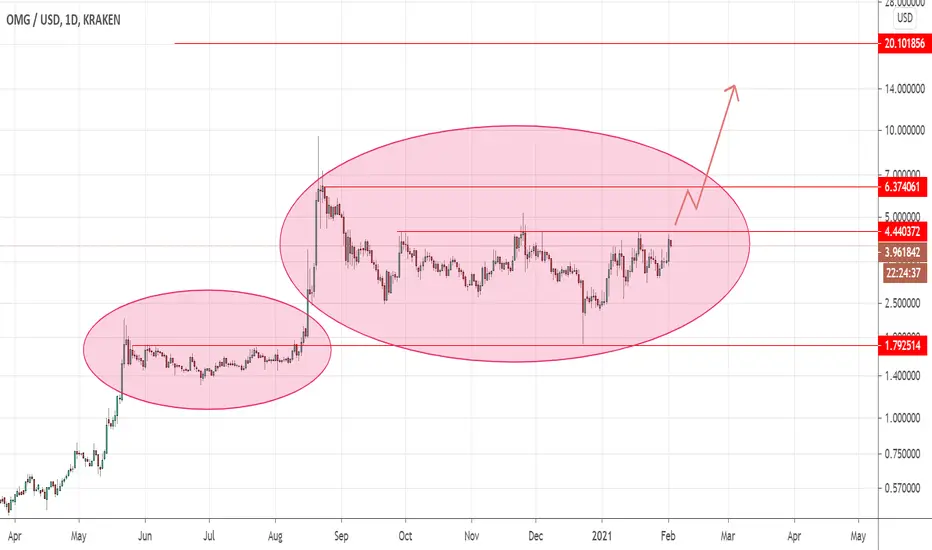
OMG - Upside down head and shoulders? Targets: 7.5, 9.5Waiting to confirm the formation of a reversed head and shoulders pattern which could be a signal of reversal of this correction from ATH we are seeing. I think it has already broken out of a descending triangle, another sign that the correction is reversing.
Still practicing identifying good price targets but I have profit levels tentatively set just under 7.5 and 9.5 for now (fib retracement).
Fairly new to TA in general - feedback is most welcome! What do you think?
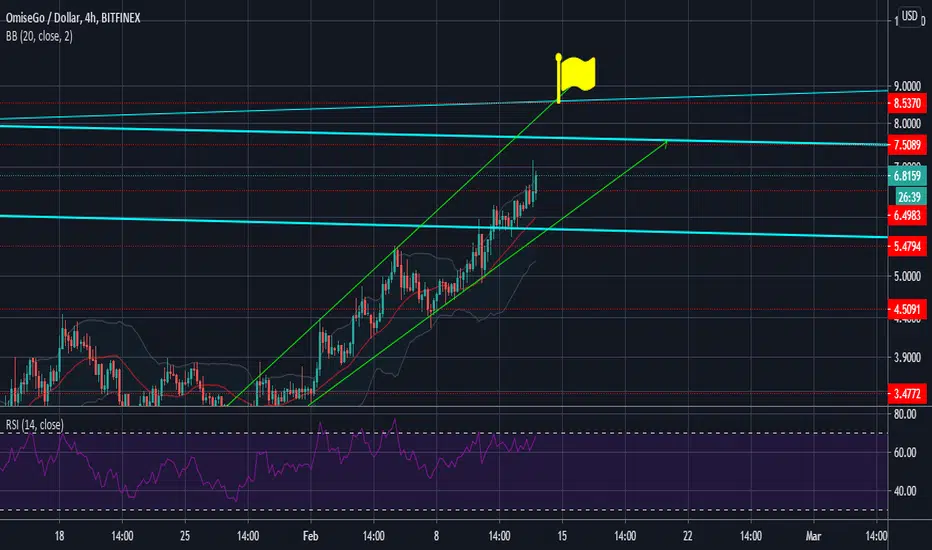
OMGI mean look at this cup and handle baby! very juicy. pushing through resistance. The price won't be tha fast but we should go to 9 dollars in the next couple of weeks
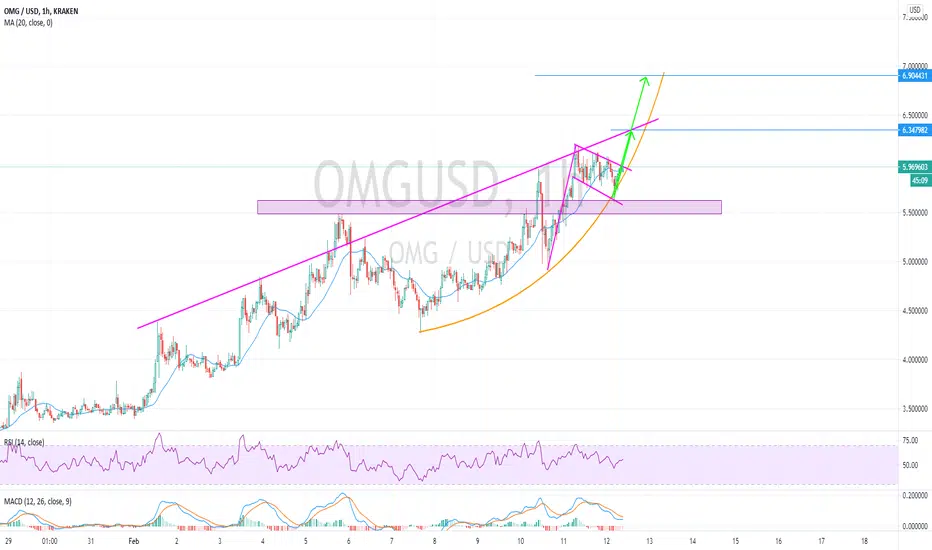
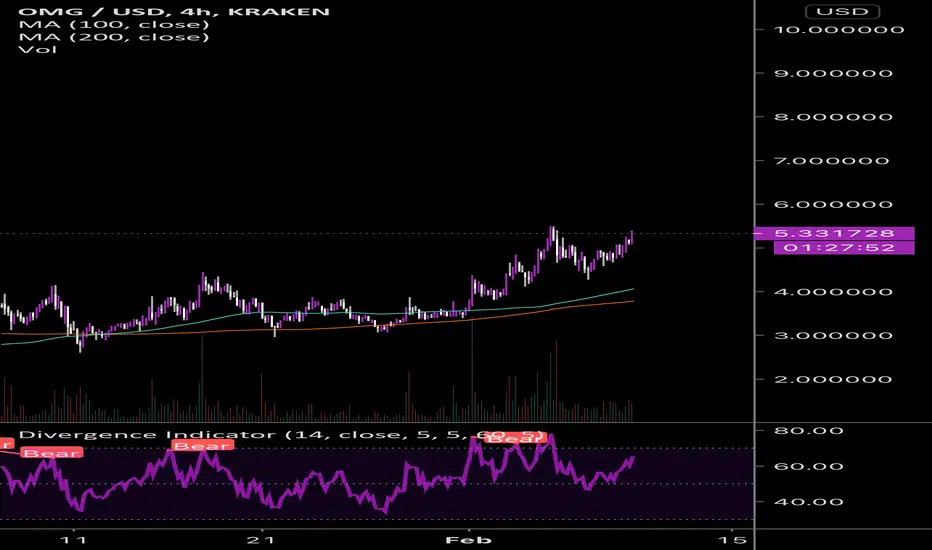
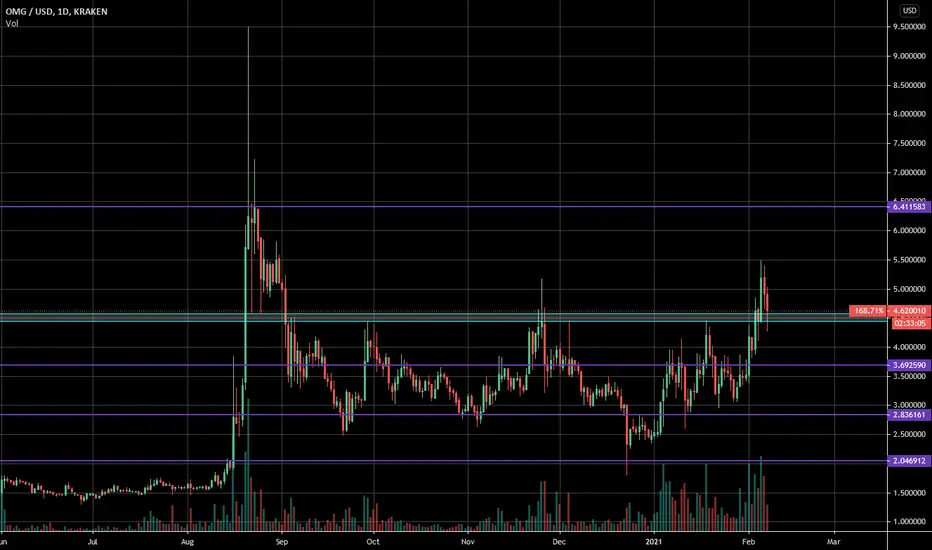
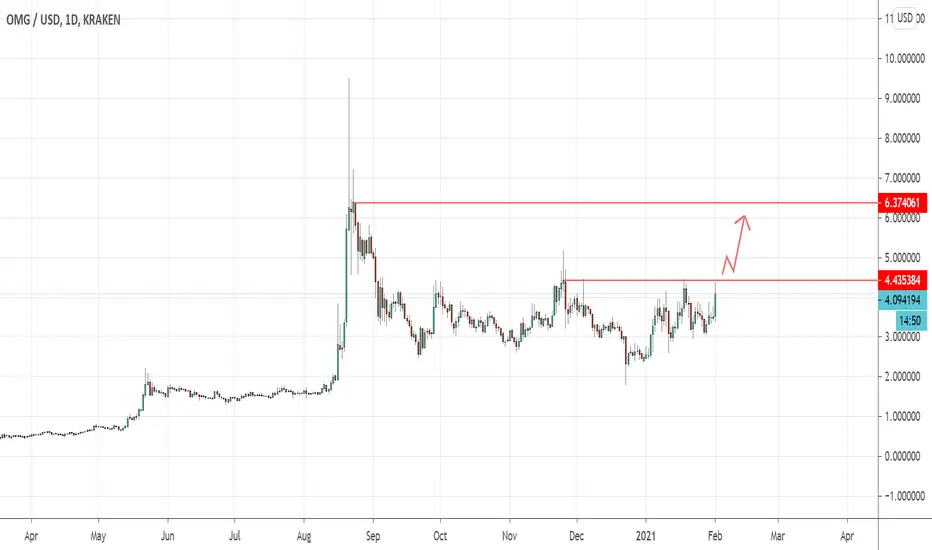
$OMGUSD - Bullish flag and resistancesHello everyone!
Bullish flag is spotted in OMGUSD, there is a strong resistance at $6.35 if that resistance is taken, look for a mid-term target at $6.90.
Wait for a breakout and go long.
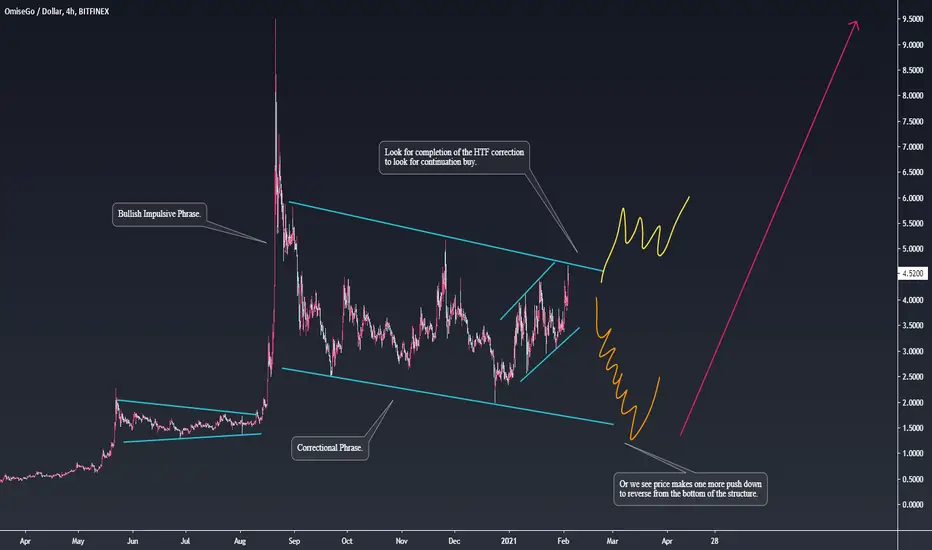
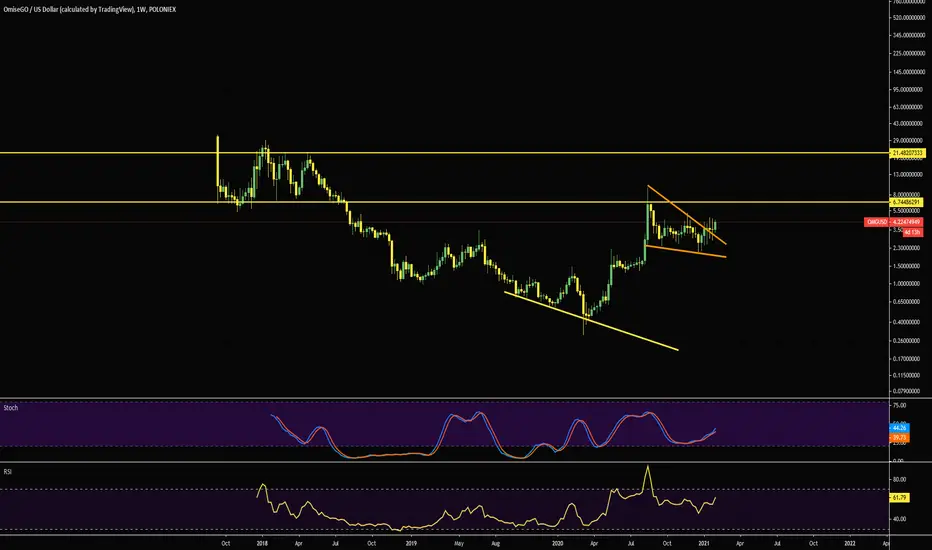
OMG 2 possible buy options
Hello traders:
Looking at OMGUSD for further bullish opportunities.
Price showed a clear bullish move to the upside, and then dropped down to form this HTF correction.
We can see the correctional structure is descending in nature, and could lead into a bigger higher time frame continuation correction.
I can expect 2 possibilities buys, either price breaks out from this descending channel and form LTF correction to go
or
price may correctively move down once more to the lows of the channel before a bullish reversal from the bottom.
thank you
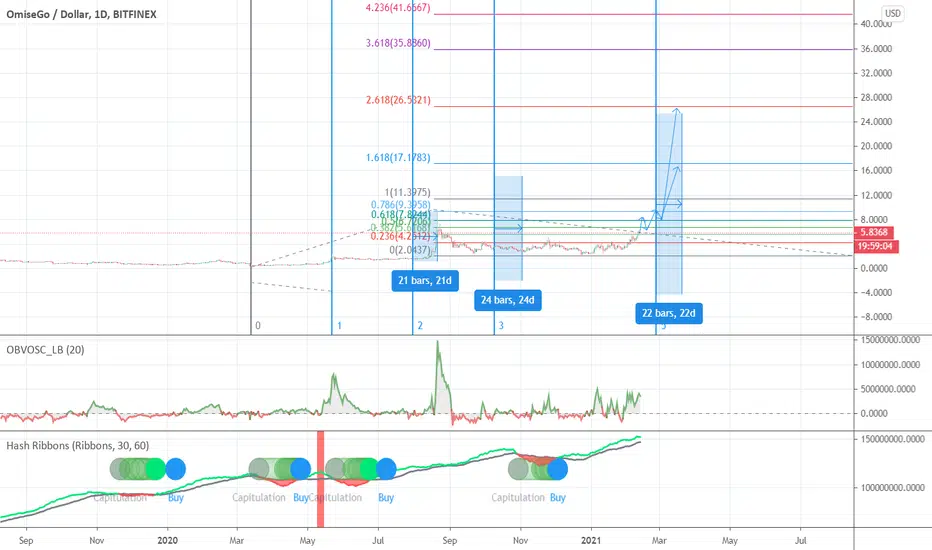
$17 or $27 Oh My God Coin by Mid March- Ultimate Fib Confluence Look at the Time based Fib Extension on this bad boy from the 2020 bottom to the peak in the summer time. Combine that with a regular Fib Time Zone and we see a bottom or top is made after around 20 something days from once we reach the zone. Something nutty is about to be brewing.
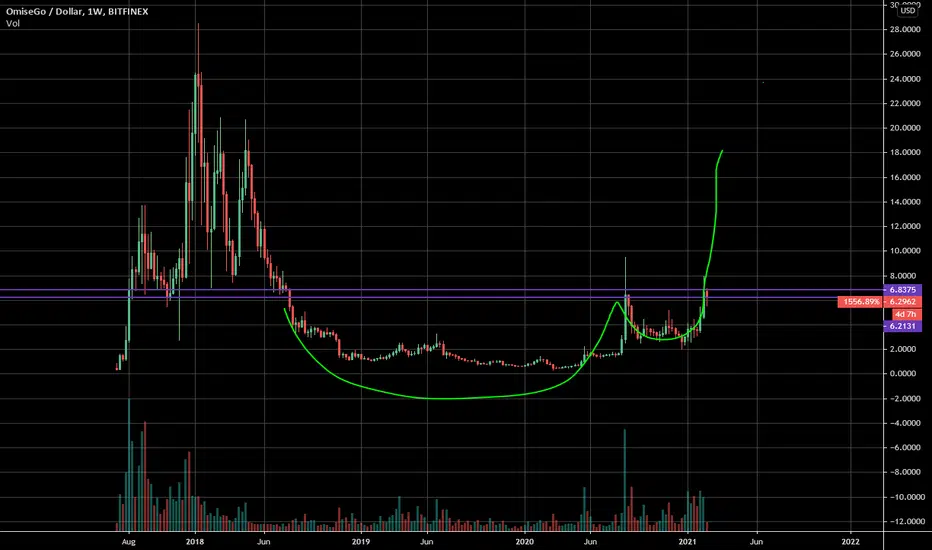
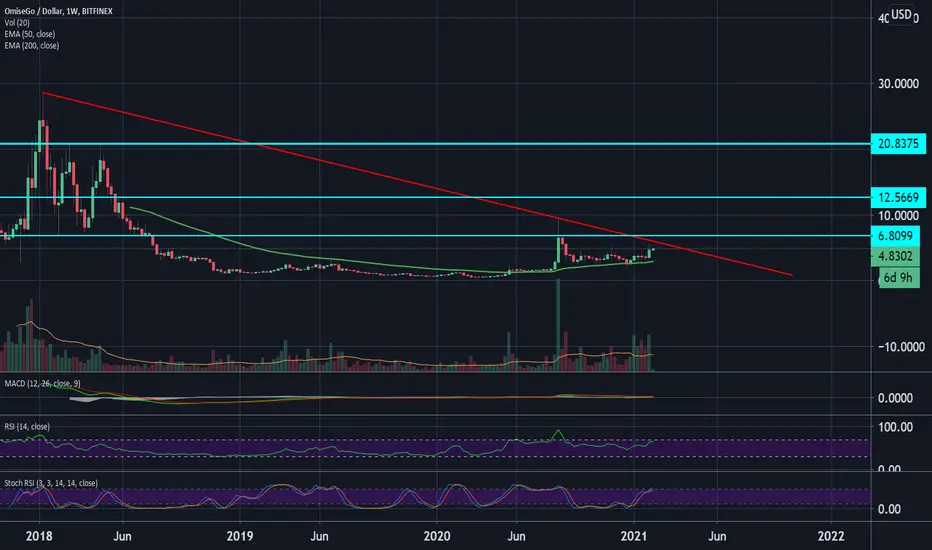
1.100 Days (161 weeks) Downtrend Reversal!Omisego is TOO CLOSE to 1.100 days (161 weeks / 40 months) DOWNTREND REVERSAL!
Candle closing above U$6 confirm the reversal.
We will have a HUGE movement when it break.
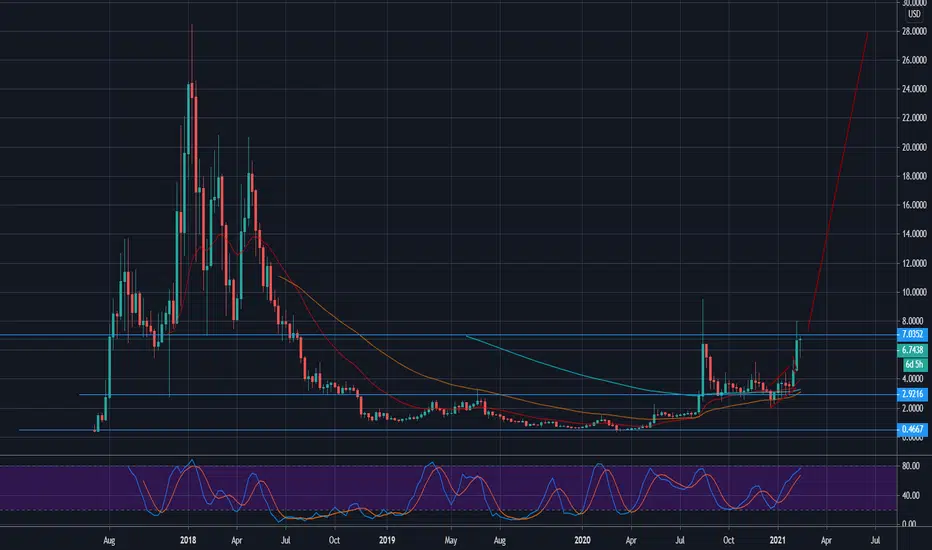
The 2023 Future of OMG Foretold by MathMr. Fibonacci was a genius so lets use the golden ratio levels combined with Fib Time Zones. Anything can happen by end of year 2023, but for now, 2021 is going to be insane. Get ready and make sure your spaceship does not run out of fuel this year.

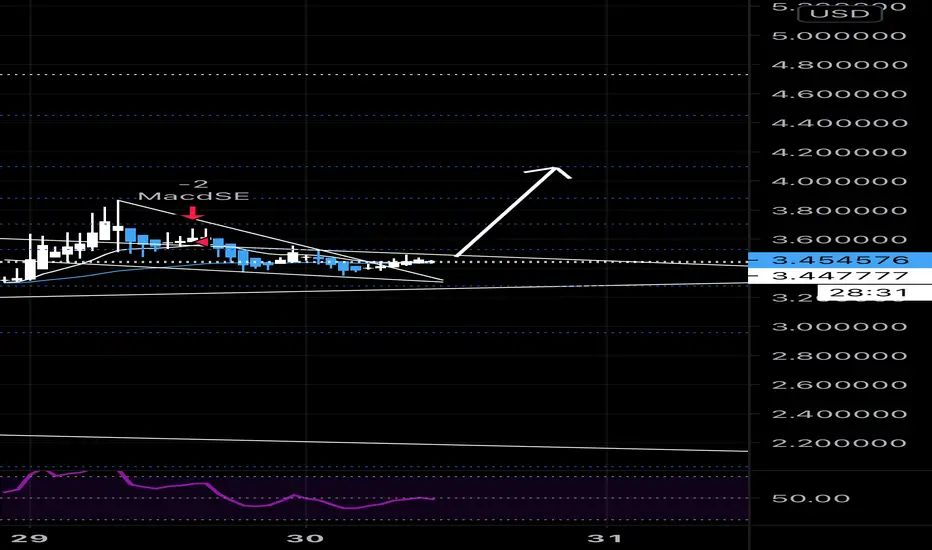
OMG/USDSeems that OMG is going to see some price action and potential reversal sooner than anticipated.
A nice breakout of the falling wedge on the 1H with a doji formation on the 4H could mean that OMG’s time is nearing.
$4 is a conservative price for next run up if Bitcoin stops swinging 10k at a time.
$10 is where I plan to take profit
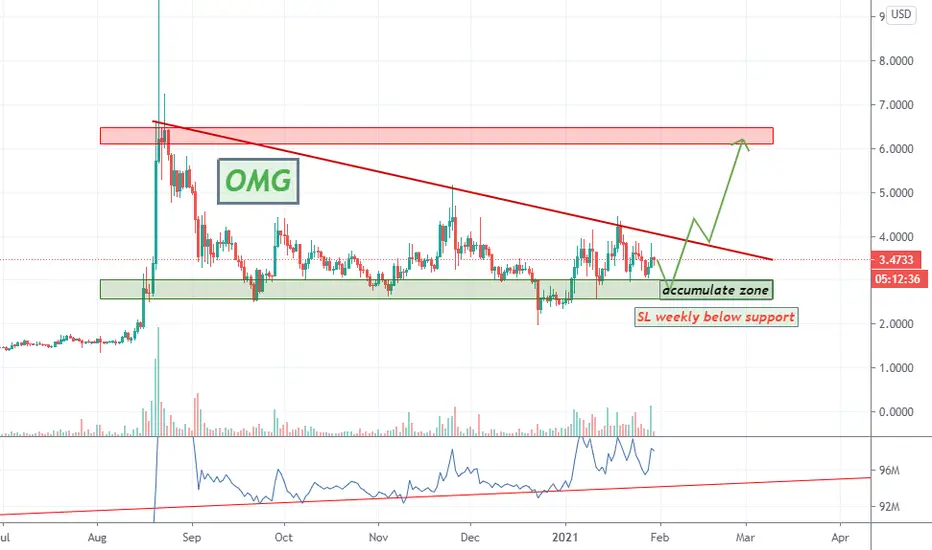
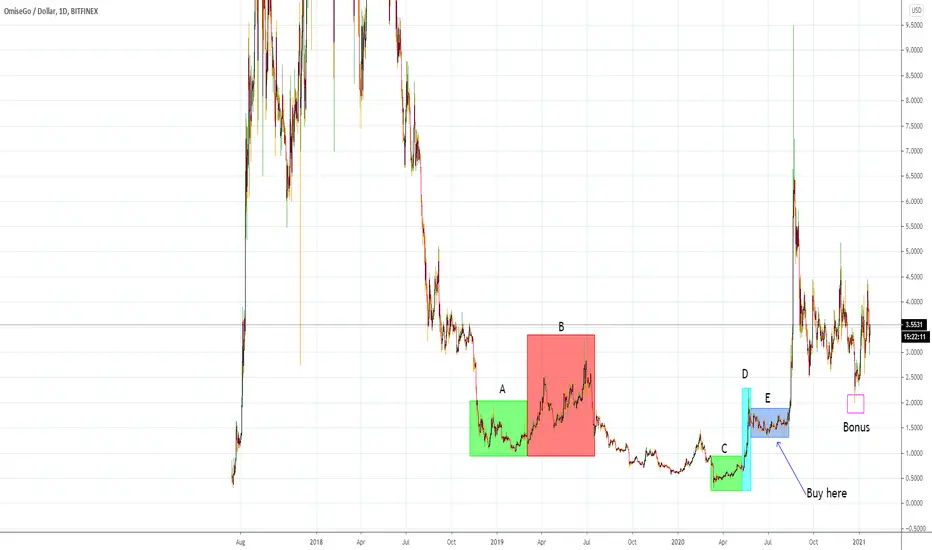
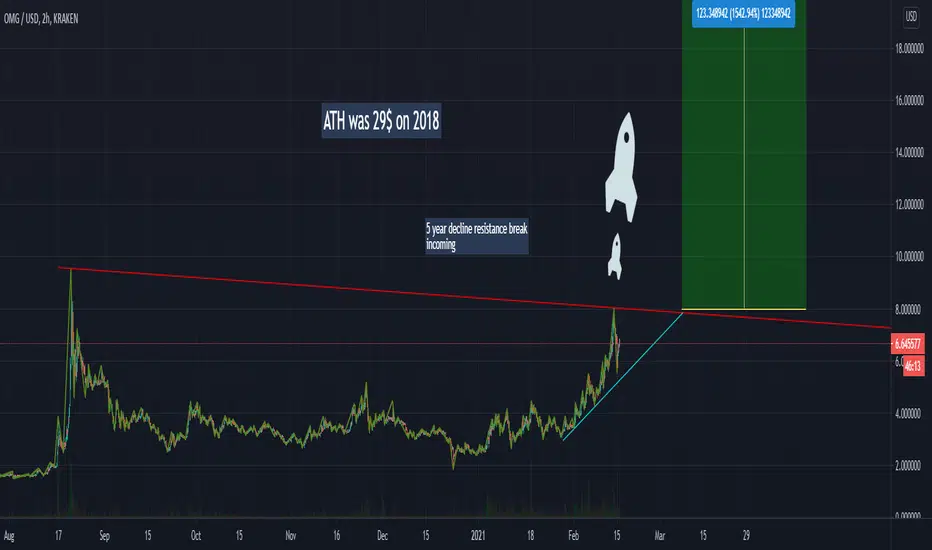
The safest strategy to trading altcoinsWhen it comes to altcoins, whales tend to own an overwhelming majority of the coins on the market. In these market situations if large holders stop selling their holdings, the supply can quickly dry up causing price to skyrocket.
We all know this phenomenon, its a pump and dump. But with "pump and dumps" there are key price movements that a vigilant trader can notice by eye. And if you can identify a pump before it happens you can hop on the rocket.
Above is a play I made on OmiseGo earlier this year. I have described the strategy below.
Part A
An accumulation zone. These occur at the bottom of price ranges, in these areas there is relatively low volatility. It may seem like a good idea to buy these areas but accumulation zones are not easy to spot without further technical assistance. Trying to "catch" an accumulation zone is a high risk play and not recommended.
Part B
The breakout. In this zone price rises higher than the accumulation area to test market conditions. In part B the price is very volatile. This means that current holders are still exiting position. Given that the general trend of crypto was bearish during this time this asset would be ignored and left to test lower.
Part C
Another accumulation zone. It is important to note that this zone is lower than Part A. This means that the BUYERS in Part A are either a. Out of their position, or b. holding at a loss. (for b. they are either long term holders or stupid) The price range in this zone become extremely flat and calm. From this we know that a fresh wave of whale accumulation is occurring and that a breakout may potentially be coming. Again I do not recommend trying to predict accumulation zones as they can punish stop losses or fail to hold completely.
Part D
The breakout. Everyone that now holds the asset is content on waiting for higher price and the sell orders dry up. The price surges and is quickly eaten by short term traders and some amount of profit taking. This is a good sign but is still not ideal for retail traders to meddle with.
Part E
The defense. In order for whales to sell large portions of their holdings to "the fools" the accumulation zone that they have bought at has to be defended. All new buyers have to purchase coins at higher price so that the whale positions cannot be undercut. For this reason whales will create a defensive zone where short term traders can exit to the "first in line." (The first in line is what we want to be) You can see this defensive price action in part E as the sharp upward price spikes where whales and day traders are accumulating fuel for the rocket. The first in line are traders are willing to buy at the higher zone as it provides a safe way to make money in the pump that is visibly about to occur. If you find an asset with parts C, D and E your are at your most safest point buying at point E. You have the power of whales behind you and empty order books above you.
Bonus
As an extra, we can see in OmiseGo that the price range in Part E was again "defended" showing that the original whales still hold the asset are still invested in protecting the integrity of the asset. This area would have been a fantastic place to re-enter... if only I have had looked at the chart in recent weeks.