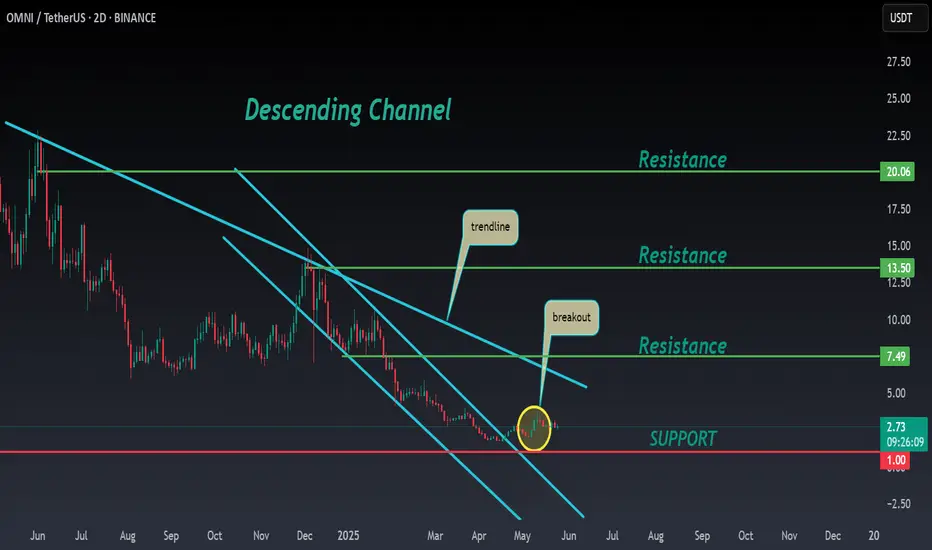
OMNI ANALYSIS📊 #OMNI Analysis
✅There is a formation of Descending Channel Pattern in daily time frame in #OMNI .
Also there is a perfect breakout and retest. There is an instant trending formation in #OMNI and if #OMNI breaks the trend line then we would see a bullish trend .
👀Current Price: $2.74
🎯 Target
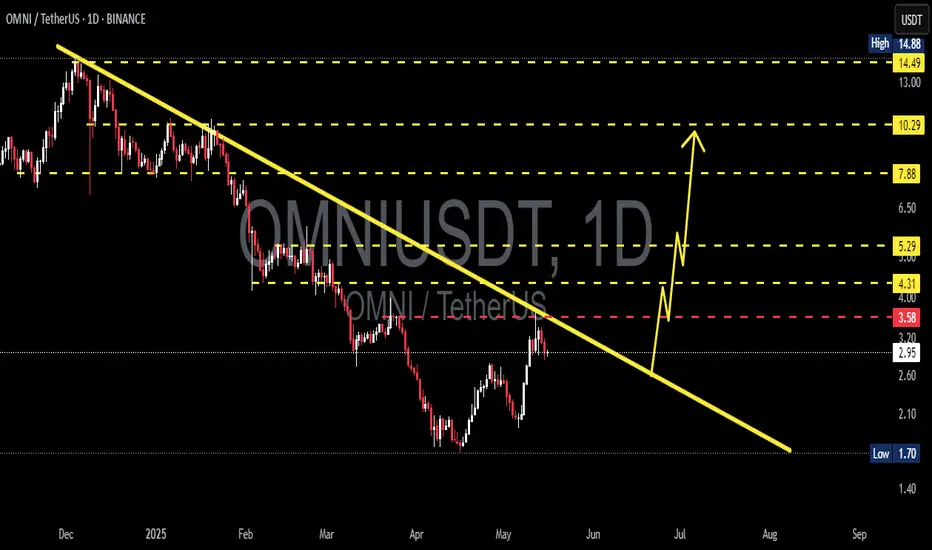
OMNIUSDT 1D Analysis OMNI ~ 1D Analysis
#OMNI Buy gradually after successfully breaking through this resistance line with a short-term target of at least 15%++ from here.
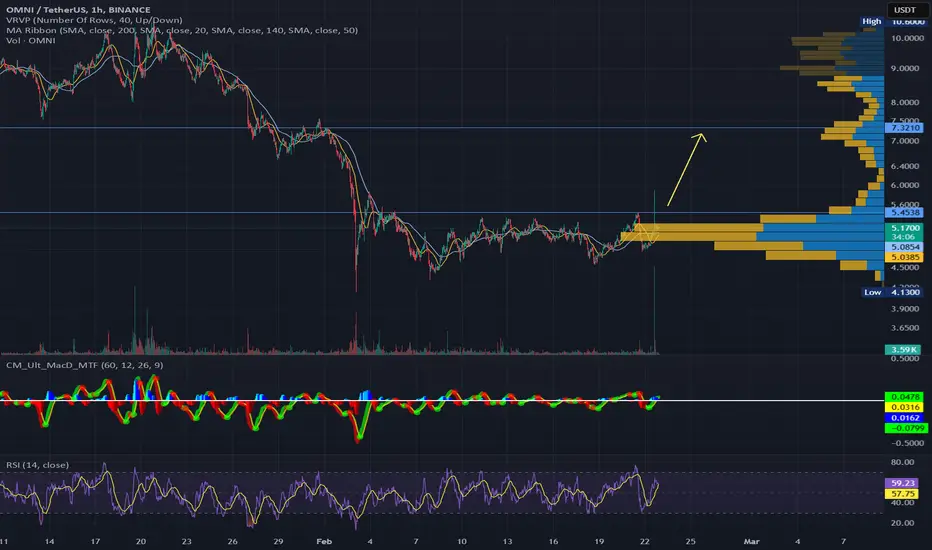
OMNI - Pushing against resistanceA high volume bar saw OMNI move pretty fast to 5.89, though price promptly went under resistance.
That resistance line has been tapped one too many times, looks ready to give way to a retracement upwards
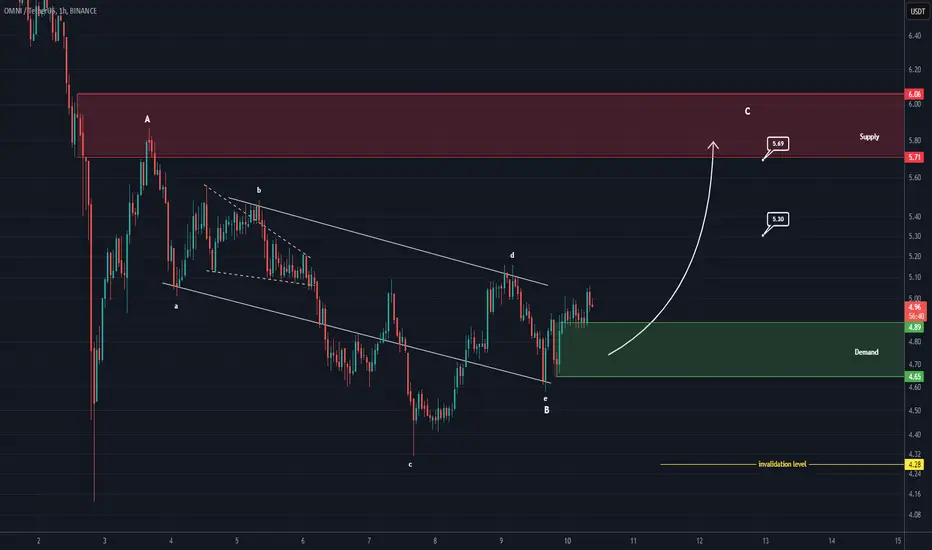
OMNI Looks Bullish (1H)From the point where we placed the red arrow on the chart, it appears that OMNI has started forming an ABC pattern and is now at the end of wave B.
If the green box holds, this counter-triangle can complete and move into wave C.
A 4-H candle closing below the invalidation level will invalidate thi
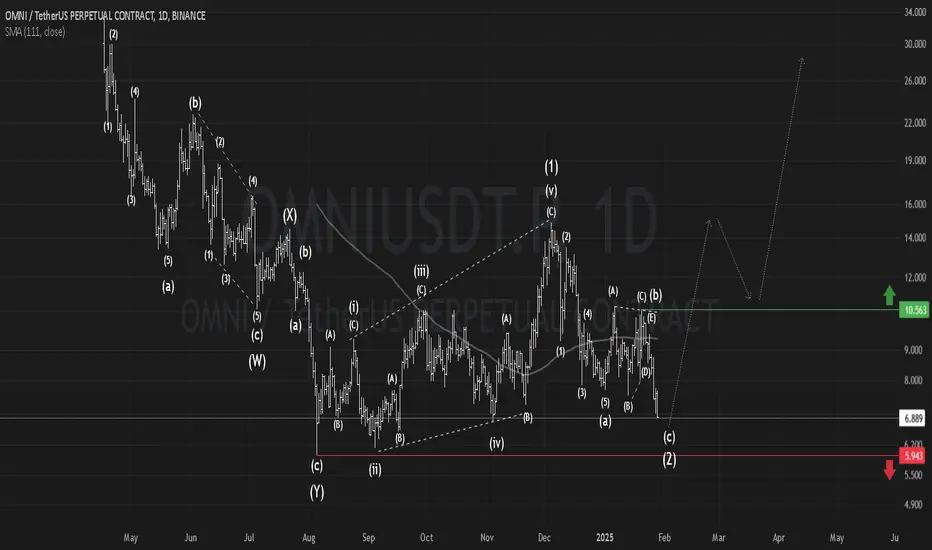
OMNI: A Critical Support#OMNI is sitting on a crucial support that must hold for the bullish idea to stay valid.
Breaking $5.94 invalidates this idea (a stop-loss).
Passing $10.56 confirms a bullish uptrend.
#OmniNetwork
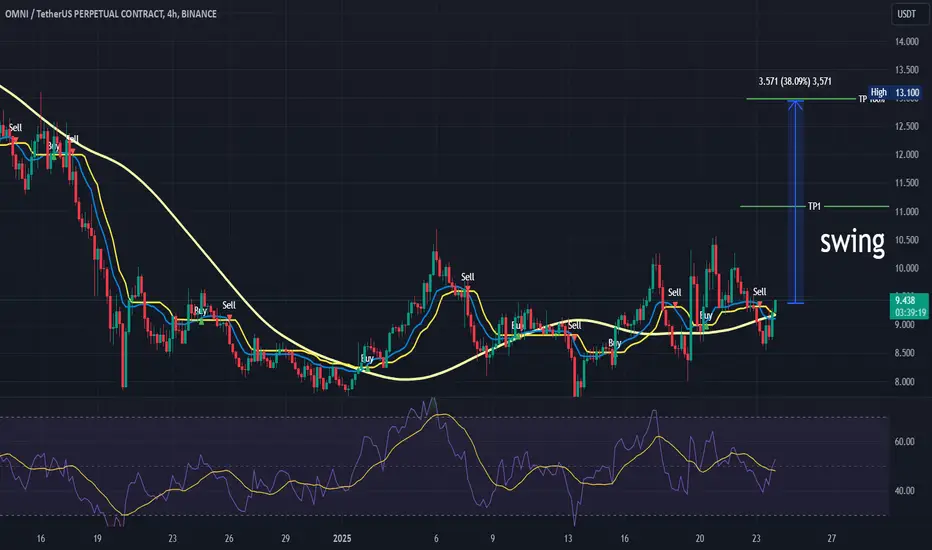
no body knows :)Price Targets (TP1 and High):
TP1 is marked as the first take-profit level.
The blue arrow illustrates the potential price movement between the current price and the higher target level (High), suggesting an expected 38.09% price increase.
Is the Tide Turning for OMNIUSDT? Key Levels and Signals to WatcThe cryptocurrency market is alive with intrigue as OMNIUSDT hovers at $9.493, a far cry from its all-time high of $33.523, marking a dramatic 71% deviation from its peak. But the story doesn’t end there. With the Relative Strength Index (RSI) stabilizing near neutral at 45, the asset teeters betwe
OMNI Network: Potential Breakout and Upside TargetBINANCE:OMNIUSDT
Hey traders,
Looking at the BINANCE:OMNIUSDT chart, we've observed significant price fluctuations over the past month. After a drop to a key monthly support level around $8.5, the price action has developed within a converging pattern, forming both a minor ascending channel an

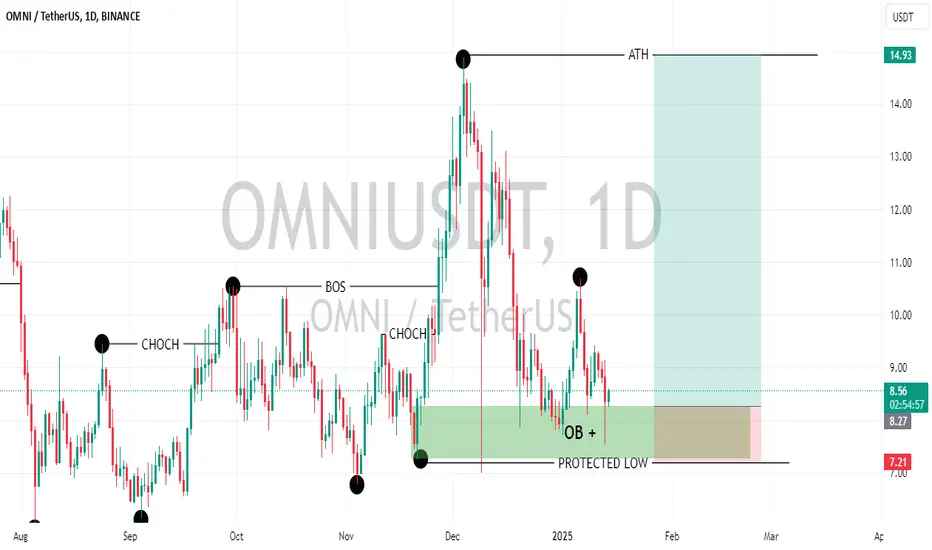
OMINI-USDTANTICIPATING AN UPWARD IMPULSIVE MOVE.
After a transition from bearish to bullish trend { CHOCH ), anticipating a perfect retracement into the daily order block thereby creating a new { BOS }. An impulsive bull movement is bound to happen.
SL: $7.21
ENTRY: $8.27
TP: $14.90
GOODLUCK.
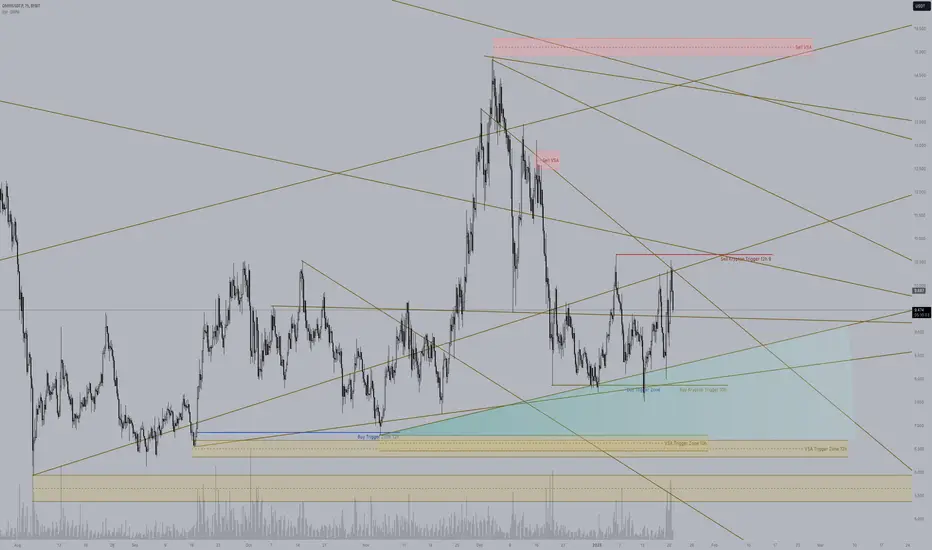
OMNI buy/long setup (4H)Considering the interaction with a major liquidity pool level, the formation of an mCH (internal structural shift), and the break of two trigger lines (major and minor), a buy setup can be established for OMNI.
We have two ENTRY levels, and if the price reaches these lines for order collection, we

See all ideas
Summarizing what the indicators are suggesting.
Oscillators
Neutral
SellBuy
Strong sellStrong buy
Strong sellSellNeutralBuyStrong buy
Oscillators
Neutral
SellBuy
Strong sellStrong buy
Strong sellSellNeutralBuyStrong buy
Summary
Neutral
SellBuy
Strong sellStrong buy
Strong sellSellNeutralBuyStrong buy
Summary
Neutral
SellBuy
Strong sellStrong buy
Strong sellSellNeutralBuyStrong buy
Summary
Neutral
SellBuy
Strong sellStrong buy
Strong sellSellNeutralBuyStrong buy
Moving Averages
Neutral
SellBuy
Strong sellStrong buy
Strong sellSellNeutralBuyStrong buy
Moving Averages
Neutral
SellBuy
Strong sellStrong buy
Strong sellSellNeutralBuyStrong buy
Displays a symbol's price movements over previous years to identify recurring trends.