Why Smart Money is Accumulating $OMTOP 4 REASONS TO ACCUMULATE BINANCE:OMUSDT
To choose a RWA project for the institutional wave, you can't ignore MANTRA ⤵️
▪️ First regulated RWA chain
▪️ Multiple real estate giants onboarded
▪️ 33% of BINANCE:OMUSDT supply in staking
▪️ Google Cloud infrastructure
▪️ Dubai sovereign wealth backing
Big players don’t fade $OMUSDT. They adopt it.🔥
#RWA #Crypto #MANTRA
OMUSDT.P trade ideas
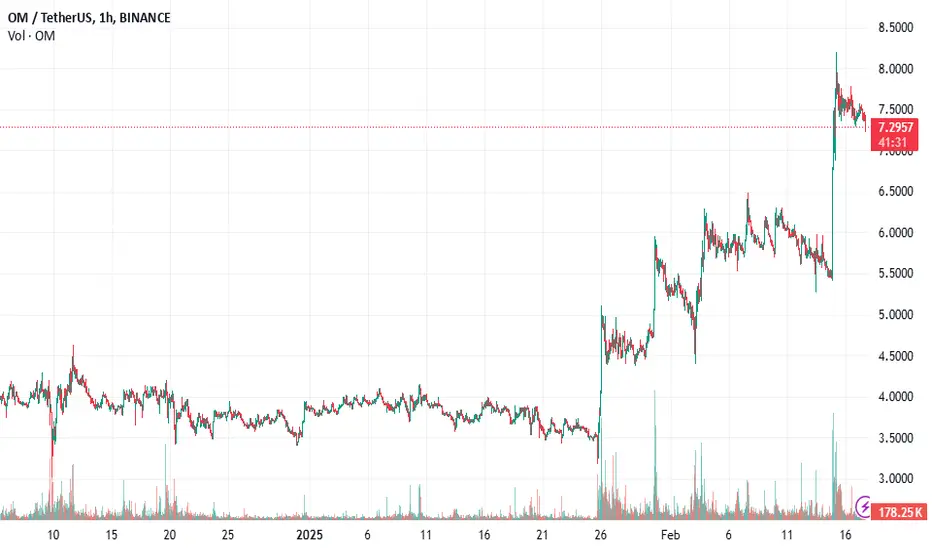
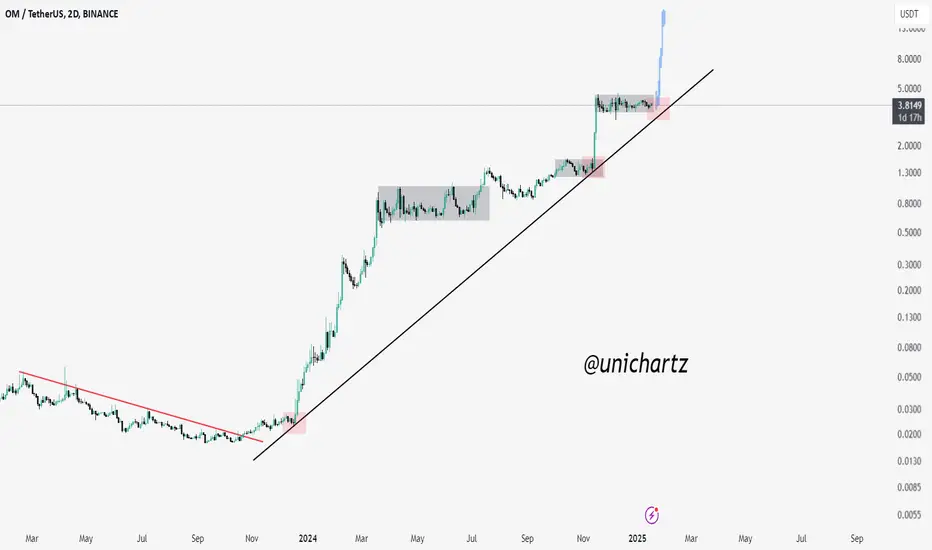
$OM’s 3900% Surge: Real Adoption, Real Gains!While people wait for the alt season, BINANCE:OMUSDT already moved from $0.20 to $7.50.
That's a 3900%+ run, and it’s far from done.
Real adoption, real gains.

$OM Bounces Hard—Next Stop, New ATH?BINANCE:OMUSDT is showing exactly what the market is gearing up for.
👉It tested key support levels, with strong interest driving a rapid bounce
👉Institutional interest and adoption ramped up quickly, followed by a powerful green weekly candle
BINANCE:OMUSDT New ATH incoming.
#MANTRA #RWA #Bullish
$OM’s Next Big Move: The RWA Surge Begins!The next leg up for BINANCE:OMUSDT is about to begin, the RWA market is at a turning point, indicating major institutional moves ahead.
The team behind this project is highly active, and their community support is exceptional.
#MANTRA is just starting, and I'm confident it will reach a market cap of FWB:15B to FWB:20B during this cycle.
BINANCE:OMUSDT at $7.5—$15 is closer than you think.
#Altcoins #OM #BTC #Whales #Bullish
RWAs: The Future of Crypto is Backed by Real AssetsRWAs are changing crypto forever.
While most tokens rely on hype, RWAs are backed by real assets—real estate, bonds, private credit, IP etc.,
📈 Institutional adoption is growing.
💰 TVL is skyrocketing.
🏦 Wall Street is already in.
And BINANCE:OMUSDT (MANTRA) is leading the charge.
Still watching from the sidelines?
#Crypto #Layer1 #Blockchain #MANTRA

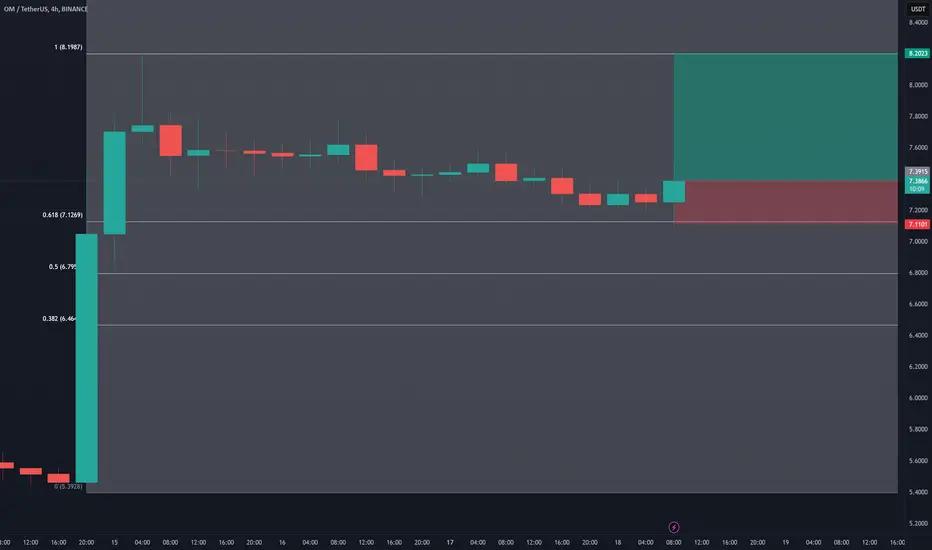
Mantra $OM LongNASDAQ:OM is bouncig off Fibonacci 0.618 level. Bullish movement to Fib. 1 level is expected to happen
$OM vs $SUI: Race to $10 – My Bet's on $OMBINANCE:OMUSDT is on fire, going bullish aiming for a new ATH
Meanwhile, CRYPTOCAP:SUI is a solid performer, but BINANCE:OMUSDT is stealing the show.
Which one will break $10 first?
My money's on BINANCE:OMUSDT with this momentum!
$OM: $50B MCAP InevitableThe next wave?
TOKENIZATION
Even Robinhood’s CEO sees it! Larry Fink is bullish
$NASDAQ:OMUSDT going to reach 50B Mcap minimum, gonna revisit this post — MARK IT!

RWA Giants $OM & $ONDO Set to SoarRead this and raise your targets.
RWA category top projects are going to eat billions of dollars coming to the market.
study BINANCE:OMUSDT BYBIT:ONDOUSDT and you will understand how they are the fundamentally solid tokens to have in your portfolio.
Missed ETFs? Don't Miss the RWA BoomA lot of people missed the ETF trade. Don't mess up the RWA trade.
Agree! I have bought a decent size spot bag for BINANCE:OMUSDT $LSE:ONDOUSDT both will easily do 20x from here.
RWA NARRATIVE STRONG.
$OM: Biggest Bag for the Bull RunMarket looks bottomed out & I think we get a huge rally soon.
I bought more $NASDAQ:OMUSDT on the dip towards $4.3 & is currently my biggest bag for this bullrun.
Not selling any before we hit $15.
@MANTRA_Chain
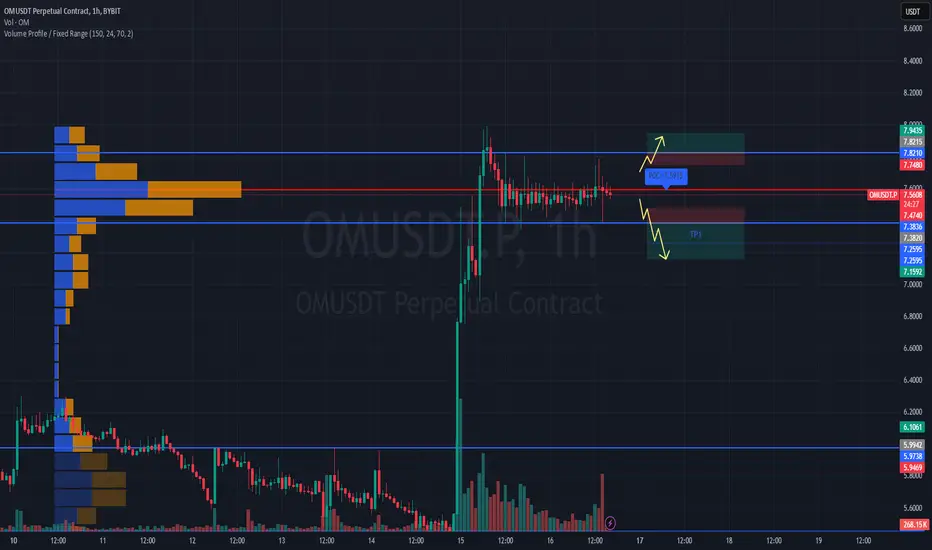
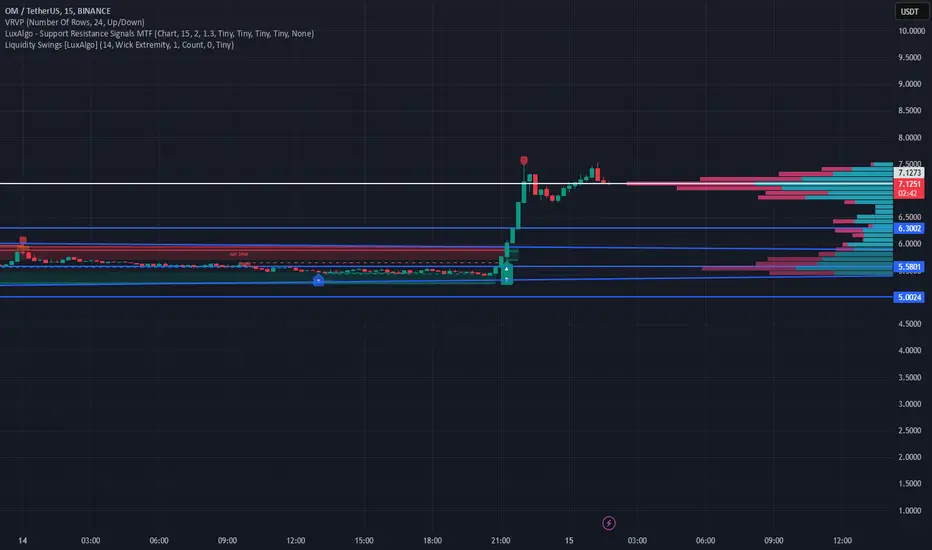
#OMUSDT – Critical Breakout Zone📊 BYBIT:OMUSDT.P is consolidating after a strong impulse move, trading near POC ($7.5915), indicating liquidity accumulation. The price is currently trapped in a tight range, suggesting an imminent breakout in either direction.
Recent high volumes indicate strong participation from major players. The question remains—will buyers push the price higher, or will sellers take control and drive it down?
⏱ 1H Timeframe
✅ Overview:
➡️ BYBIT:OMUSDT.P remains in a tight consolidation zone between resistance $7.8215 and support $7.3820.
➡️ POC ($7.5915) marks the high-volume area, making this range critical for the next move.
➡️ Price action within this zone may continue until a confirmed breakout occurs.
━━━━━━━━━━━━━━━━━━
⚡ Long Plan:
➡️ Enter long above $7.8215 after a strong breakout and confirmation.
➡️ Stop-Loss at $7.7480—below the consolidation range.
🎯 TP Target:
💎 TP1: $7.9435
━━━━━━━━━━━━━━━━━━
📉 Short Plan:
➡️ Enter short below $7.3820 after confirming weakness.
➡️ Stop-Loss at $7.4740—above the nearest resistance.
🎯 TP Targets:
💎 TP1: $7.2595
💎 TP2: $7.1592
📢 If the price confirms a breakout above $7.8215, an upside move to $7.9435 is likely.
📢 Conversely, a breakdown below $7.3820 could lead to $7.1592.
🚀 BYBIT:OMUSDT.P is poised for a breakout—watch volume and direction closely!
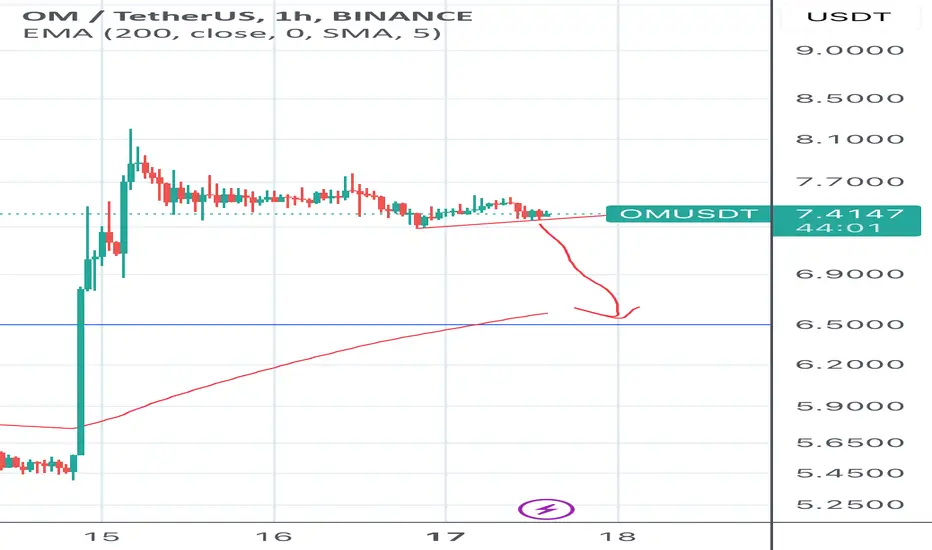
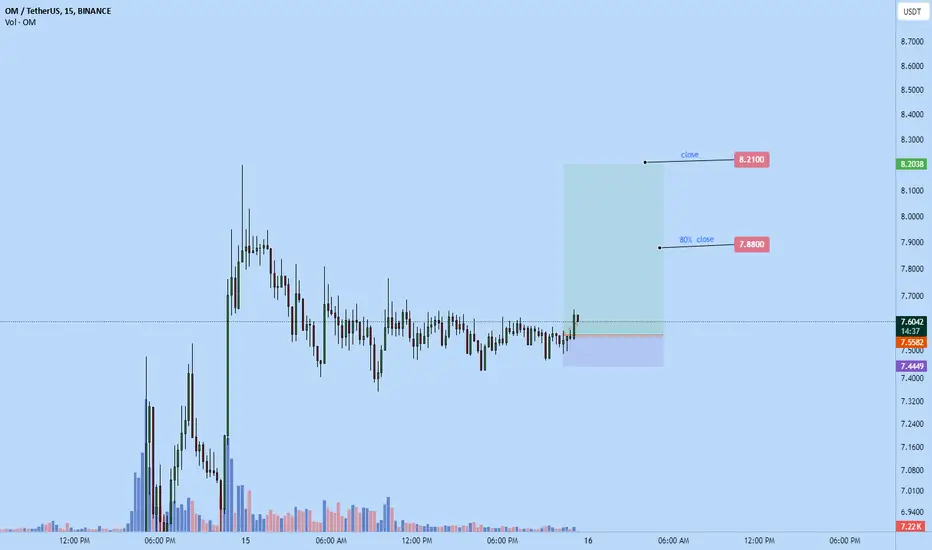
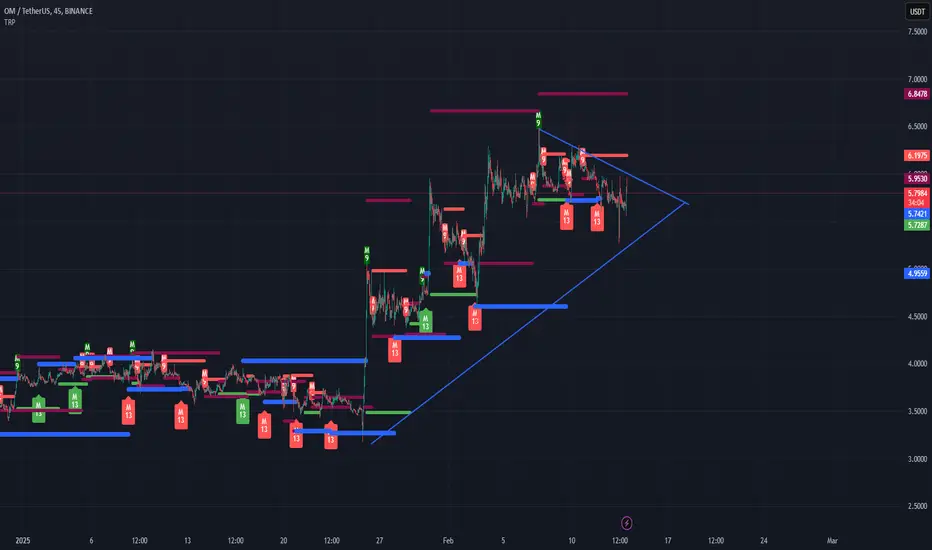
Om Long back to $7.88-$8.21Just now I opened a long trade on OM usdt. I think the the bulls are just about ready to attempt to push for ATH gain. As am typing is spiking up.
Time sensitive.
Targets on chart
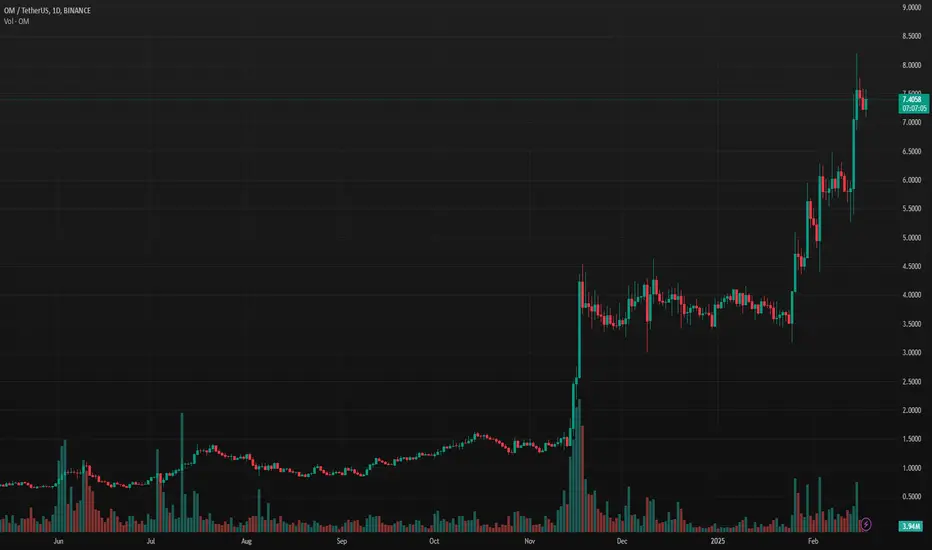
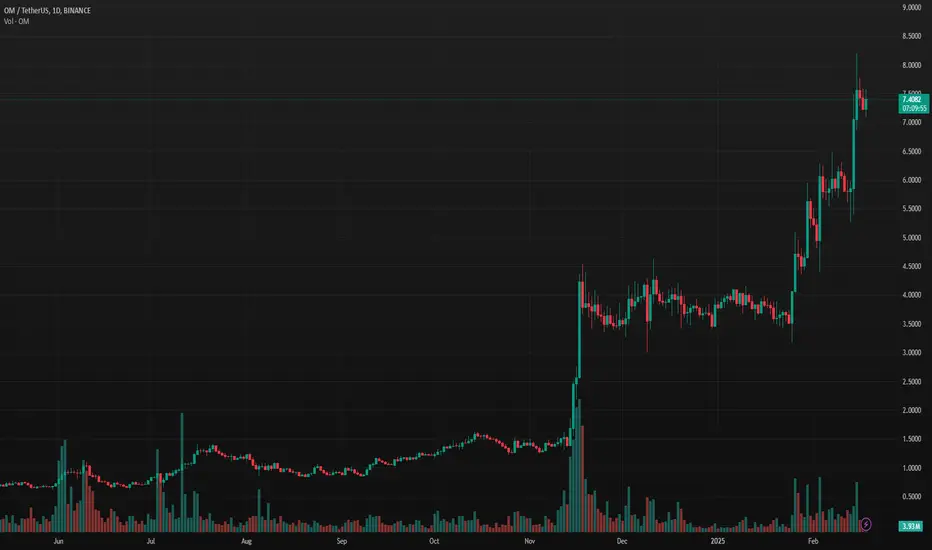
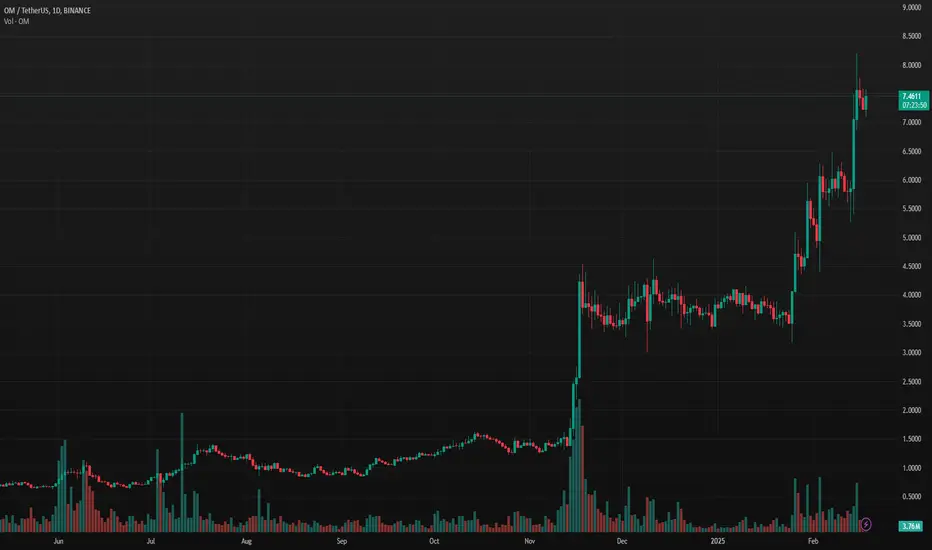
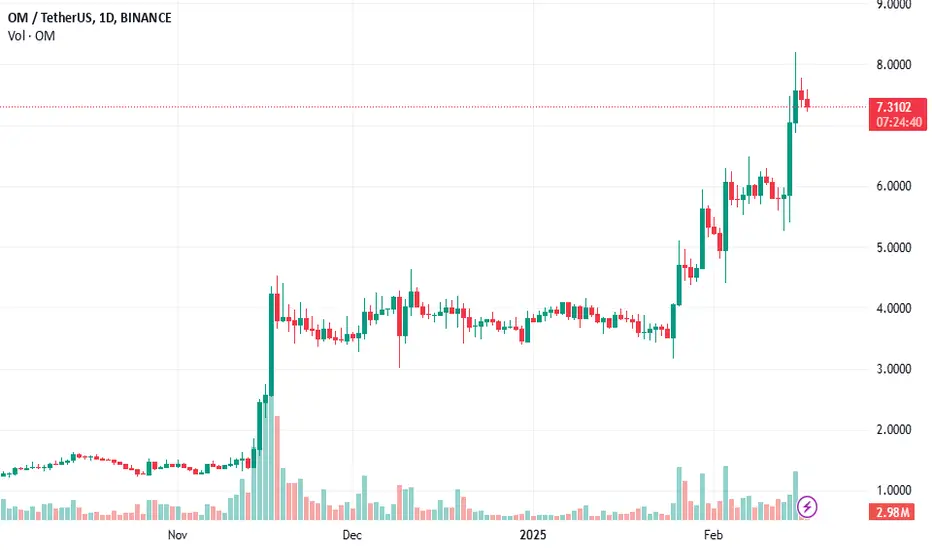
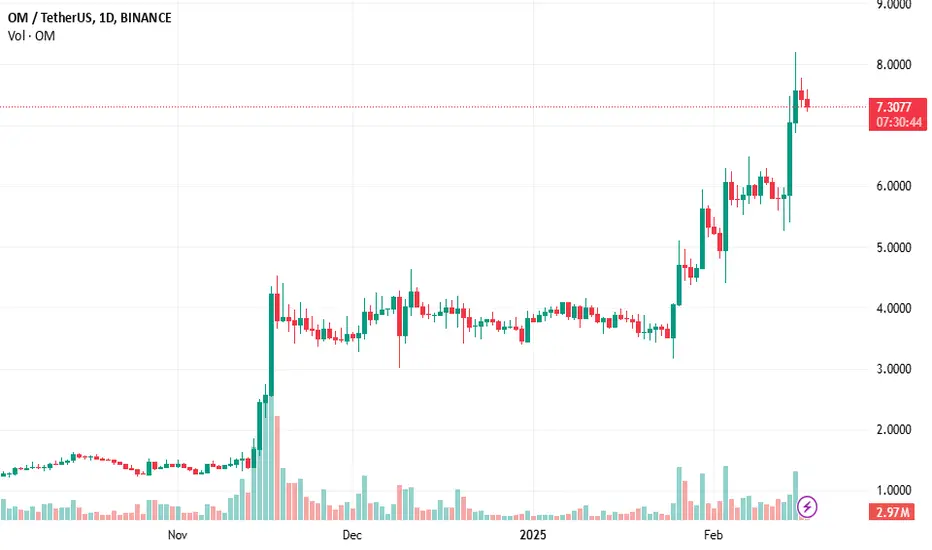
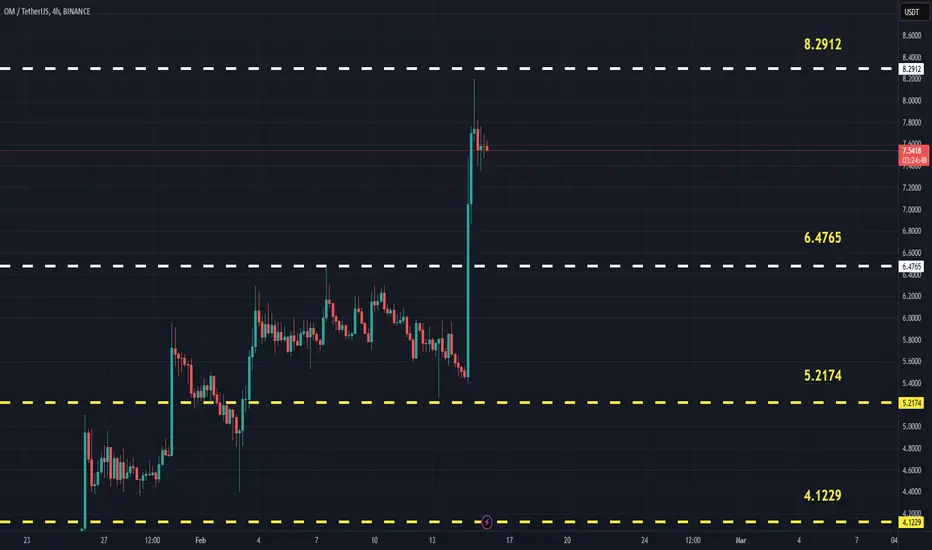
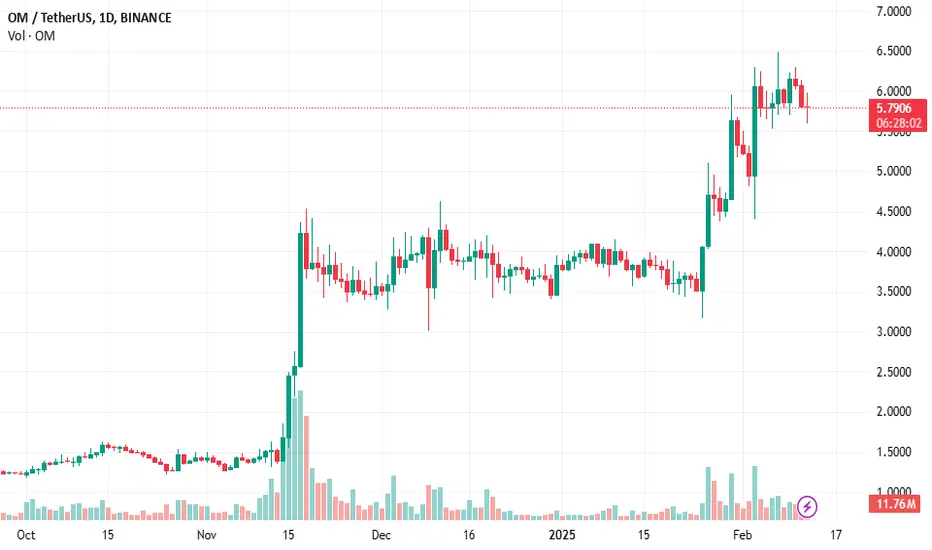
OMUSDT(MANTRA) Updated till 15-02-25OMUSDT(MANTRA) Daily timeframe range. this thing is in absolute roll. outperforming many alts out there right now. breaking 8.2912 will push it to price discovery and new high. even its cools down a bit if it stay above 6.4765 the push will continue.
5 Wave Structure completeIt seems like BINANCE:OMUSD has completed its final 5th wave, are we about to finally enter the correction phase? OM has been really strong in its rally considering the rest of the cryptospace has been lagging behind.

OM/USDT Surges After Breakout: Next Stop $5?OM/USDT is showing strong bullish momentum after breaking out from the descending trendline, indicated by the red line. The price has recently made a sharp upward move and is currently trading above the support trendline, which suggests that the uptrend could continue.
The price consolidated within the grey zone for a while, and after breaking above this, it surged higher, pointing to strong buying interest. The recent breakout indicates that we could see further upward movement toward the next resistance levels.
The next potential target for OM/USDT is around the $5.00 level, with support from the trendline and previous breakout zones providing a solid base for the rally.
Do not short this coin yet!!! Hi everyone,
We totally understand how much you want to short this coin at this point, but we strictly suggest to hold your horses as it will push higher..
Instead if it will try to grab the longs (drop it) Buy the dip. And when i say the dip we talking about 5.7 entry even lower if possible, with spreading your capital.
This coin is still on uptrend!
More updates are coming for this coin.
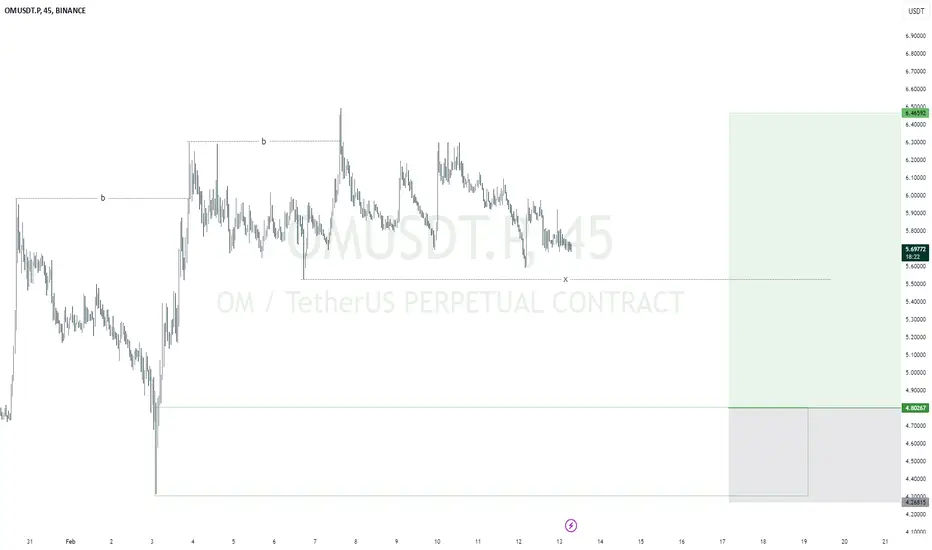
OMUSDTmy entry on this trade idea is taken from a point of interest below an inducement (X).. I extended my stoploss area to cover for the whole swing as price can target the liquidity there before going as I anticipate.. just a trade idea, not financial advise
Entry; $4.80267
Take Profit; $6.46592
Stop Loss; $4.26815
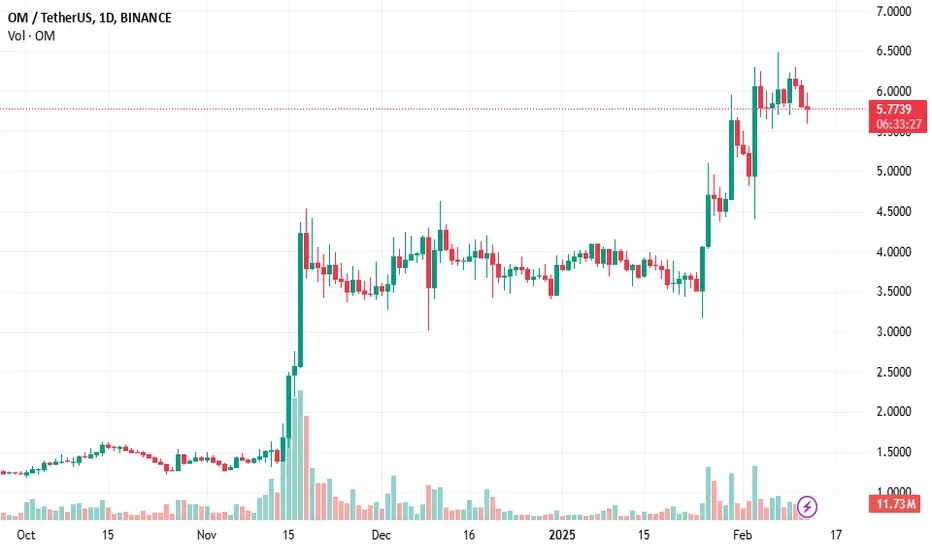
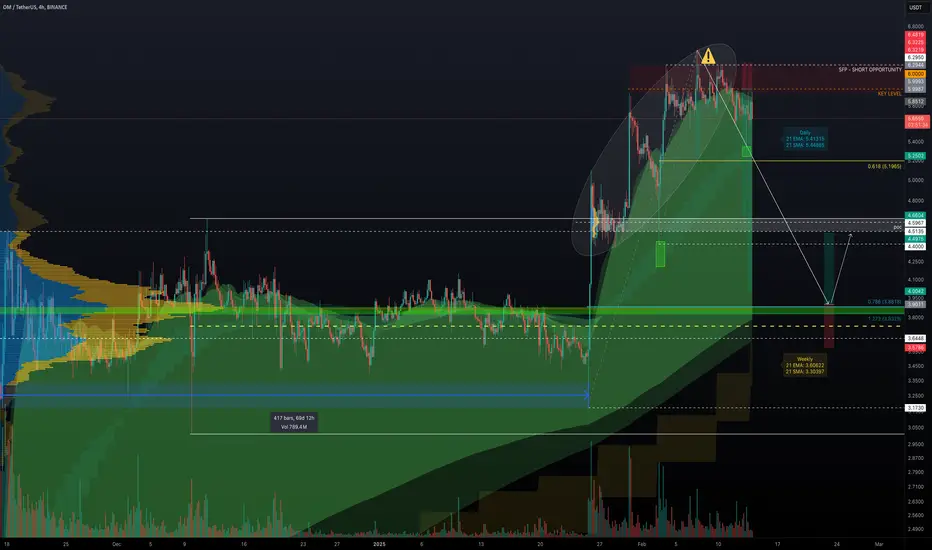
OM's Meteoric Rise: Time to Buy the Dip or Short the Top?OM has been on an astronomical journey, soaring from $0.0173 on 12 October 2023 to an all-time high of $6.485 on 7 February 2025 – a jaw-dropping +37,494% increase in just 484 days. Currently ranked 26 with a market cap of $5.5B, OM’s meteoric rise has everyone asking: Is OM topping out, or is there still more upside? Could a significant correction be on the horizon? Let’s dive into the technicals and explore our trade setups with high conviction, backed by a wealth of confluence.
Market Structure & Historical Context
Between mid-November 2024 and the end of January 2025, OM traded within a 70-day range, oscillating between $4.4 and $3.3. The Point of Control (POC) for this range is around $3.87, marking a critical level where price action has repeatedly converged. This trading range provides the backdrop for our analysis, highlighting both key support and potential resistance zones that may dictate OM's next move.
Key Support Zones & Confluence
A multitude of technical indicators converge around the $3.87 level, making it a crucial support area:
1.) Fibonacci Retracement Confluence:
Taking the Fibonacci retracement from the low at $3.173 (25 January 2025) to the recent high, the 0.786 retracement level lands at $3.8818—just a hair above our POC.
2.) Channel Median Line:
The median line drawn through the highs and lows of the 70-day trading range reinforces the significance of this area.
3.) Moving Averages:
The weekly 21 EMA/SMA currently sits between $3.63 and $3.31, and as they trend higher, we can expect them to approach $3.9 in the coming week, offering additional support.
4.) Trend Indicator (Beta):
On the 4-hour timeframe, my new upcoming Trend Indicator highlights bullish momentum edging around $3.75, further consolidating support.
5.) Fibonacci Extension:
The 1.271 Fibonacci extension from the previous low at $4.4 places a key level at $3.8329, adding yet another layer of confluence.
Collectively, these factors create a robust support zone, suggesting that any retracement towards this level might serve as an attractive entry point for long positions.
Resistance Levels & Trade Setups
Resistance Analysis
OM has repeatedly faced strong resistance near the $6 mark:
Rejection Patterns:
The chart reveals multiple rejections around $6, with a notable Swing Failure Pattern (SFP) at $6.295 that confirmed bearish pressure.
Short Trade Opportunity:
Previously, the rejection at $6.295 offered a low-risk short trade: risking about 3% for a potential gain of 17% to the Fibonacci retracement level of 0.618 (approximately $5.1965), which was nearly reached.
Potential Trade Setups
Short Trade Setup
With OM encountering strong resistance around $6 and historical rejections at key levels, a breakdown could spark further downward movement.
Entry & Stop Loss:
Entry: Initiate a short position if price fails to break decisively above $6.
Stop Loss: Set a 5% stop loss above the previous SFP.
Targets & Risk/Reward:
Targets: Consider targets at $4.7 (yielding approximately +22%) or $4.0 (around +34%).
Risk/Reward: This setup offers an impressive risk/reward ratio of 4:1 to 6:1.
Long Trade Setup
The multiple layers of support around $3.87 present an attractive opportunity for long entries should the price retrace, despite the overall bullish structure. Historically, OM has bounced off its 21 daily EMA/SMA, as marked by previous green box zones on the chart.
Entry Strategy & Laddering:
Entry: Look for long entries if price pulls back to the support zone.
Laddered Positions: Consider scaling in with positions between $4 and $3.75. This dollar-cost averaging (DCA) approach will help optimise your entry over the pullback.
Stop Loss & Target:
Stop Loss (SL): Set your stop loss below $3.58 to account for volatility while protecting against a breakdown.
Take Profit: Target the $4.5 level as your primary take profit.
Risk/Reward:
With laddered entries between $4 and $3.75, this setup provides an approximate risk/reward ratio of 2:1, though the exact ratio will depend on your specific DCA entry points.
Final Thoughts
Only execute shorts with clear confirmation from order flow analysis.
Conversely, a pullback towards the support zone presents an appealing long opportunity for those confident in OM’s enduring momentum.
As always, it’s essential to monitor price action closely and adjust your strategy as new data unfolds.
Okay. Wrapping up this analysis. Wishing you all profitable and successful trades! =)
"OM/USDT: Key Levels to Watch for Potential Breakout!"As expected OM/usdt keeping it's position nice and steady and preparing for a break out .
Once it will break our resistance area on 6 then next target will be 7, of course we are not waiting till OM will hit 7 and that's why we getting our profits around 6.8.
Attention, cause OM is on an uptrend that doesn't mean that you should not expect a momentum downfall in order to grab the longs , even if shorts are more.
That's why if you are a trader you should use a stop loss or to be covered at lease for a 24% drop.
Trade with cautiousness and be extra carefull at this point as market will be a bit more volatile than usual.
It will definately try to confuse you so avoid XRP, BTC, solana, ADA, Dogecoin, peppe , for long positions as there is massive propabillity the market to crash in order to grab the longs!!
Altcoin bull run is far more than you think so don't listen in fomo as right now the expertise try to confuse you in order to get your longs!
Take care guys and remember we are not day traders. Our job is to identify the trend!
Stay Safe!
$OM: 10X Tokenization Play for Q3Everyone is now talking about tokenization.
DON'T FADE $OM. Get un early now for a 10X by Q3.
$OM: RWA Boom Fueling Top 10 RunBINANCE:OMUSDT is going parabolic as RWA season is in full swing.
The recent pump was just the teaser—real move loading to double digits.
MANTRA to TOP 10 is programmed.