
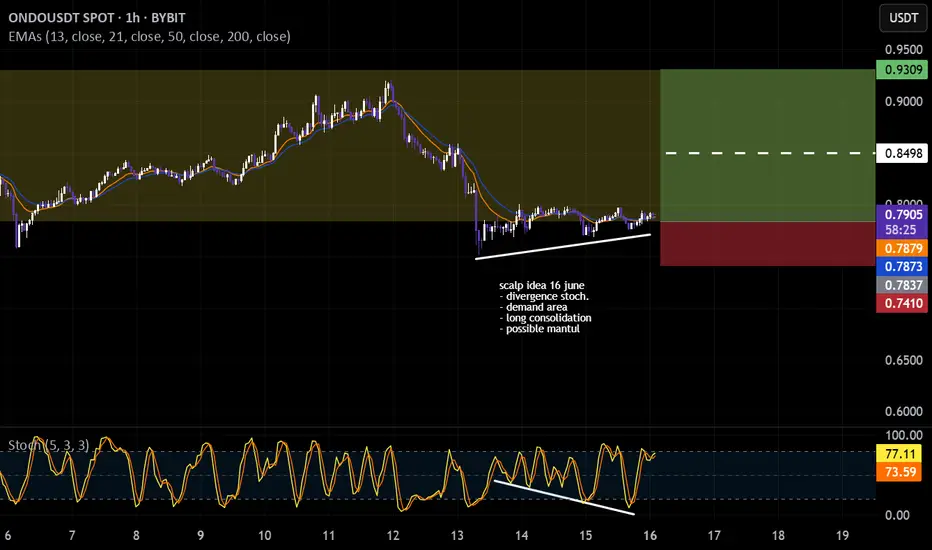
ONDO Scalp ideascalp idea 16 june
- divergence stoch.
- demand area
- long consolidation
- possible bouncing in this area
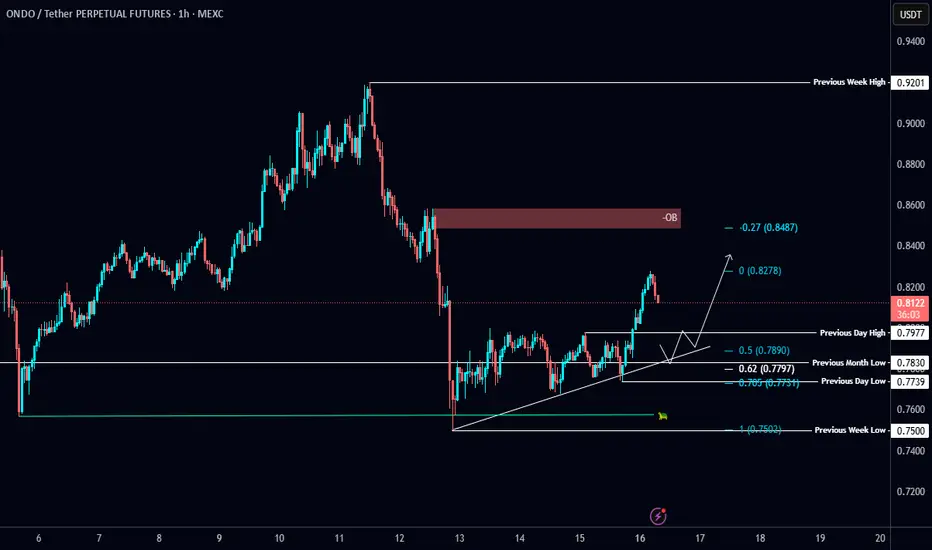
$ONDO/USDT Analysis📊 $ONDO/USDT Analysis 📊
📉 #ONDO swept the SSL and bounced strongly, reclaiming the PML 💪
🔹 Trendline support holding well — eyes on a retest for a potential long with confirmation🔍
Let price come to you. No rush, just precision🎯
ONDOUSDT trade PlanONDOUSDT is forming a larger A-B-C corrective structure on the daily timeframe. The current wave count suggests that wave C is underway with bullish targets at 2.2287, 3.1943, 4.7567, and 6.3191. Structure remains valid as long as the recent low holds as the end of wave B.
#ONDO #Crypto #ElliottWa

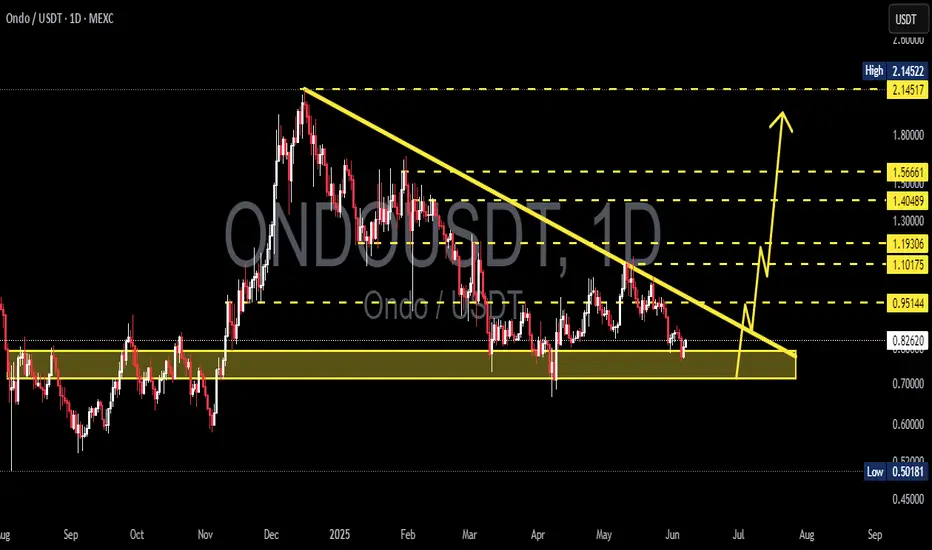
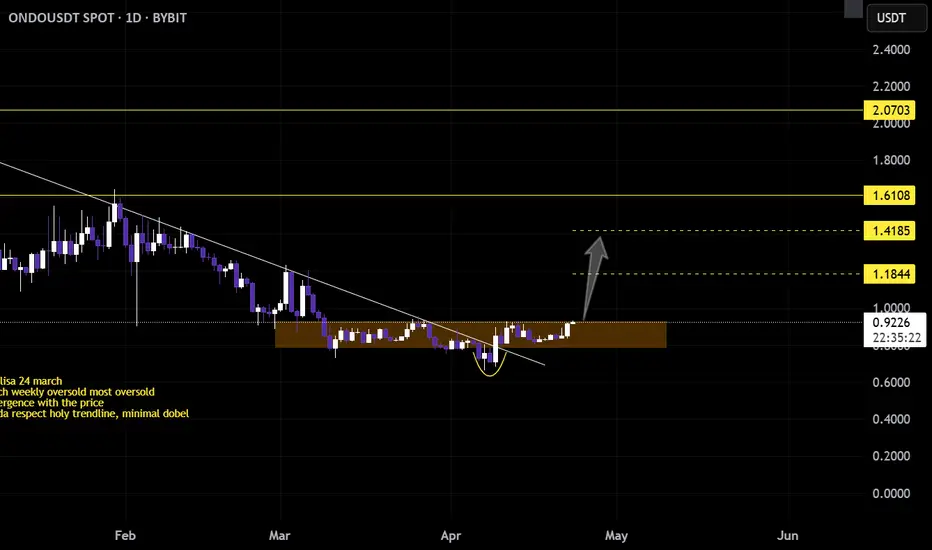
ONDOUSDT 1D AnalysisONDO ~ 1D Analysis
#ONDO Buy back on a retest of this support block with a short term target of at least 15%+ from here. Long term target $2.1
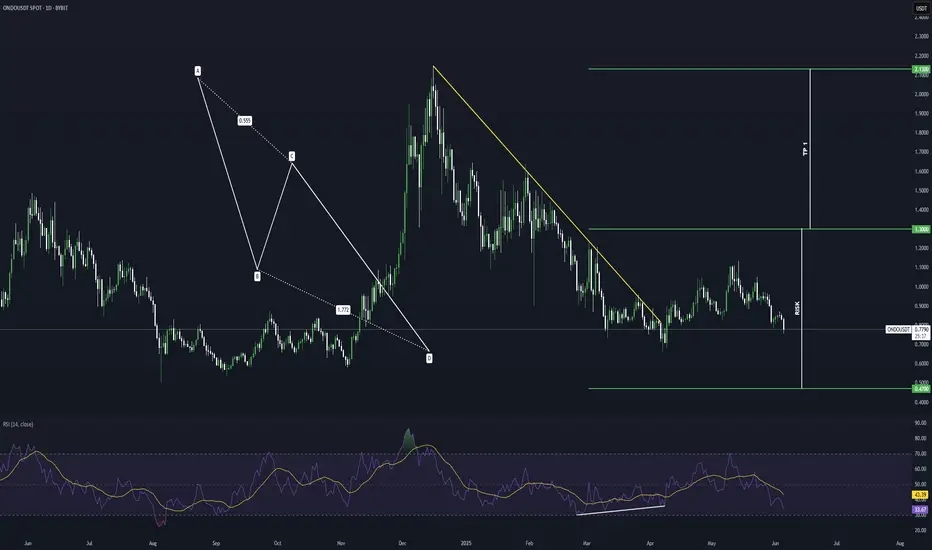
ONDO Finance Potential Bullish Breakout OpportunityONDO Finance seems to exhibit signs of overall potential Bullish momentum if the price action forms a prominent Higher High with multiple confluences through key Fibonacci and Support levels which presents us with a potential long opportunity.
Trade Plan:
Entry : 1.3
Stop Loss : 0.47
TP 1 : 2.13
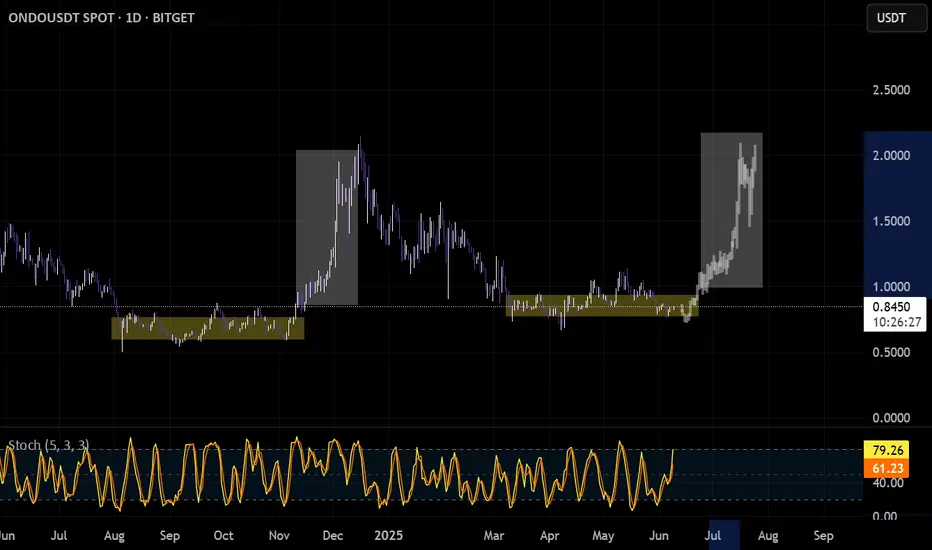
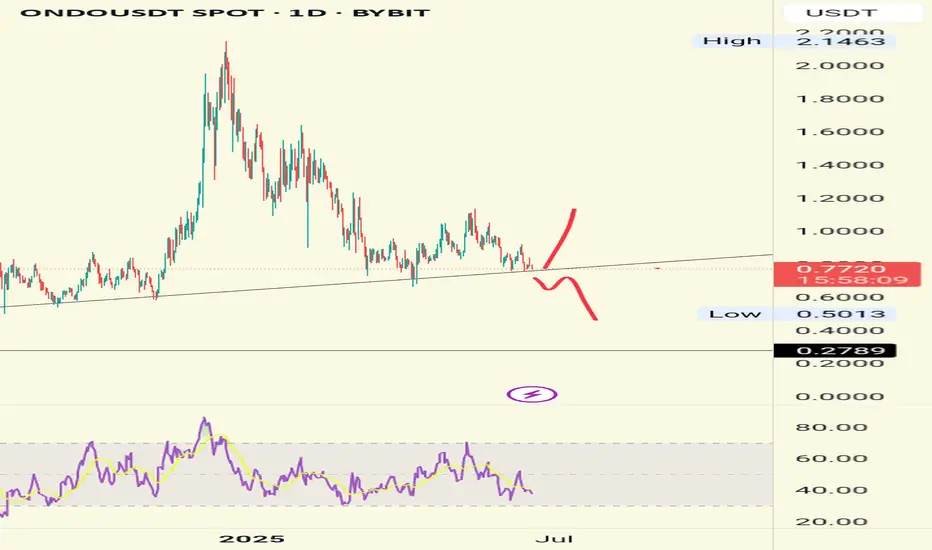
ONDO Bottom?Ondo possible bottoming.
Consolidate in daily timeframe.
The grab
breakout diagonal trendline.
could breakout in the consolidation area soon.
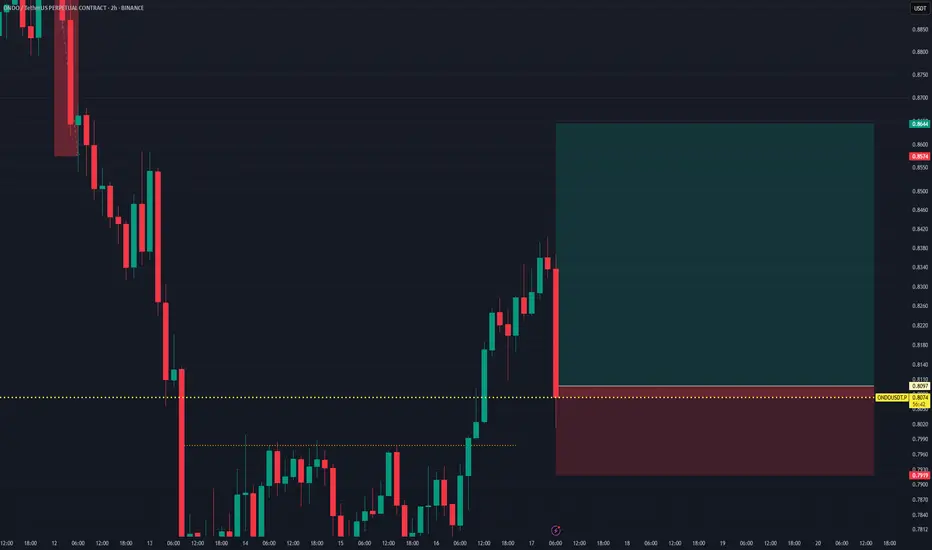
ONDOUSDT Bullish Retest Entry – Momentum Continuation PlayONDOUSDT.P is showing a potential bullish continuation after a clean rebound from intraday support. The price successfully retested the breakout level around 0.8100, forming a possible higher low, indicating renewed buying interest. This setup aims to capture the next upward leg with a tight stop-lo
See all ideas
Summarizing what the indicators are suggesting.
Oscillators
Neutral
SellBuy
Strong sellStrong buy
Strong sellSellNeutralBuyStrong buy
Oscillators
Neutral
SellBuy
Strong sellStrong buy
Strong sellSellNeutralBuyStrong buy
Summary
Neutral
SellBuy
Strong sellStrong buy
Strong sellSellNeutralBuyStrong buy
Summary
Neutral
SellBuy
Strong sellStrong buy
Strong sellSellNeutralBuyStrong buy
Summary
Neutral
SellBuy
Strong sellStrong buy
Strong sellSellNeutralBuyStrong buy
Moving Averages
Neutral
SellBuy
Strong sellStrong buy
Strong sellSellNeutralBuyStrong buy
Moving Averages
Neutral
SellBuy
Strong sellStrong buy
Strong sellSellNeutralBuyStrong buy
Displays a symbol's price movements over previous years to identify recurring trends.