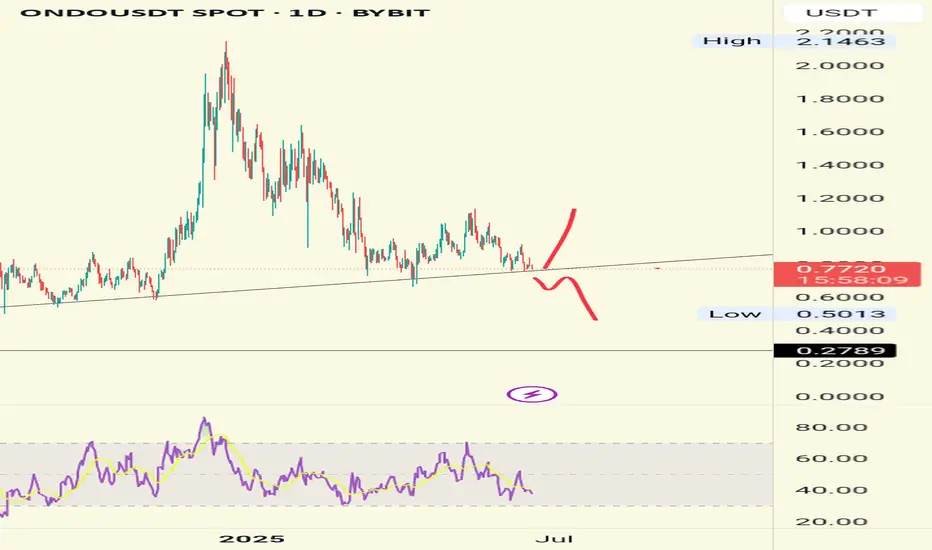
ONDO — Reversal or more Pain ahead? After a strong rally back in 2024, ONDO topped at $2.15 — completing a clear 5-wave impulsive move. Since then, price has entered a prolonged downtrend, dropping over -70%, with no confirmed reversal signs yet.
We’re now trading around a critical zone near $0.70. So the question is: where’s the nex
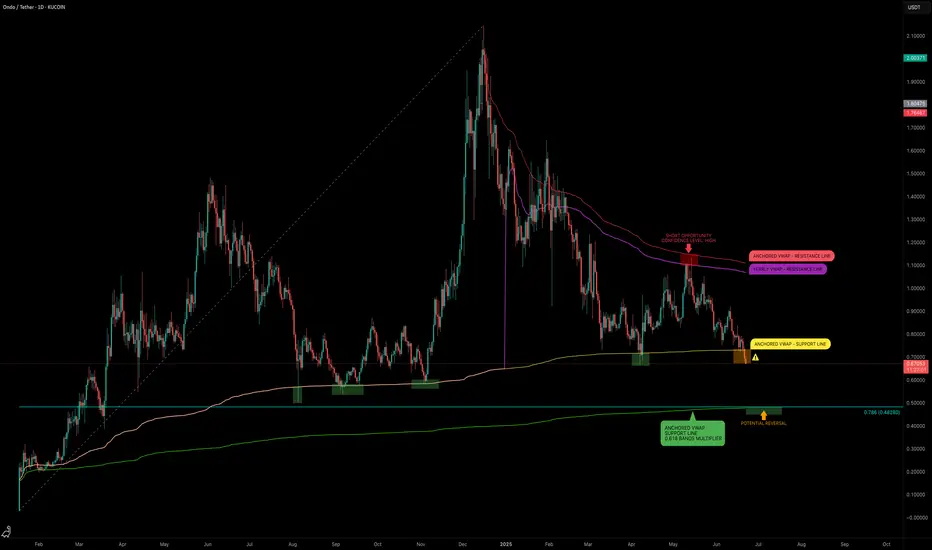
Ondo (ONDO): Reached Another Pump Zone | Good Entry Right HereOndo coin reached the local liquidity trend, where reaching this area was signaling us of upcoming smaller buyside movement.
So that's what we are looking for right now as well, a healthy upward movement towards our major target area at least.
Swallow Academy

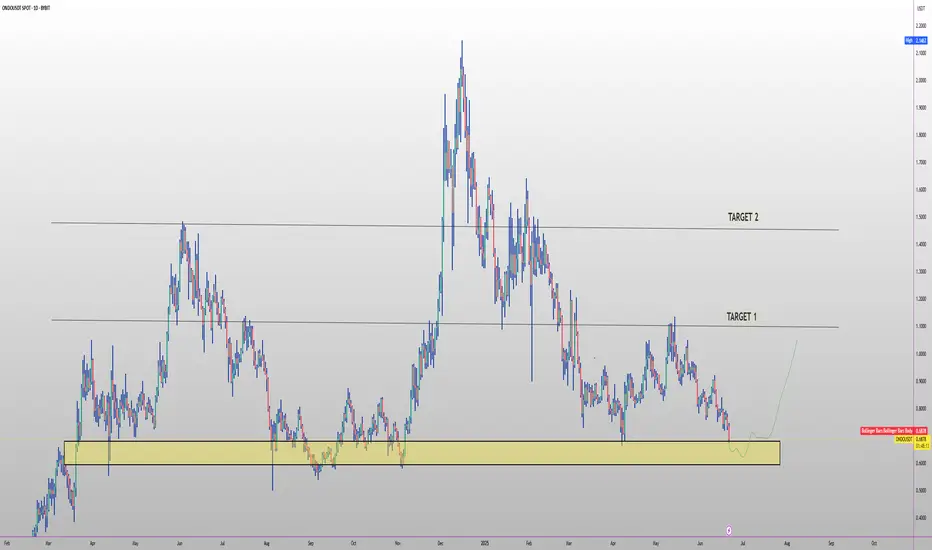
ONDO LONG FOR 2H 2025🔥 LSE:ONDO long setup (1D) 🚀
✅ Entry Zone: $0.62 – $0.685 (year-to-date demand)
🎯 Targets
• TP-1: $1.30 (post-IPO mid-range)
• TP-2: $1.70 (liquidity vacuum test)
⛔ Stop-Loss
Daily close < $0.54
📊 Thesis
• $95 M OUSG now settles via BlackRock’s BUIDL 🏦
• USDY hit $350 M TVL & 7 chains in 12
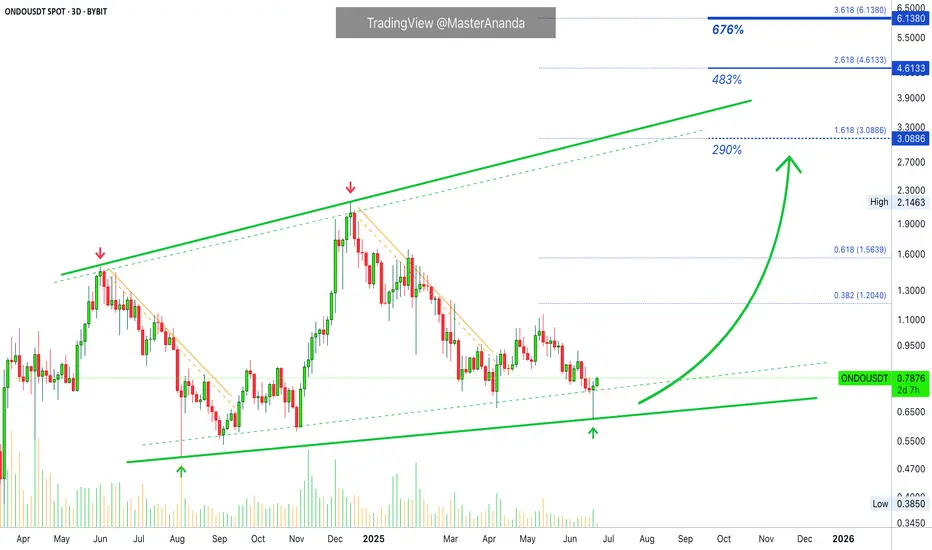
Ondo Finance: 290%, 483% & 676% Summer & FallBullish momentum right now is building up so fast that I can hardly share a chart before prices are up 5 to 10%. If you try to buy, prices can runaway from you specially when using leverage. That's what I mean when I say that the bottom, bottom prices, will only last a few days at max. The time is n
ONDOUSDT – POTENTIAL BREAKOUT TRADE SETUP!Hey Traders — if you're into high-conviction setups with real momentum, this one’s for you.
ONDO is trading inside a falling wedge on the daily chart — a classic bullish structure that often leads to explosive breakouts. 📈
Accumulation Zone: Price is currently sitting inside the green support box,
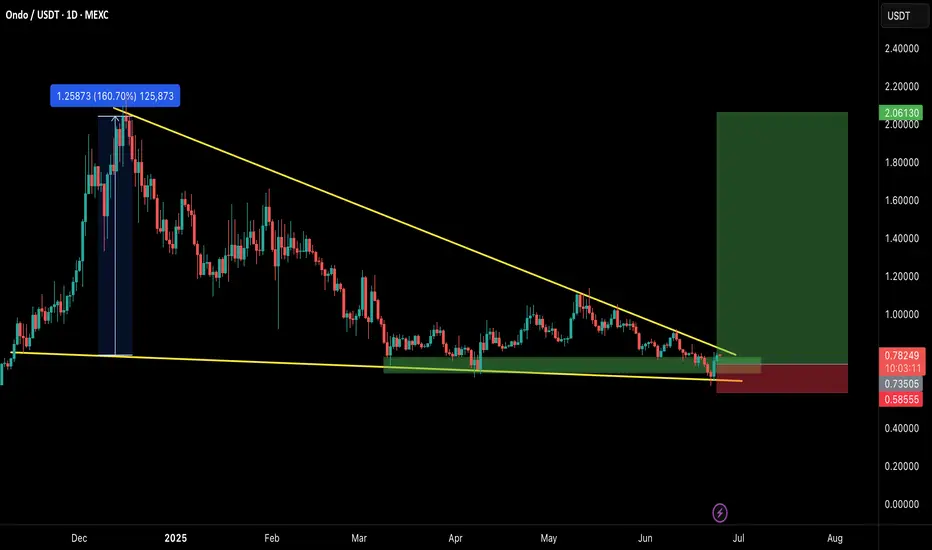
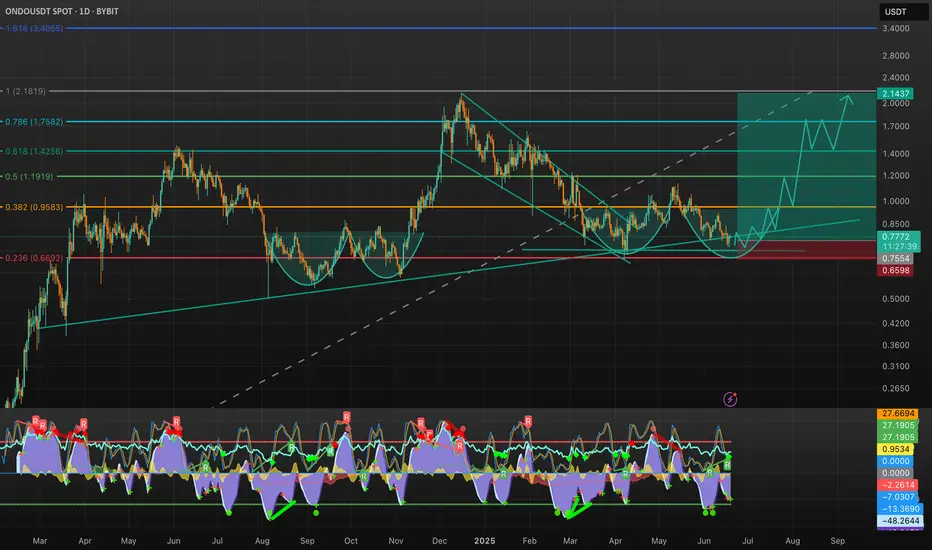
ONDO | Potential Long Setup | Technical Structure + MarketCipherThe chart speaks clearly:
✅ Falling wedge breakout supported by higher lows
✅ A potential cup-and-handle continuation forming
✅ Bullish divergence on Market Cipher B, signaling momentum reversal
🔍 Trade Setup Details:
Entry Zone: 0.76 – 0.78
Stop Loss: Daily close below 0.66
Target Area: 2.14 – 2.
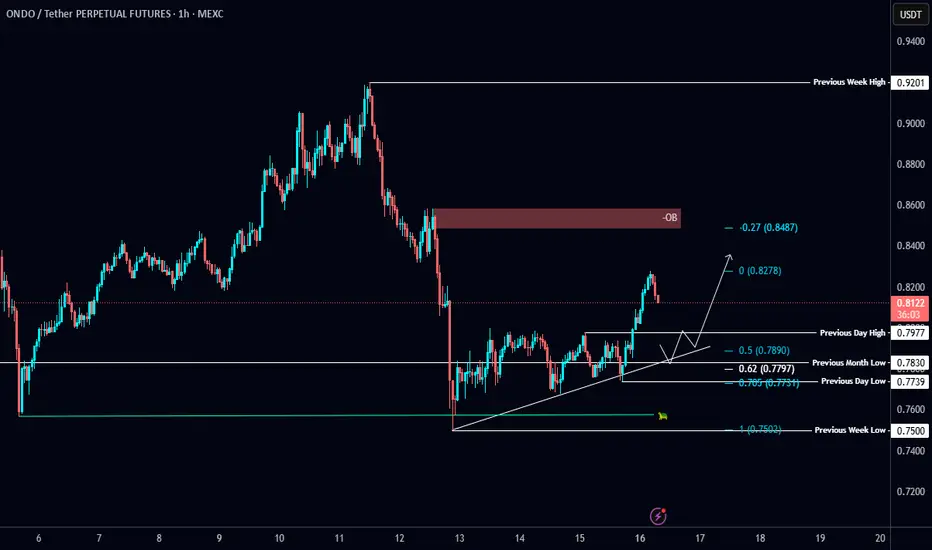
$ONDO/USDT Analysis📊 $ONDO/USDT Analysis 📊
📉 #ONDO swept the SSL and bounced strongly, reclaiming the PML 💪
🔹 Trendline support holding well — eyes on a retest for a potential long with confirmation🔍
Let price come to you. No rush, just precision🎯
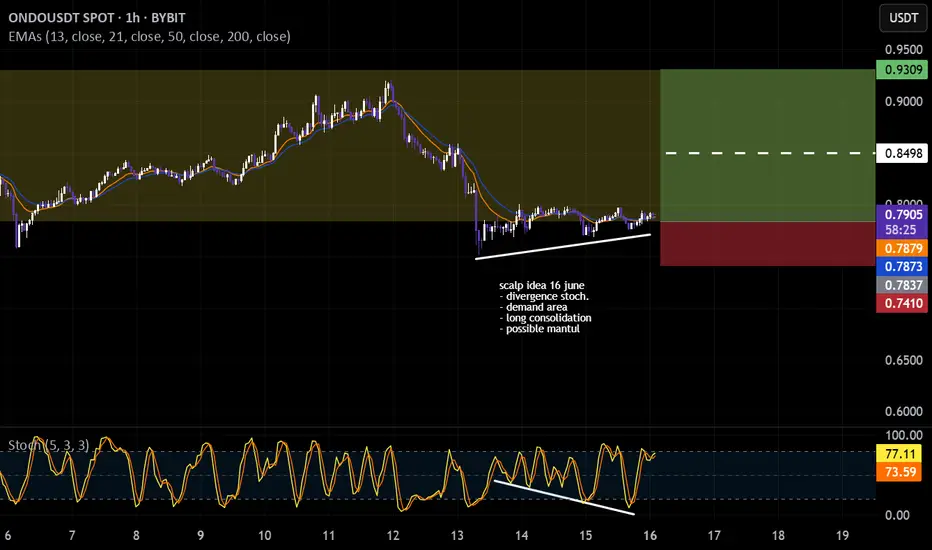
ONDO Scalp ideascalp idea 16 june
- divergence stoch.
- demand area
- long consolidation
- possible bouncing in this area

See all ideas
Summarizing what the indicators are suggesting.
Oscillators
Neutral
SellBuy
Strong sellStrong buy
Strong sellSellNeutralBuyStrong buy
Oscillators
Neutral
SellBuy
Strong sellStrong buy
Strong sellSellNeutralBuyStrong buy
Summary
Neutral
SellBuy
Strong sellStrong buy
Strong sellSellNeutralBuyStrong buy
Summary
Neutral
SellBuy
Strong sellStrong buy
Strong sellSellNeutralBuyStrong buy
Summary
Neutral
SellBuy
Strong sellStrong buy
Strong sellSellNeutralBuyStrong buy
Moving Averages
Neutral
SellBuy
Strong sellStrong buy
Strong sellSellNeutralBuyStrong buy
Moving Averages
Neutral
SellBuy
Strong sellStrong buy
Strong sellSellNeutralBuyStrong buy
Displays a symbol's price movements over previous years to identify recurring trends.