ONEUSDT 5D AnalysisONE ~ 5D Analysis
#ONE Buy back gradually from here if you still have confidence in this coin with a short term target of at least 20%+ from this support.
ONEUSDT trade ideas

oneusdtoneusdt might have completed accumulation and we might come to lows more one time before blast .it usually comes for test and then makes higher high and higher lows .

#ONE/USDT#ONE
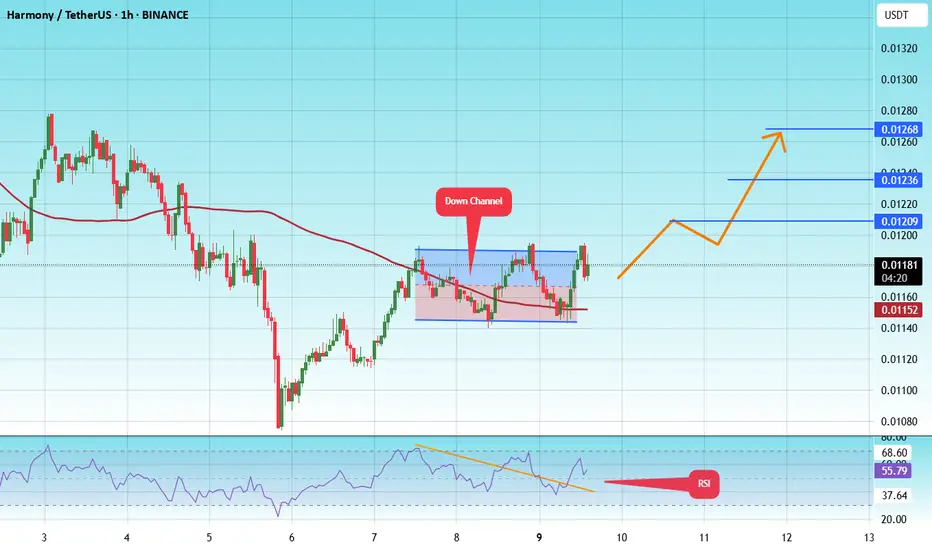
The price is moving within a descending channel on the 1-hour frame and is expected to break and continue upward.
We have a trend to stabilize above the 100 moving average once again.
We have a downtrend on the RSI indicator that supports the upward move with a breakout.
We have a support area at the lower limit of the channel at 0.01147, acting as strong support from which the price can rebound.
Entry price: 0.01183
First target: 0.01210
Second target: 0.01236
Third target: 0.01268
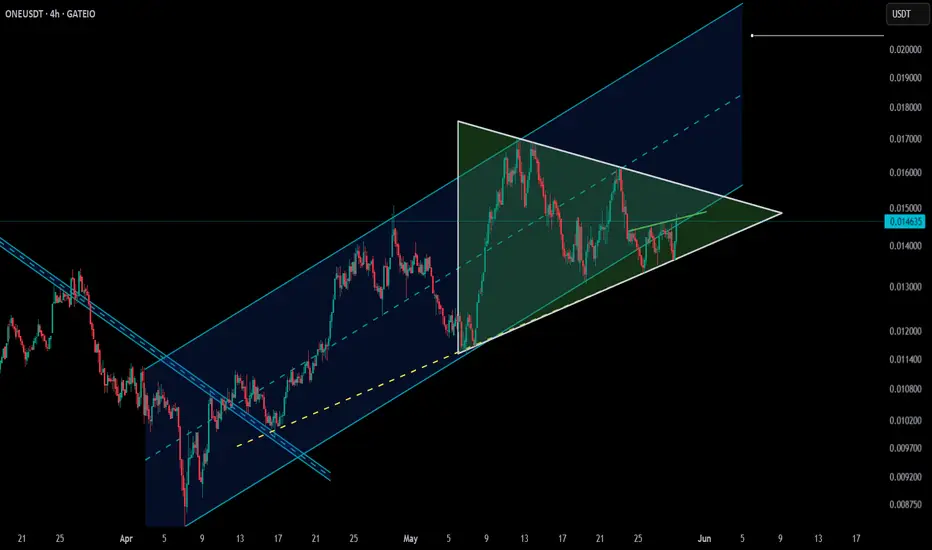
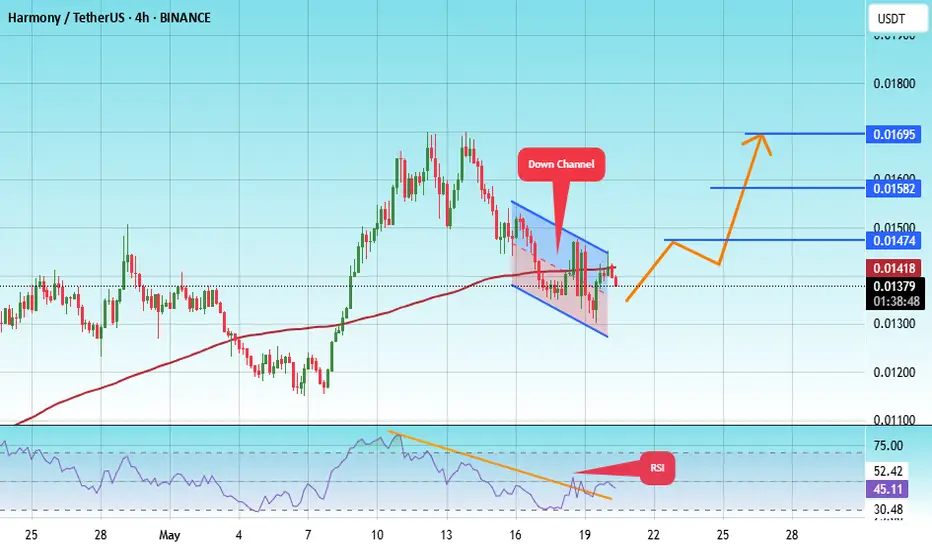
ONE – Key Structure Alignment Across Timeframes🔍 On the 1H chart, ONE is moving within a broadening channel — several rejections are keeping price contained for now 🌀
⏱ On the 4H timeframe, a symmetrical triangle is tightening up — indicating a possible volatility expansion soon 🔺
📈 On the higher timeframe, price is attempting to re-enter a larger ascending channel — reclaiming this range could mark a bullish shift.
⚠️ A breakout from the broadening channel might be the trigger for the next strong move — stay ready.
GATEIO:ONEUSDT
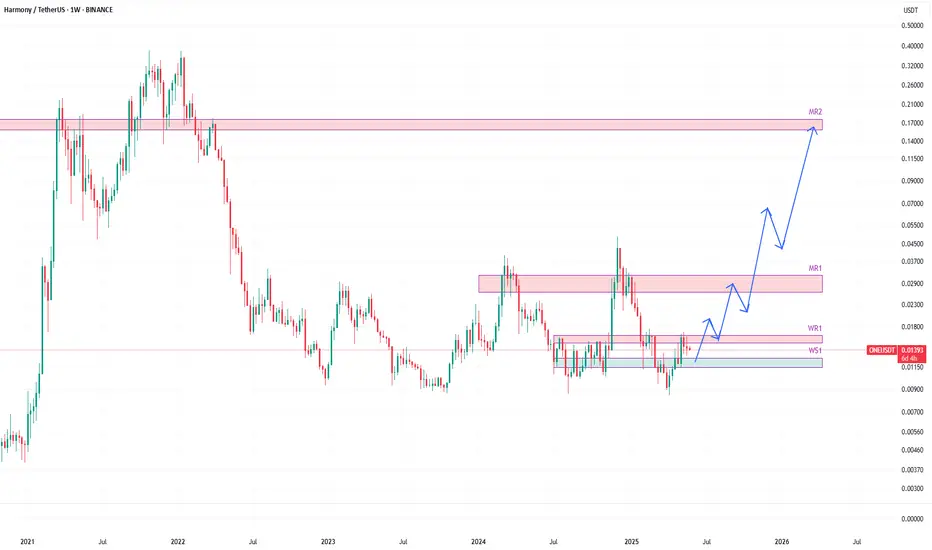
ONEUSDT likely to head towards 0.16 zoneONEUSDT is another one trading between weekly resistance WR1 and weekly support WS1.
The price has been retracing back to WS1 after hitting WR1. It is likely to hit WS1 before having a bounce.
WS1 is likely to provide a good bounce and the fuel for its upward journey in coming weeks and months.
The future of this one looks quite promising.
The price is likely to break WR1 on the next bounce from WS1 and likely to continue its journey towards monthly resistance MR1.
With some pullbacks here and there on various resistance milestones, the price is likely to aim for monthly resistance MR2.
ONEUSDT 1D AnalysisONE ~ 1D Analysis
#ONE Buy gradually from here with a short-term target of at least 10%++ from here.
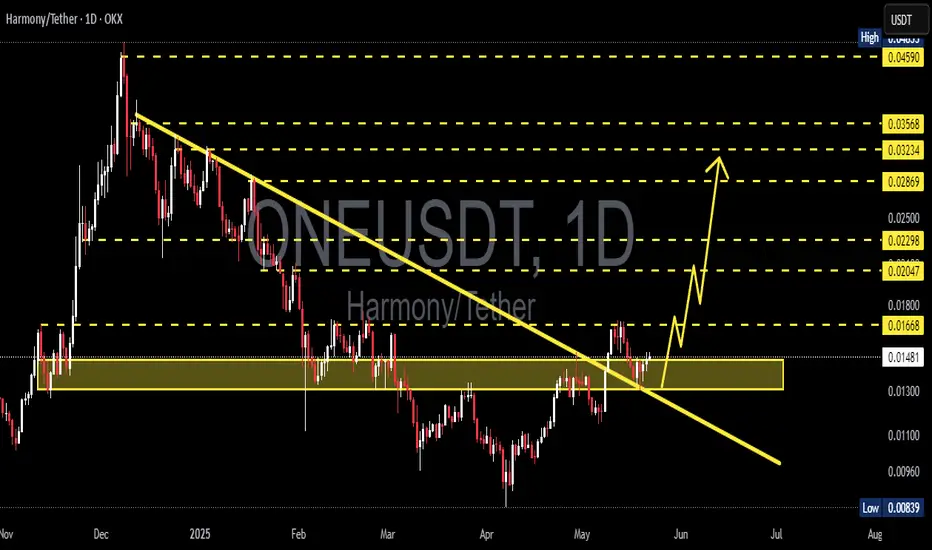
#ONE/USDT#ONE
The price is moving within a descending channel on the 1-hour frame, adhering well to it, and is on its way to breaking it strongly upwards and retesting it.
We are seeing a bounce from the lower boundary of the descending channel, this support at 0.01298.
We have a downtrend on the RSI indicator that is about to break and retest, supporting the upward trend.
We are looking for stability above the 100 moving average.
Entry price: 0.01380
First target: 0.01474
Second target: 0.01582
Third target: 0.01695
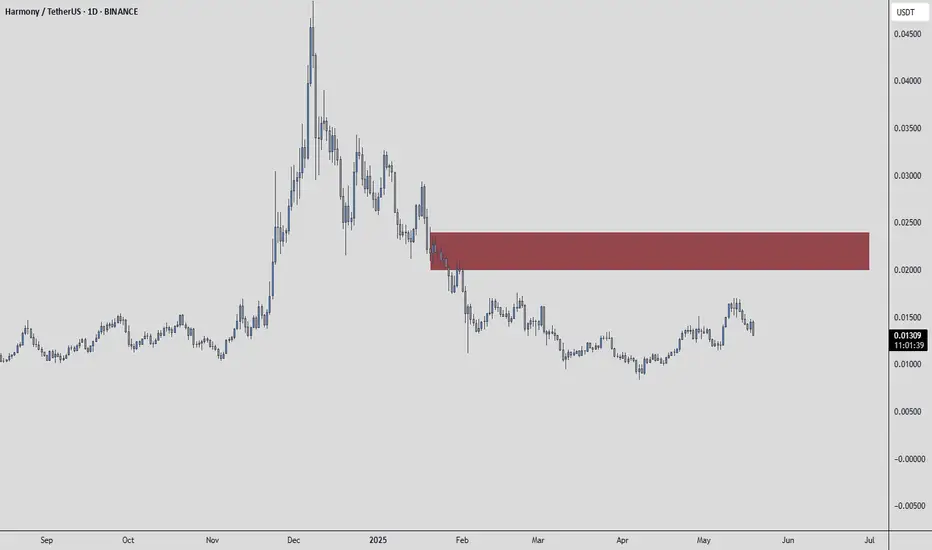
ONEUSDT | Major Resistance Ahead at the Deep Red BoxI’ve shaded the red box extra dark because it really is a formidable barrier. Historically, price has stalled and reversed here, so if ONEUSDT manages to break through this zone, it could fuel a strong move higher. Until then, caution is essential.
Key Points to Watch
Red Box = Heavy Resistance
Sellers have been lining up in this area. Any rally into this zone could be met with aggressive selling pressure.
Confirmation Needed
I’ll wait for clear signs of a breakout on lower time frames—ideally a clean close above the red box followed by a successful retest. CDV shifts and rising volume must support that move before I even consider going long.
Flexible Bias
I will not insist on my short idea. If price breaks up through the red box without giving a proper downward break first, I’ll drop the bearish view. If instead that breakout holds with volume and retests as support, I’ll flip bias and look for longs.
This is one of those rare levels where preparation and patience pay off. Let the market prove its strength or weakness here, then act with confidence. Remember that well‑managed risk and strict confirmation criteria are your best allies in navigating tough resistance zones.
📌I keep my charts clean and simple because I believe clarity leads to better decisions.
📌My approach is built on years of experience and a solid track record. I don’t claim to know it all but I’m confident in my ability to spot high-probability setups.
📌If you would like to learn how to use the heatmap, cumulative volume delta and volume footprint techniques that I use below to determine very accurate demand regions, you can send me a private message. I help anyone who wants it completely free of charge.
🔑I have a long list of my proven technique below:
🎯 ZENUSDT.P: Patience & Profitability | %230 Reaction from the Sniper Entry
🐶 DOGEUSDT.P: Next Move
🎨 RENDERUSDT.P: Opportunity of the Month
💎 ETHUSDT.P: Where to Retrace
🟢 BNBUSDT.P: Potential Surge
📊 BTC Dominance: Reaction Zone
🌊 WAVESUSDT.P: Demand Zone Potential
🟣 UNIUSDT.P: Long-Term Trade
🔵 XRPUSDT.P: Entry Zones
🔗 LINKUSDT.P: Follow The River
📈 BTCUSDT.P: Two Key Demand Zones
🟩 POLUSDT: Bullish Momentum
🌟 PENDLEUSDT.P: Where Opportunity Meets Precision
🔥 BTCUSDT.P: Liquidation of Highly Leveraged Longs
🌊 SOLUSDT.P: SOL's Dip - Your Opportunity
🐸 1000PEPEUSDT.P: Prime Bounce Zone Unlocked
🚀 ETHUSDT.P: Set to Explode - Don't Miss This Game Changer
🤖 IQUSDT: Smart Plan
⚡️ PONDUSDT: A Trade Not Taken Is Better Than a Losing One
💼 STMXUSDT: 2 Buying Areas
🐢 TURBOUSDT: Buy Zones and Buyer Presence
🌍 ICPUSDT.P: Massive Upside Potential | Check the Trade Update For Seeing Results
🟠 IDEXUSDT: Spot Buy Area | %26 Profit if You Trade with MSB
📌 USUALUSDT: Buyers Are Active + %70 Profit in Total
🌟 FORTHUSDT: Sniper Entry +%26 Reaction
🐳 QKCUSDT: Sniper Entry +%57 Reaction
📊 BTC.D: Retest of Key Area Highly Likely
📊 XNOUSDT %80 Reaction with a Simple Blue Box!
📊 BELUSDT Amazing %120 Reaction!
📊 Simple Red Box, Extraordinary Results
I stopped adding to the list because it's kinda tiring to add 5-10 charts in every move but you can check my profile and see that it goes on..
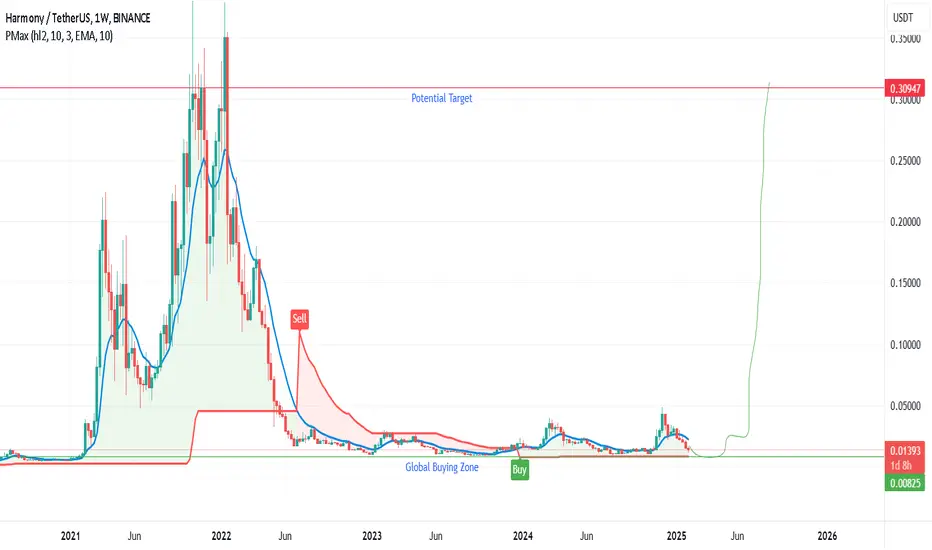
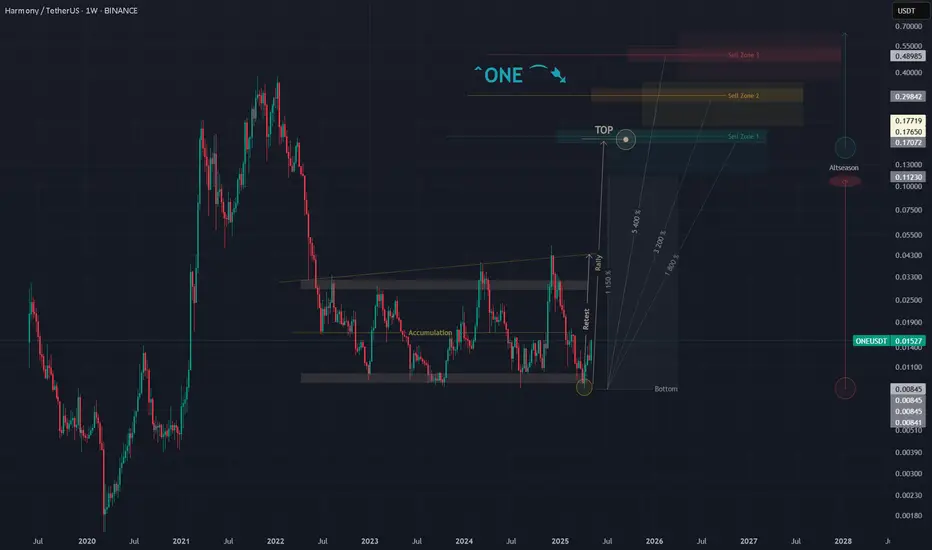
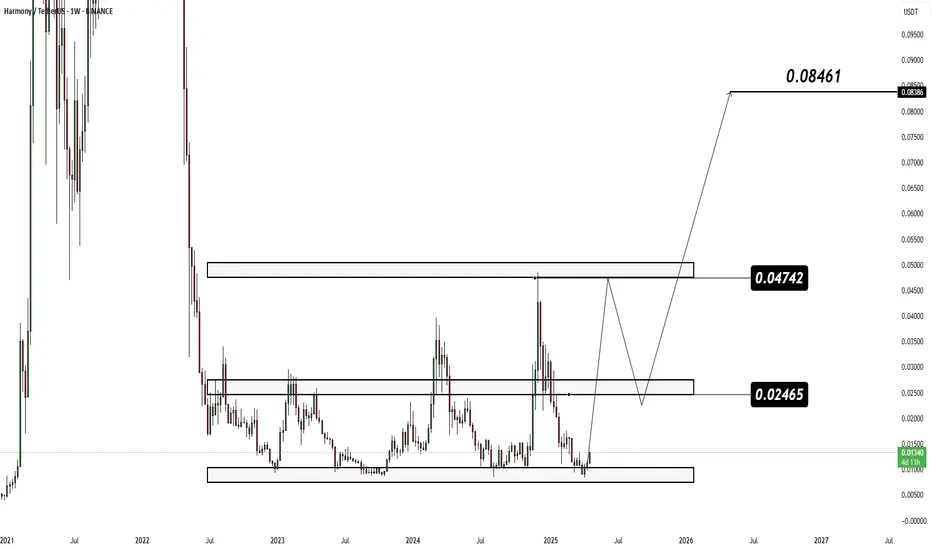
ONE/USDT 1W🌱 GETTEX:ONE ⁀➷
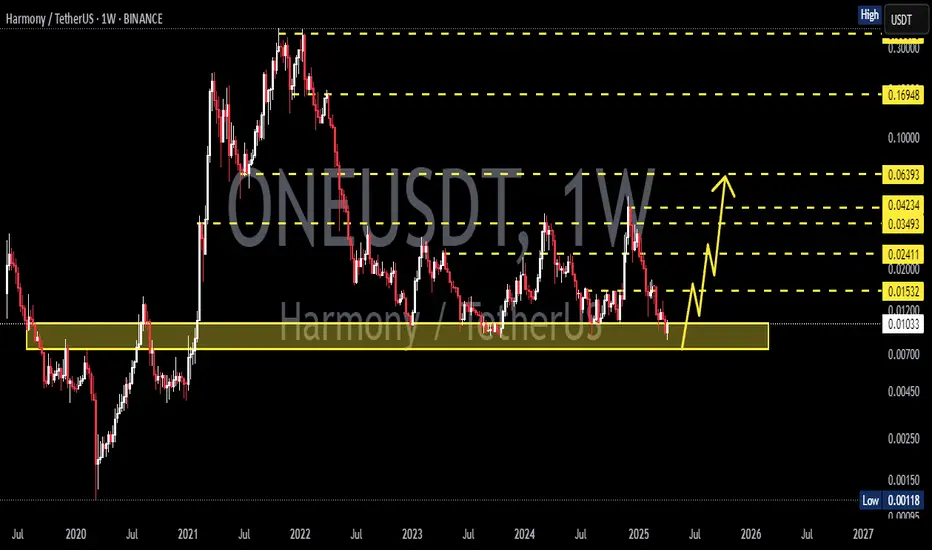
#Harmony. Macro chart Another
🌴 Intermediate Target - $0.112
🍃 Macro Target 1 - $0.170
🍃 Macro Target 2 - $0.298
🍃 Macro Target 3 - $0.489
- Not financial advice, trade with caution.
#Crypto #Harmony #ONE #Investment
✅ Stay updated on market news and developments that may influence the price of Harmony. Positive or negative news can significantly impact the cryptocurrency's value.
✅ Exercise patience and discipline when executing your trading plan. Avoid making impulsive decisions driven by emotions, and adhere to your strategy even during periods of market volatility.
✅ Remember that trading always involves risk, and there are no guarantees of profit. Conduct thorough research, analyze market conditions, and be prepared for various scenarios. Trade only with funds you can afford to lose and avoid excessive risk-taking.
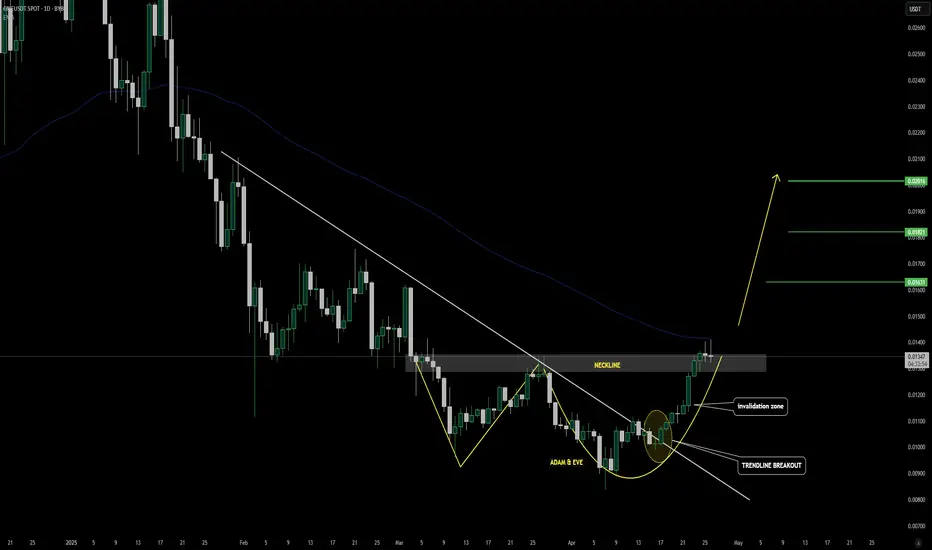
ONE/USDT – Adam & Eve Reversal Setup✅ Adam & Eve bottom formation confirmed with breakout.
✅ Major trendline breakout supported by strong bullish momentum.
✅ Neckline retest currently in progress — key support for continuation.
🎯 Targets: TP1: $0.0163
TP2: $0.0182
TP3: $0.0200
📌 Key Levels:
100 EMA overhead — next significant resistance area.
Invalidation below $0.0115 — Adam & Eve breakout failure.
High-probability setup with favorable risk-reward if neckline holds.
#ONEUSDT #CryptoAnalysis #ChartPatterns #TradingViewAnalysis #Altcoins #BullishBreakout #TrendlineBreakout #AdamAndEve #ReversalPattern
#ONE/USDT#ONE
The price is moving within a descending channel on the 1-hour frame and is expected to continue lower.
We have a trend to stabilize below the 100 moving average once again.
We have a downtrend on the RSI indicator, supporting the upward move with a breakout.
We have a resistance area at the upper limit of the channel at 0.01142.
Entry price: 0.01120
First target: 0.01091
Second target: 0.01057
Third target: 0.01006

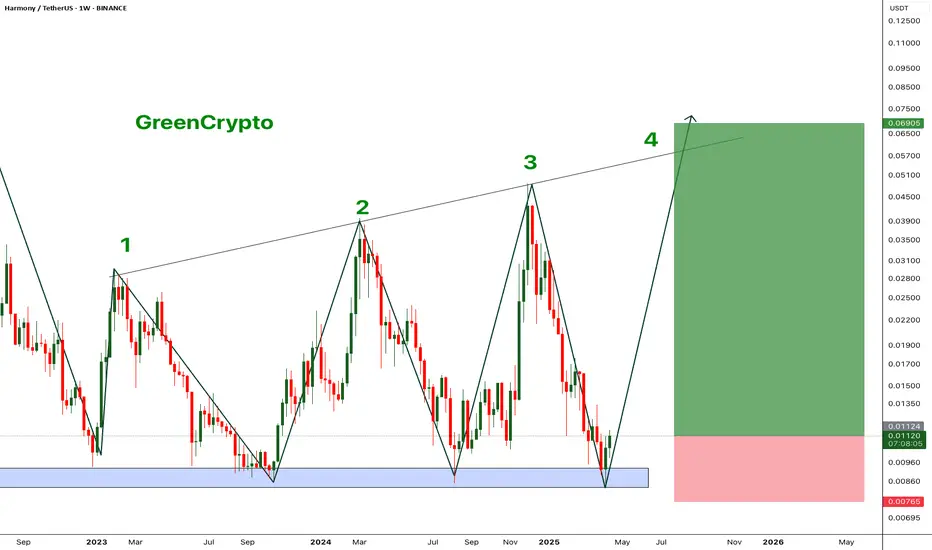
ONE/USDT - Harmoney - 4th Uptrend is just startingBINANCE:ONEUSDT (1W CHART) Technical Analysis Update
ONE is currently trading at $0.01121 and showing overall bullish sentiment
if we look at the past chart, we see ranging market for ONE from past 2 years, the price has hit the accumulation zone and reversing from the zone.
In the past 3 times we saw significant increase in price after hitting the support zone, and we expecting similar move this time.
Entry level: $ 0.01121
Stop Loss Level: $ 0.00765
TakeProfit 1: $ 0.01368
TakeProfit 2: $ 0.01855
TakeProfit 3: $ 0.02727
TakeProfit 4: $ 0.03795
TakeProfit 5: $ 0.05691
Max Leverage: 2x
Position Size: 1% of capital
Remember to set your stop loss.
Follow our TradingView account for more technical analysis updates. | Like, share, and comment your thoughts.
Cheers
GreenCrypto
ONE is a simple coin
#ONE It touches the bottom & pumps off the one with no exception🔥
I think GETTEX:ONE is an awesome coin to buy for mid-term🚀 - Measure your risks though due to the market instability!
ONE/USDT- where is Harmony going?Harmony shows great pattern and channel conformity. Looks like the token is determined to rise and shine !
ONEUSDT 1WONE ~ 1W Analysis
#ONE Buy back from here if you still have a Conviction on this coin with a short -term target of at least 20%+.
Harmony (ONE) Breaks Out – Can Bulls Hold Support?Harmony (ONE) has successfully broken out of its descending channel, signaling a potential trend reversal. Now, the key focus is on the retest phase to confirm bullish momentum.
BINANCE:ONEUSDT Daily Update:
Price has moved above the descending trendline, breaking out of the bearish structure.
A successful retest and bounce could validate further upside continuation.
Holding above support is crucial—watch for confirmation to gauge the strength of this breakout!

ONEUSDT, We broke the Pattern and Now ...Hello everyone
According to the , the price movement was made downward triangle and now after the price broke the trendline we expect that the price and power of movement can back to the market and make it up, the target was shown on chart.
if you have any question or need help send us messages
Thank you
AA

Good DCA zone buy for HARMONY $ONEif this holds (i.e., 3D closes green, volume stays green and above average), this looks pretty bullish.
UniversOfSignals | ONE: Key Levels and Market AnalysisIn this analysis, I want to review ONE, the token of the Harmony project. Harmony is one of the layer-1 blockchain networks and is considered one of the older crypto projects.
✨ The token currently holds a market cap of $205 million, ranking 198th on CoinMarketCap.
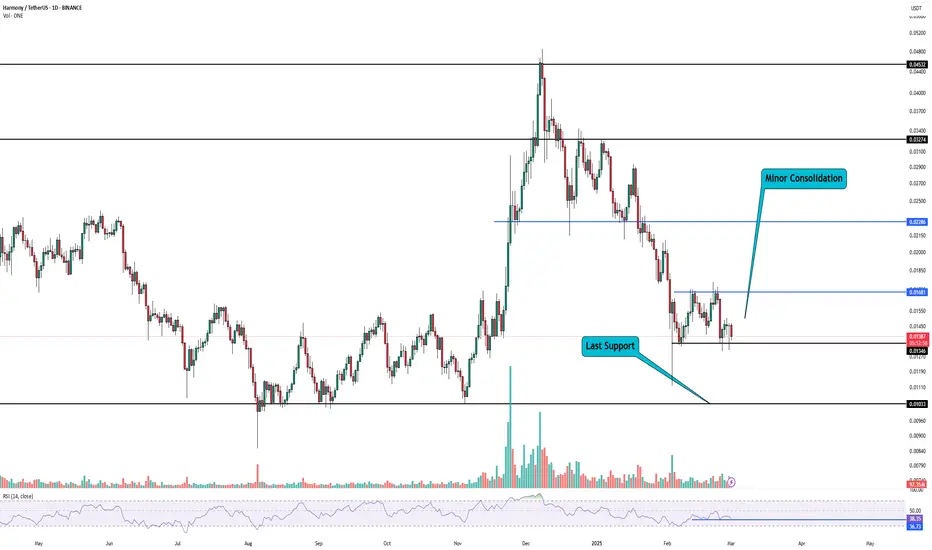
📅 Daily Timeframe
On the daily timeframe, as you can see, there is a large consolidation box between $0.01033 and $0.032724. In the last bullish leg, the price started from the $0.01033 low and moved up to the main resistance at $0.032724.
✅ It even broke above this level, reaching $0.04532, but was rejected and fell back into the range, turning this bullish move into a fake breakout.
⚡️ After returning to the range, the price first corrected to $0.02286. Once this level was broken, the next bearish leg pushed the price down to $0.01346. Currently, we are seeing a smaller consolidation box between $0.01346 and $0.01681.
🧩 Looking at the RSI oscillator, there is also a range between 37.05 and 50. A breakout in either direction could confirm the momentum for that direction. Naturally, a break below 37.05 would be a stronger confirmation for downside movement, as the market momentum is already bearish.
📊 If $0.01346 is broken, the price could move toward the bottom of the large range at 0.01033.If $0.01033 is broken, a new all-time low (ATL) is likely to be registered.
🔼 On the bullish side, if the $0.01346 support holds and the $0.01681 resistance is broken, we can expect the price to rally toward $0.02286 and possibly even $0.03274.
🛒 For spot buying, I prefer to wait until this coin shows strength against Bitcoin and Bitcoin dominance starts declining. My spot trigger is currently at $0.04532, and I will not enter a position before this level is broken.
⏳ 4-Hour Timeframe
On the 4-hour timeframe, the price remains within the same range as identified in the daily timeframe.
🔽 For a short position, if $0.01327 is broken, you can enter a short trade targeting the bottom of the range.
📈 For a high-risk long position, if $0.014825 is broken, you can target the top of the range, but this trade is very risky.The main long position will be confirmed if the price breaks above $0.01681.
🔑 Regarding indicators and oscillators, I don’t have much to say in this ranging market. Volume is also low, making it difficult to rely on momentum indicators in this sideways phase.
📝 Final Thoughts
This analysis reflects our opinions and is not financial advice.
Share your thoughts in the comments, and don’t forget to share this analysis with your friends! ❤️
TradeCityPro | ONE: Key Levels and Market Analysis👋 Welcome to TradeCity Pro!
In this analysis, I want to review ONE, the token of the Harmony project. Harmony is one of the layer-1 blockchain networks and is considered one of the older crypto projects.
✨ The token currently holds a market cap of $205 million, ranking 198th on CoinMarketCap.
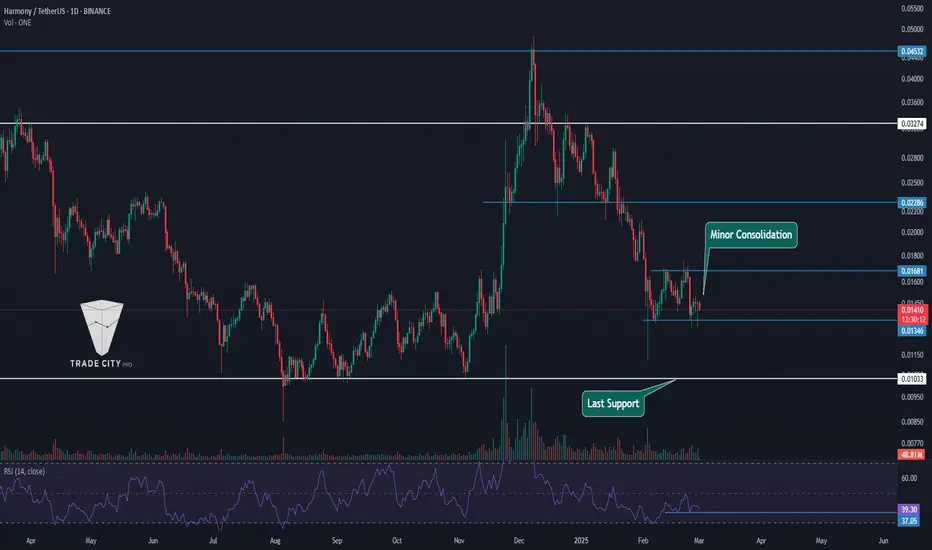
📅 Daily Timeframe
On the daily timeframe, as you can see, there is a large consolidation box between $0.01033 and $0.032724. In the last bullish leg, the price started from the $0.01033 low and moved up to the main resistance at $0.032724.
✅ It even broke above this level, reaching $0.04532, but was rejected and fell back into the range, turning this bullish move into a fake breakout.
⚡️ After returning to the range, the price first corrected to $0.02286. Once this level was broken, the next bearish leg pushed the price down to $0.01346. Currently, we are seeing a smaller consolidation box between $0.01346 and $0.01681.
🧩 Looking at the RSI oscillator, there is also a range between 37.05 and 50. A breakout in either direction could confirm the momentum for that direction. Naturally, a break below 37.05 would be a stronger confirmation for downside movement, as the market momentum is already bearish.
📊 If $0.01346 is broken, the price could move toward the bottom of the large range at $0.01033.If $0.01033 is broken, a new all-time low (ATL) is likely to be registered.
🔼 On the bullish side, if the $0.01346 support holds and the $0.01681 resistance is broken, we can expect the price to rally toward $0.02286 and possibly even $0.03274.
🛒 For spot buying, I prefer to wait until this coin shows strength against Bitcoin and Bitcoin dominance starts declining. My spot trigger is currently at $0.04532, and I will not enter a position before this level is broken.
⏳ 4-Hour Timeframe
On the 4-hour timeframe, the price remains within the same range as identified in the daily timeframe.
🔽 For a short position, if $0.01327 is broken, you can enter a short trade targeting the bottom of the range.
📈 For a high-risk long position, if $0.014825 is broken, you can target the top of the range, but this trade is very risky.The main long position will be confirmed if the price breaks above $0.01681.
🔑 Regarding indicators and oscillators, I don’t have much to say in this ranging market. Volume is also low, making it difficult to rely on momentum indicators in this sideways phase.
📝 Final Thoughts
This analysis reflects our opinions and is not financial advice.
Share your thoughts in the comments, and don’t forget to share this analysis with your friends! ❤️
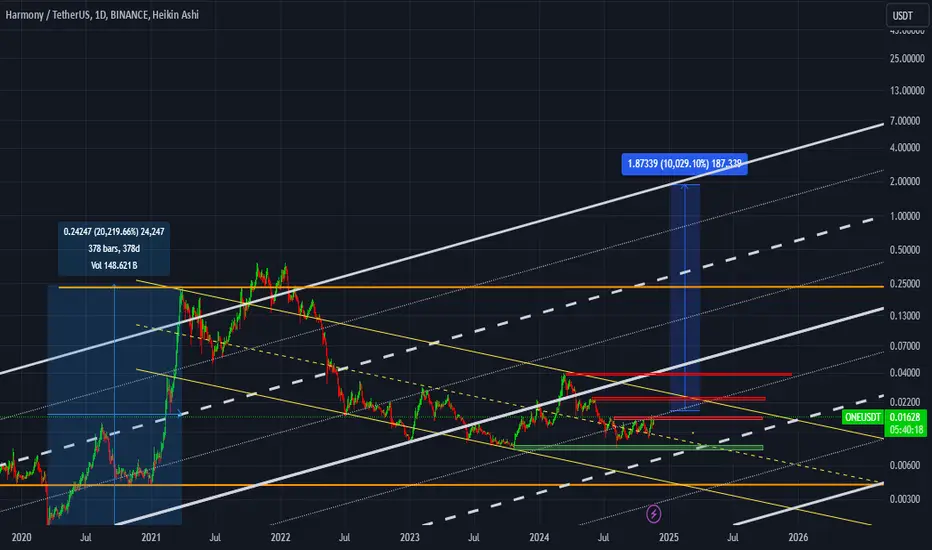
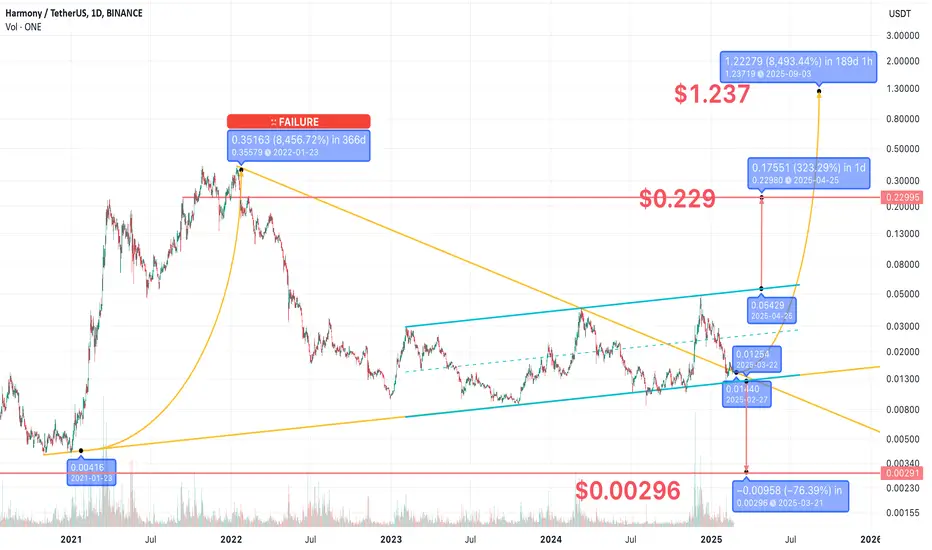
ONE Potential 84x Surge? (If Bull Comes)BINANCE:ONEUSDT seems to be retesting and holding above the upper trendline of a multi-year triangle breakout.
This makes it a potential long entry point.
It has also formed a two-year-long ascending channel since 2023.
🔥 Long Targets:
$0.229 (~15x from current price) –
This is the measured move of the ascending channel. The price also meet a strong resistance zone from previous highs, making it pretty good sense.
$1.237 (~84x from current price) – This is the full breakout target of the triangle, though it seems unlikely to be reached; However, this 84x was how high it surged last time.
If a bull run happens, a reasonable strategy would be to sell 50%-80% of the holdings at $0.229, keeping a small portion as "free ride" profit in case it extends to $1.237.
Some skeptics may think an 84x move is ridiculous, but keep in mind, although the altcoin season hasn’t even started yet, BINANCE:OMUSDT has already surged over 300x since last year.
If you think many things impossible, you’ll never make the big gains.
🔥 The key is to think big but execute strictly:
✅ Always set a stop-loss with buying order.
✅ Take profits at targets without hesitation.
This is how you maximize gains in crypto bull runs and protect capital in crashes.
-------
🔥 Short Target:
$0.00296 (~-79% from current price) – This is the measured move of the ascending channel breakdown.
A short entry should only be considered after a confirmed break below the channel.
🔴 Read my signature & publications for more info you don’t want to miss.
🔥 for more future "guesses" like this!
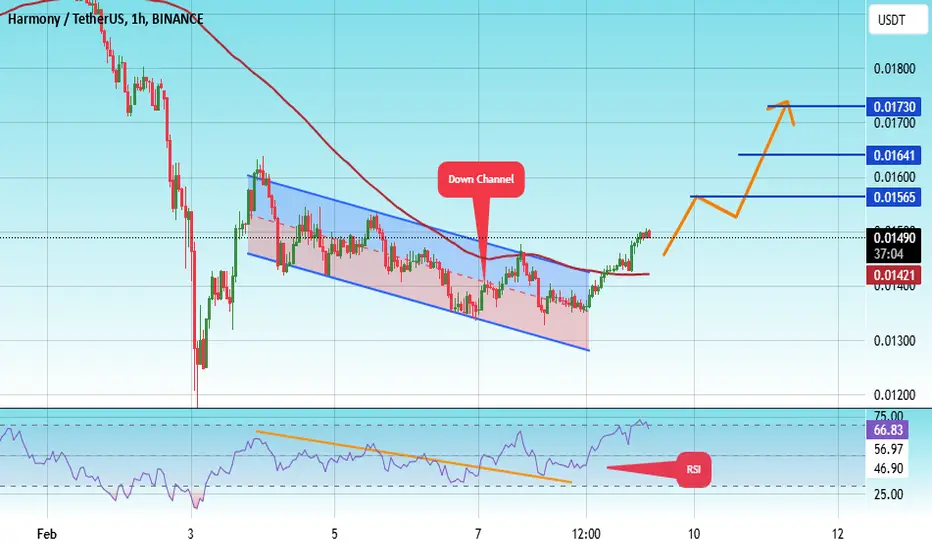
#ONE/USDT#ONE
The price is moving in a descending channel on the 1-hour frame and is adhering to it well and is heading to break it strongly upwards and retest it
We have a bounce from the lower limit of the descending channel, this support is at a price of 0.01300
We have a downtrend on the RSI indicator that is about to break and retest, which supports the rise
We have a trend to stabilize above the moving average 100
Entry price 0.01490
First target 0.01565
Second target 0.01641
Third target 0.01730
HARMONY(ONE) POTENTIAL TARGETHarmony is a blockchain platform designed to facilitate the creation and use of decentralized applications (DApps). The network aims to innovate the way decentralized applications work by focusing on random state sharding, which allows creating blocks in seconds.