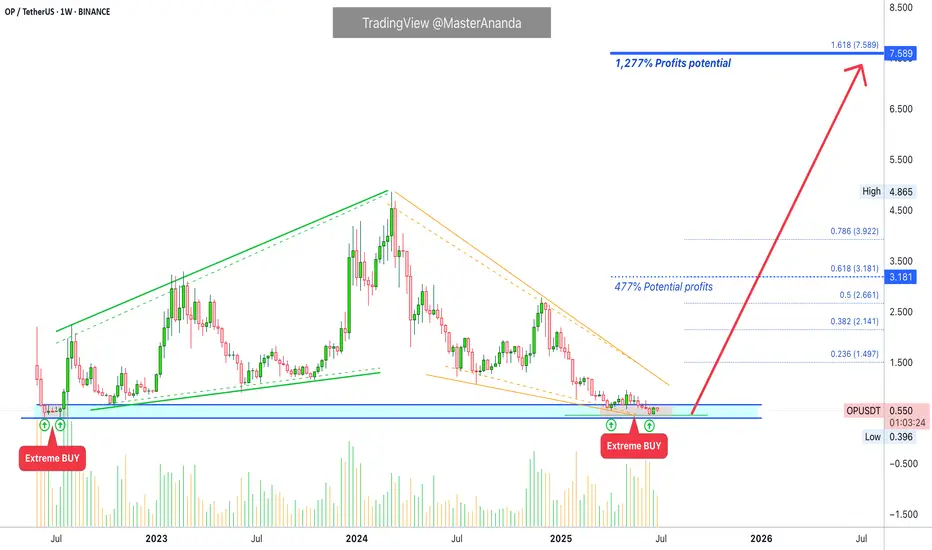
Optimism Extreme BUY: Easy 1277% Profits Potential—Can Go HigherOptimism is now moving within a "extreme BUY" zone. This is a price zone that was active only once between June and July 2022, one month only and then OPUSDT went on a massive rally. Total growth amounting to more than 1,111% from bottom to top.
This zone has been activated again for a little over
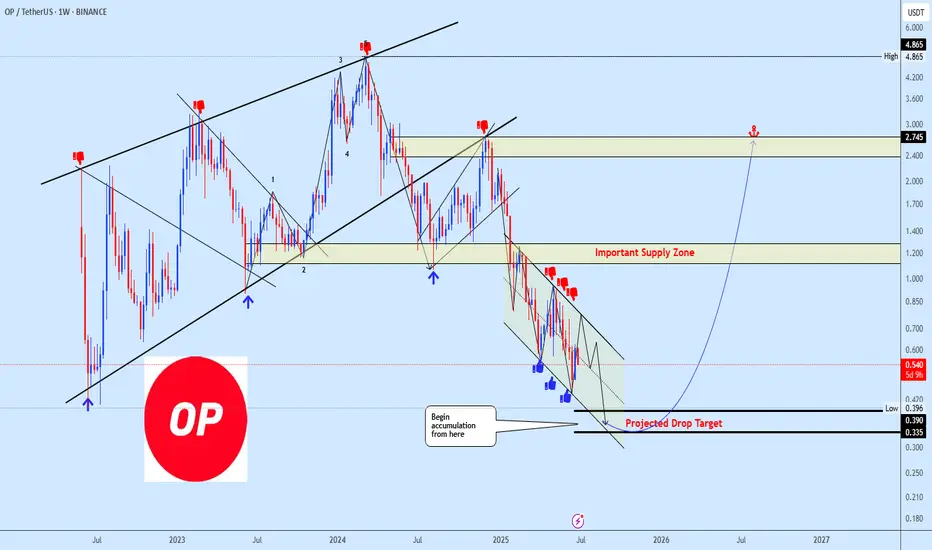
OPUSDT Maintains Bearish MomentumOPUSDT continues its decline following the breakdown from a massive rising wedge. After a clean corrective pullback, price formed a bearish continuation structure, which has now broken into a descending channel guiding the current move.
The chart suggests further downside toward the projected drop
OPUSDT Forming Descending ChannelOPUSDT is showing an impressive technical setup that has caught the attention of many crypto traders recently. The chart reflects a well-formed descending channel, which is a classic bullish reversal pattern when broken to the upside. Currently, the price action is testing the upper boundary of this

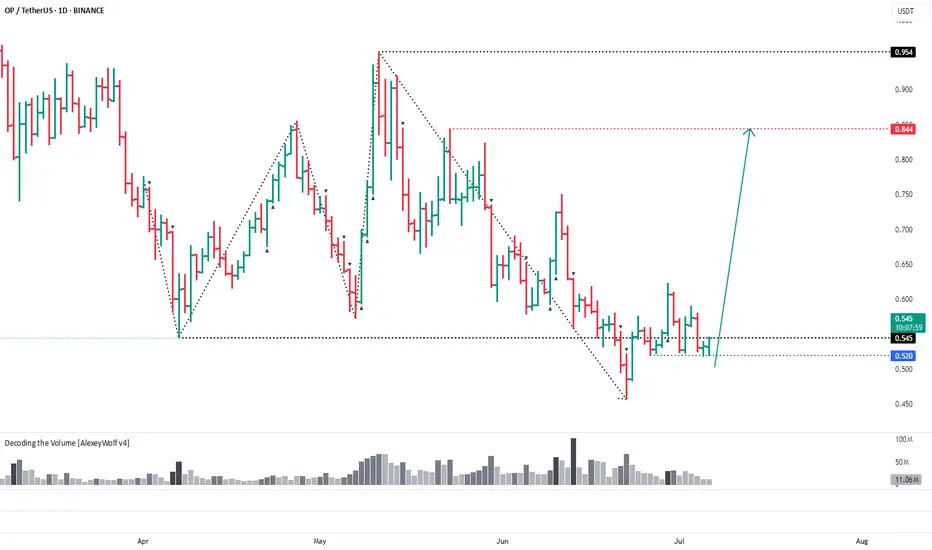
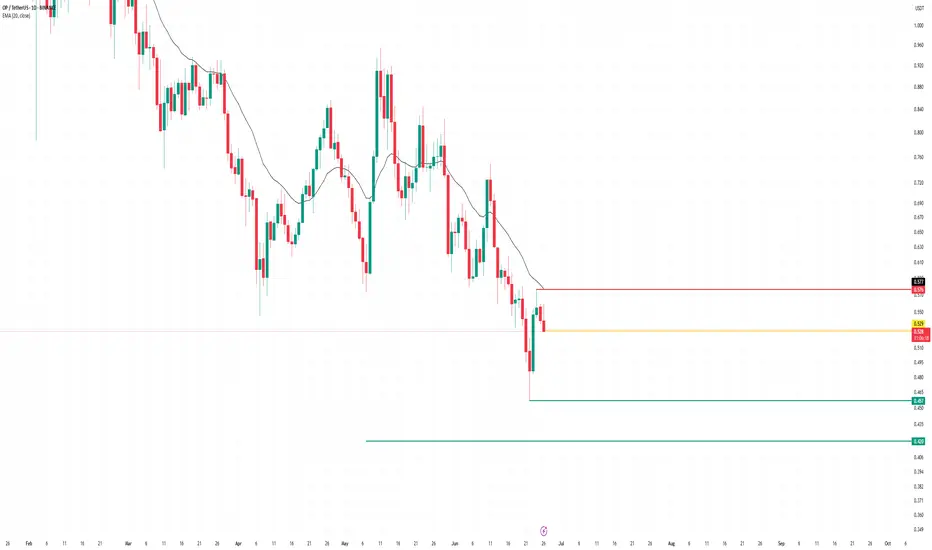
OPUSDT: Buyers try to regain control inside the rangeHi traders and investors!
On the daily timeframe, OPUSDT is trading in a sideways range. The price has repeatedly dipped below the lower boundary at 0.545, but each time, buyers managed to bring it back.
Now, we’re seeing another attempt to return into the consolidation zone — a possible sign of r
OP 5$ SOONOptimism
Optimism is an EVM-compatible optimistic rollup blockchain platform built on top of Ethereum.
We note that the currency has been undergoing a deep correction for a long time due to the ongoing downward pressure and market negativity.
Note that the currency made a strong rebound after a f
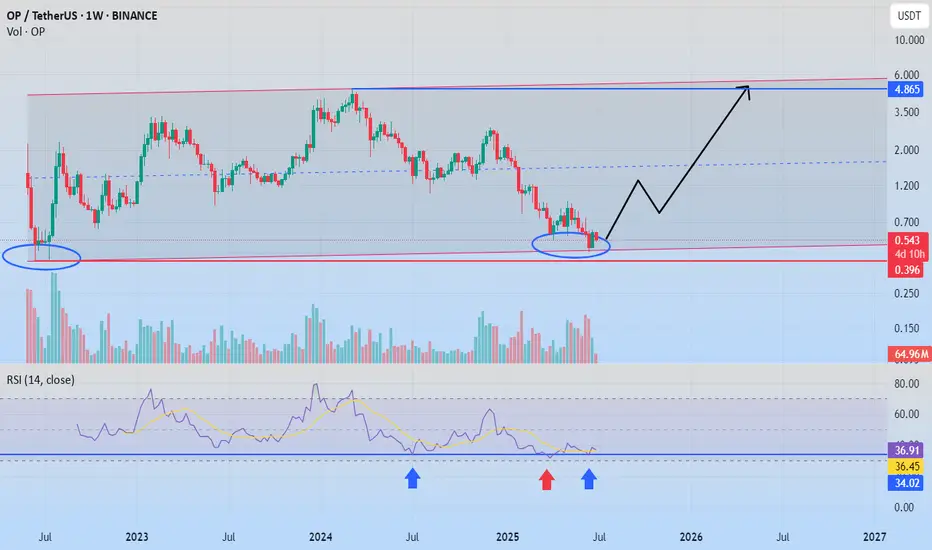
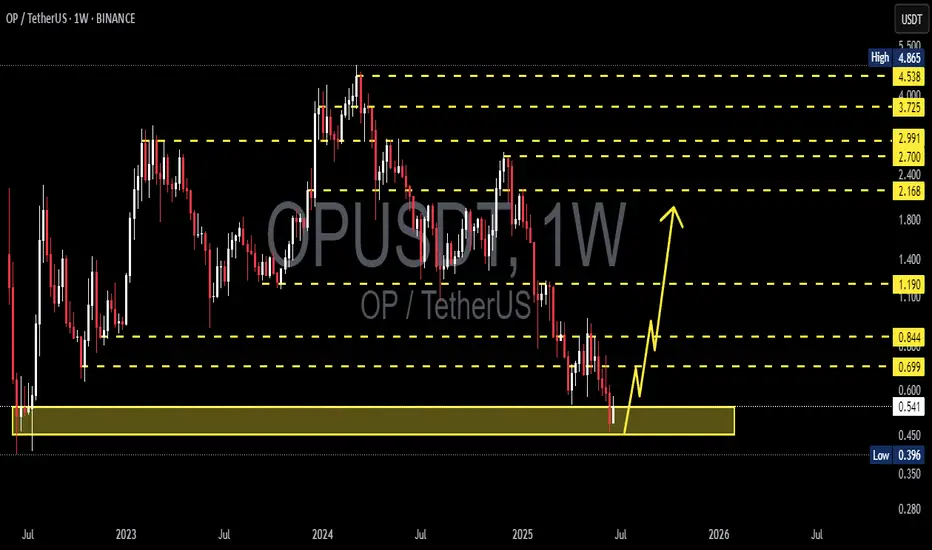
OP/USDT Weekly Reversal Zone: Strong Bounce ExpectedThe OP/USDT pair is currently showing strong signs of a potential trend reversal from a major long-term demand zone.
📊 Timeframe: 1W (Weekly)
🟨 Key Support Zone: 0.396 – 0.542 USDT
The price has revisited a historically strong support area that previously served as an accumulation zone since mid-20
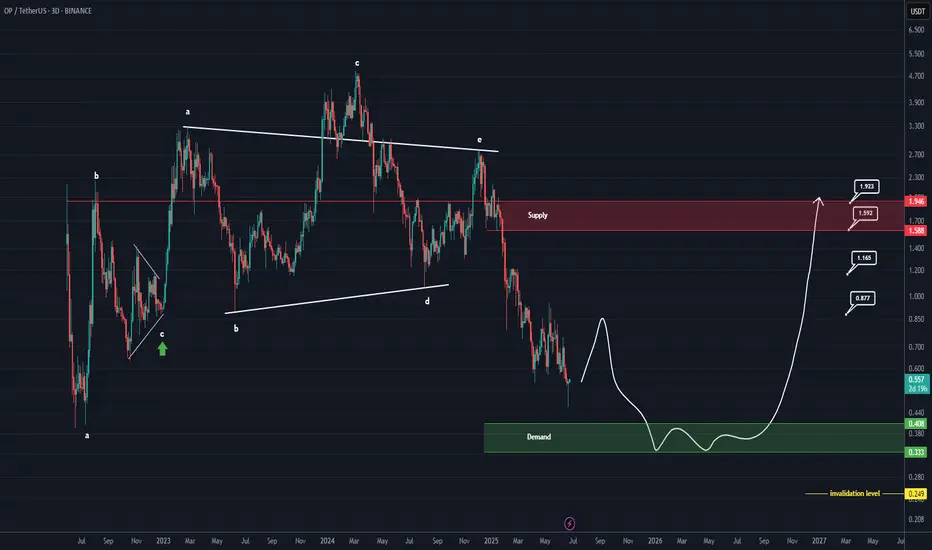
OP Roadmap (3D)The OP token has entered a bearish phase after completing a triangle pattern. We are currently in this bearish phase.
Such large bearish phases typically require a sweep of liquidity from key levels before ending. It appears that OP, after sweeping the liquidity below support levels, may reverse an
OP TARGETS FOR Q2 2025🔥 NASDAQ:OP long setup (1D) 🚀
✅ Entry Zone: $0.46 – $0.506 (descending-channel base)
🎯 Targets
• TP-1: $1.55 (Nov-23 supply flip)
• TP-2: $1.80 (201-day breakdown block)
⛔ Stop-Loss
Daily close < $0.42
📊 Thesis
• Superchain mainnet ties OP, Base, Mode & Fraxtal together Q4-25
• Bedrock upgra

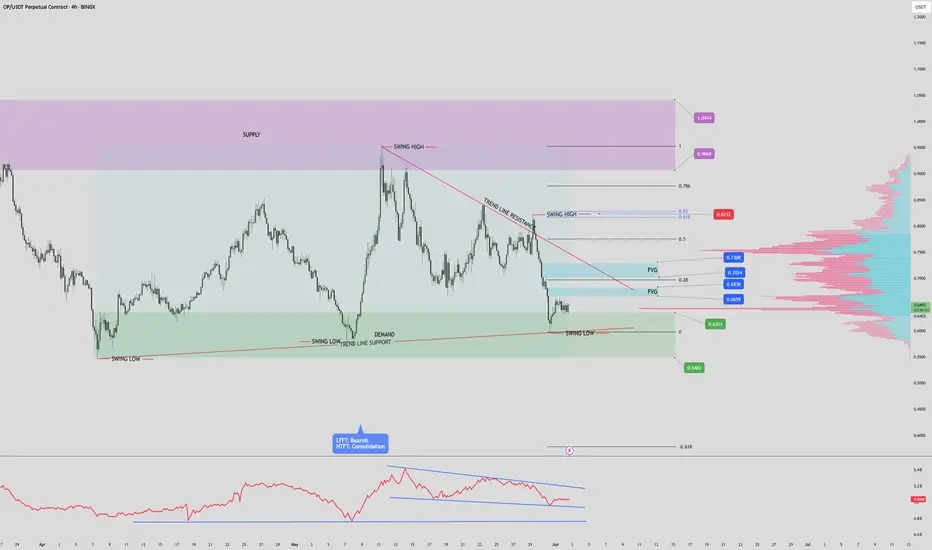
OP / USDT 4hr PUMP INCOMING? OP/USDT – 4H Chart Summary
Market Structure:
4H Timeframe:
- Price consolidating within a descending triangle/wedge pattern, indicating potential buildup before a breakout.
- Lower Timeframes (1H and below): Bearish trend structure with lower highs and lows.
- OBV (On-Balance Volume): Forming
See all ideas
Summarizing what the indicators are suggesting.
Oscillators
Neutral
SellBuy
Strong sellStrong buy
Strong sellSellNeutralBuyStrong buy
Oscillators
Neutral
SellBuy
Strong sellStrong buy
Strong sellSellNeutralBuyStrong buy
Summary
Neutral
SellBuy
Strong sellStrong buy
Strong sellSellNeutralBuyStrong buy
Summary
Neutral
SellBuy
Strong sellStrong buy
Strong sellSellNeutralBuyStrong buy
Summary
Neutral
SellBuy
Strong sellStrong buy
Strong sellSellNeutralBuyStrong buy
Moving Averages
Neutral
SellBuy
Strong sellStrong buy
Strong sellSellNeutralBuyStrong buy
Moving Averages
Neutral
SellBuy
Strong sellStrong buy
Strong sellSellNeutralBuyStrong buy
Displays a symbol's price movements over previous years to identify recurring trends.