OP TARGETS FOR Q2 2025🔥 NASDAQ:OP long setup (1D) 🚀
✅ Entry Zone: $0.46 – $0.506 (descending-channel base)
🎯 Targets
• TP-1: $1.55 (Nov-23 supply flip)
• TP-2: $1.80 (201-day breakdown block)
⛔ Stop-Loss
Daily close < $0.42
📊 Thesis
• Superchain mainnet ties OP, Base, Mode & Fraxtal together Q4-25
• Bedrock upgrade already cut L2 gas ~40 % & sped deposits 9×
• Worldcoin + 30 M wallets moved to OP Mainnet
• Retro Funding 5 injects $100 M into OP-Stack builders
• Emission schedule halves in Aug-25; float tightens each month after
• Sequencer-revenue share & Superchain fees stream back to stakers
• Mode, Fraxtal & dozens of L3s funnel new users into the OP economy
OPUSDT.P trade ideas

#OP/USDT#OP
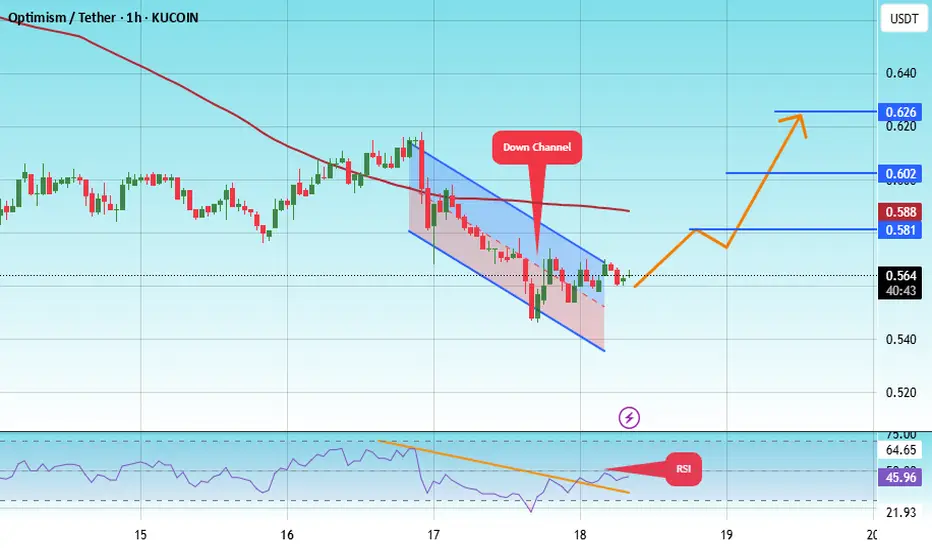
The price is moving within a descending channel on the 1-hour frame, adhering well to it, and is heading toward a strong breakout and retest.
We are experiencing a rebound from the lower boundary of the descending channel. This support is at 0.544.
We have a downtrend on the RSI indicator that is about to be broken and retested, supporting the upward trend.
We are heading toward stability above the 100 moving average.
Entry price: 0.564
First target: 0.581
Second target: 0.602
Third target: 0.626
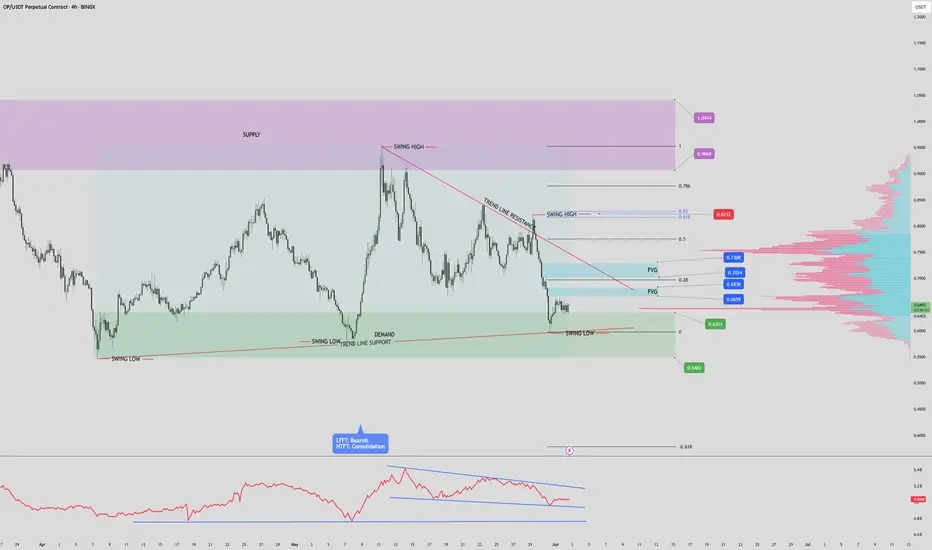
OP / USDT 4hr PUMP INCOMING? OP/USDT – 4H Chart Summary
Market Structure:
4H Timeframe:
- Price consolidating within a descending triangle/wedge pattern, indicating potential buildup before a breakout.
- Lower Timeframes (1H and below): Bearish trend structure with lower highs and lows.
- OBV (On-Balance Volume): Forming a wedge—suggesting accumulation or distribution phase nearing a breakout.
Key Zones:
Demand Zone (Support):
- 0.5483 – 0.6351
This area has provided strong support historically. A clean break below could signal continuation of the larger downtrend.
Supply Zone (Resistance):
- 0.9068 – 1.0414
-Historically rejected price; high probability of reversal or consolidation if revisited.
Fair Value Gaps (FVG):
- FVG 1: 0.6659 – 0.6838
- FVG 2: 0.7024 – 0.7308
These inefficiency zones are likely to attract price if bullish momentum builds. Watch for potential short-term rejection or continuation setups here.
Volume Profile:
Strongest volume node (high liquidity zone) sits between 0.7470 – 0.8000
Suggests this area has been heavily traded and may act as magnet/resistance if approached again.
Fibonacci Confluence:
Previous swing high at 0.8232 aligns with the 0.618–0.65 golden pocket
A critical zone for potential take-profit or trend reversal on a breakout.
Scenarios:
Bullish Case:
If price holds above 0.6351 and bounces, look for:
- Retest of FVG 1, followed by FVG 2.
- Breakthrough of 0.7308 could target the golden pocket and swing high at 0.8232.
- Sustained bullish move may reach the supply zone above 0.9068.
Bearish Case:
- Breakdown below 0.6351 and especially below 0.5483 would:
- Invalidate the wedge support.
- Confirm continuation of the macro downtrend.
-Open room for new lows and bearish expansion.
Conclusion:
Price is at a key decision point inside a wedge.
Reaction at 0.6351 is critical—support bounce targets higher inefficiencies; breakdown signals deeper bearish continuation.
OBV and volume structure suggest an imminent volatility spike—prepare for a breakout.
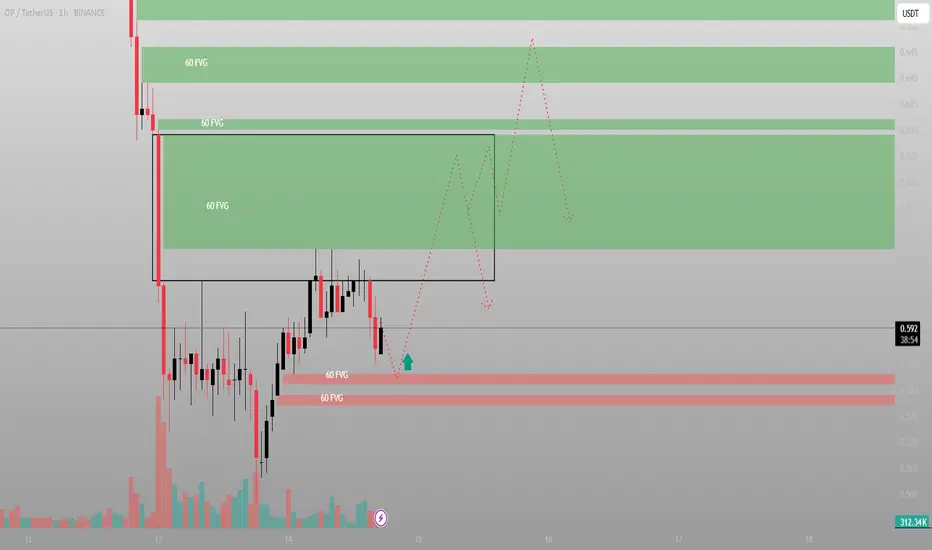
Everyone saw the drop. I saw the gapPrice nuked — but it didn’t break structure. It filled imbalance, paused, and now it's reloading beneath a stack of untouched FVGs. This isn't capitulation. It's orchestration.
The setup:
We’ve got layered 60-minute FVGs stacked from 0.61 to 0.66. That’s the destination — not the mystery. What matters is the origin. The rejection block around 0.58–0.59 has held clean, and we now have two bullish rejection wicks off that base.
Volume surged during the sweep — and fell on the retrace. That’s not distribution. That’s Smart Money filling.
Two entries — one outcome:
Entry 1: Tap into the red demand zone, wick the 0.58–0.579 region
Entry 2: Break and retest above minor FVG (0.60 reclaim confirmation)
Either way, the draw is the inefficiency stack above.
Execution Map:
Long from 0.579–0.583
SL: Below the base at 0.574
TP1: 0.615 (lower FVG)
TP2: 0.645 (full sweep)
Final: 0.660 liquidity run
Don’t fear the compression. That’s where the trap is set.
Final thought:
“Most traders fear price going sideways. I see it as silence before the algorithm speaks.”
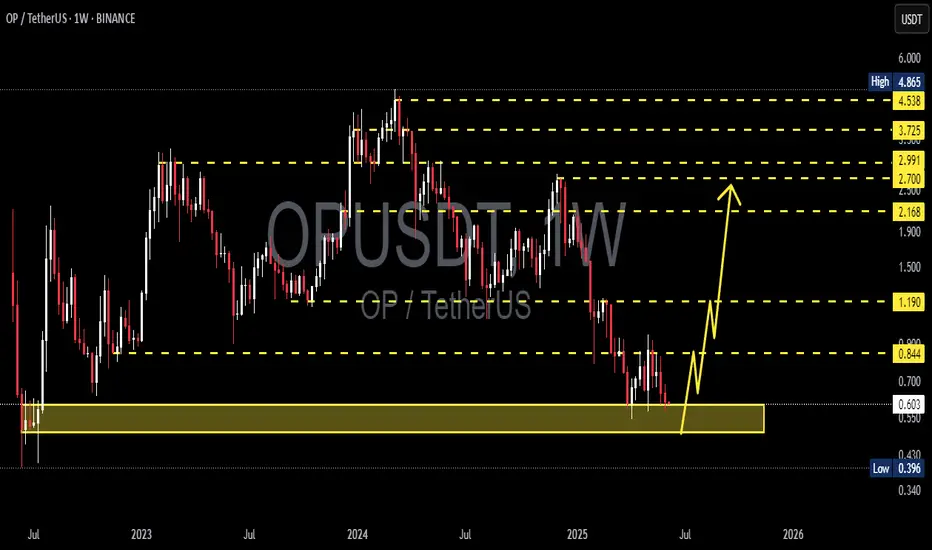
OPUSDT 1W AnalysisOP ~ 1W Analysis
#OP Buy back gradually from here, this is the lowest support block for now with a short term target of at least 20%+ from here.
$OP Building a Strong Base! Breakout Loading?NASDAQ:OP is showing a strong base here around the $0.59–$0.62 zone, holding support perfectly!
A clear breakout above this falling trendline could open the door for a big move → $0.82, $1.08, and even higher toward $1.38+ if momentum builds. 🚀
Structure looks solid, bulls are stepping in again.
Now just need to watch for breakout confirmation.
Stay ready, the next big move may be coming! 👀
DYOR, NFA
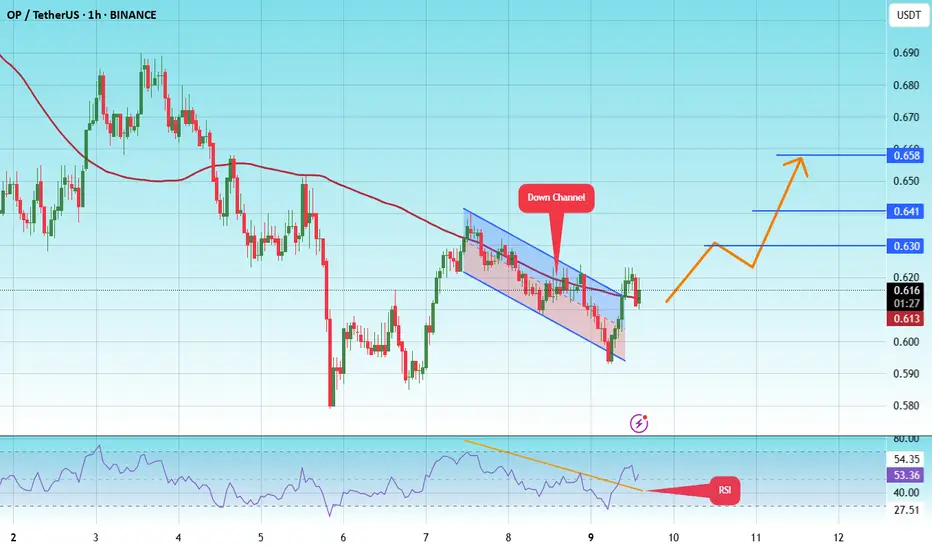
#OP/USDT#OP
The price is moving within a descending channel on the 1-hour frame and is expected to break and continue upward.
We have a trend to stabilize above the 100 moving average once again.
We have a downtrend on the RSI indicator that supports the upward move with a breakout.
We have a support area at the lower limit of the channel at 0.600, acting as strong support from which the price can rebound.
Entry price: 0.616
First target: 0.630
Second target: 0.641
Third target: 0.658
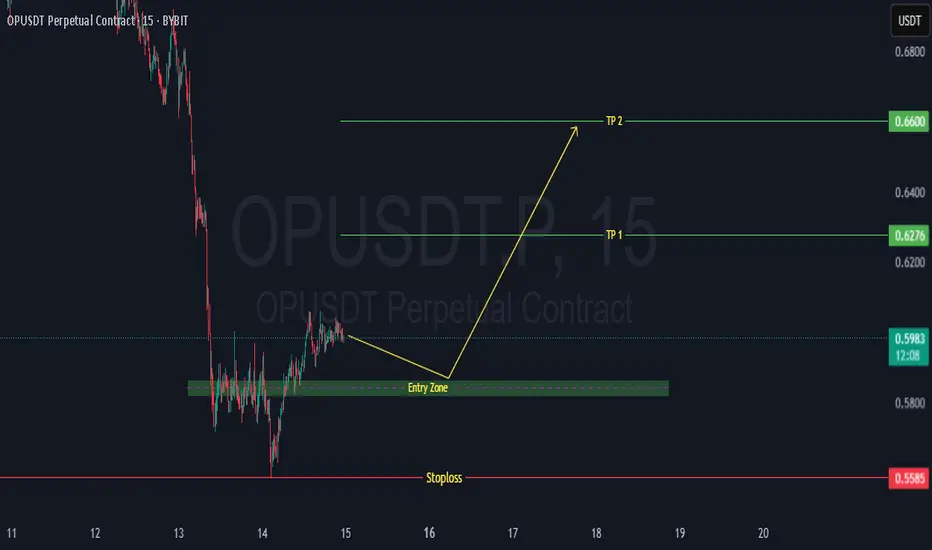
OP BullishA potential long entry could be around the current price range of 0.5864 to 0.5814 USDT, as the price seems to be bouncing off a recent support level near 0.5585. Before entering, it's important to confirm the move with a bullish candlestick pattern like a hammer or engulfing candle, check for a bullish MACD crossover, and ensure the RSI is trending upward but not yet overbought. For risk management, a stop-loss can be placed just below the recent support at around 0.5585 USDT, while the take-profit target could be set near a previous resistance zone, around 0.6276 to 0.6600 USDT, aiming for a favorable risk-reward ratio
The 2025 Bull Market: Do Not Sell Unless You See A New All-Time How long have you been in this market? You are about to embark on a journey; you are about to experience/enjoy the most sought after phase of the cryptocurrency market, the bull market.
If you've been around for less than four years, you've seen nothing like it. It will blow your mind.
You can see the numbers on the charts, past action and there you have your proof, but nothing can prepare you for the actual experience. Even if you've experienced previous bull markets, the actual event is mind-blowing. We are dying for you to try it. We cannot wait anymore... We just want you to earn, make money, share, have fun and enjoy. We, the Cryptocurrency family, deeply love you and wish for you amazing results.
Don't be shy. Do not be afraid. Buy everything up like it is the end of the world. Once bought, hold. Do not sell. I repeat, do not sell until prices are high, really high up. For example, looking at Optimism, OPUSDT, wait for a new all-time high before taking profits.
Thanks a lot for your continued support.
Leave a comment if you enjoyed the article, it will only take ten seconds.
Namaste.
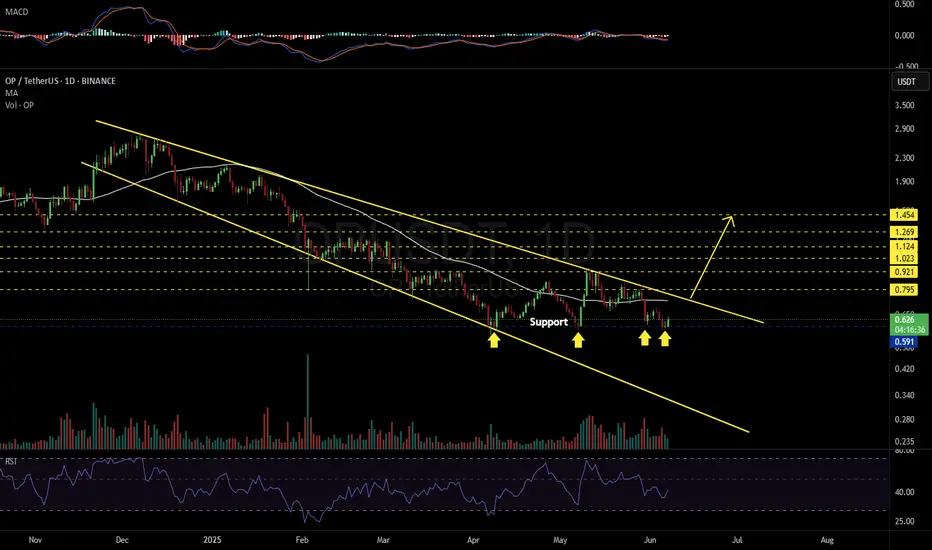
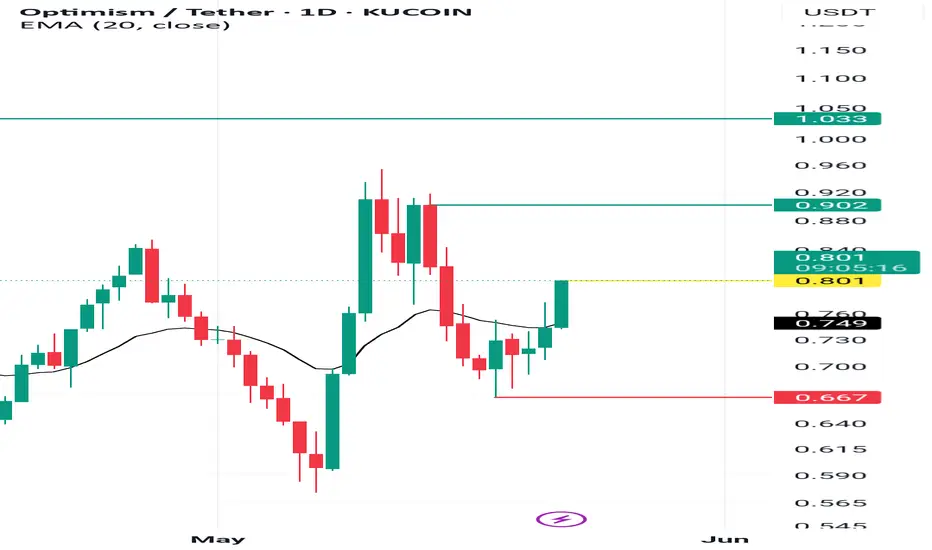
OPUSDT 1D#OP — Reversal in Play? 🚀
#OP is trading inside a Descending Broadening Wedge on the daily chart and has bounced strongly off the support.
A breakout above the wedge resistance could trigger a bullish rally. Potential upside targets:
🎯 $0.795
🎯 $0.921
🎯 $1.023
🎯 $1.124
🎯 $1.269
🎯 $1.454
⚠️ Always use a tight stop-loss to manage risk and protect your capital.
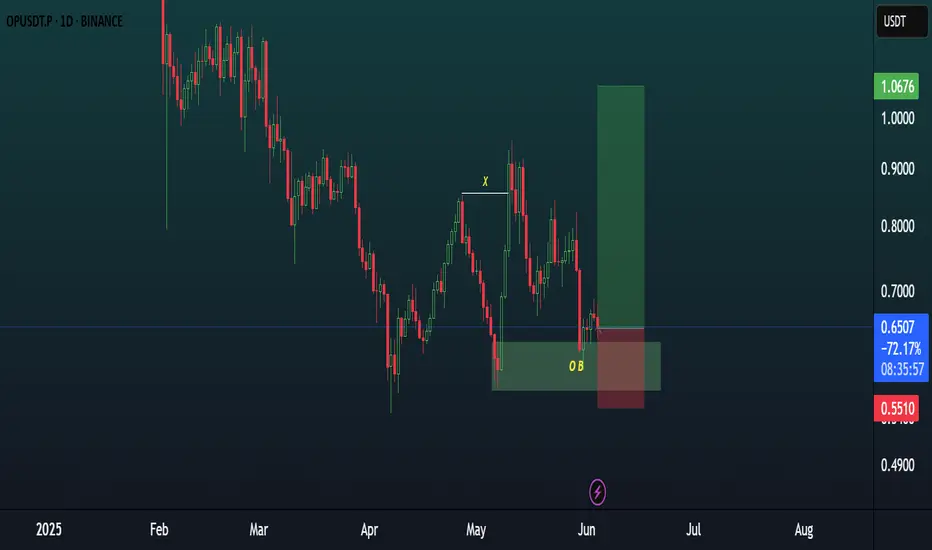
OP buy longOPUSDT is bullish from here on daily timeframe. 1D Bullish order block filled and green bullish candles with positive structure are buy sign, So its worth of taking it.
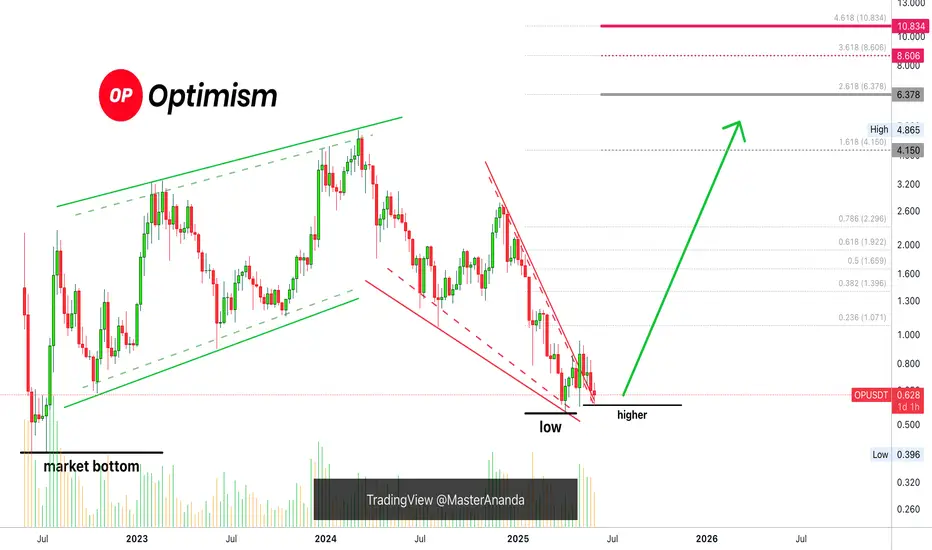
OP !!! Every action has a reaction.A rebound from the sell target levels below the red box must initiate a correction trend for the previous decline toward the WCL areas.
At the 1.63/2.40 price levels, an image of the bearish sequencing will be included below.

Don't miss today's signal.Hello friends
Based on the extensive and comprehensive analysis we conducted, we were able to obtain the buying points and targets for this currency for you so that you can buy in stages with risk and capital management.
*Trade safely with us*

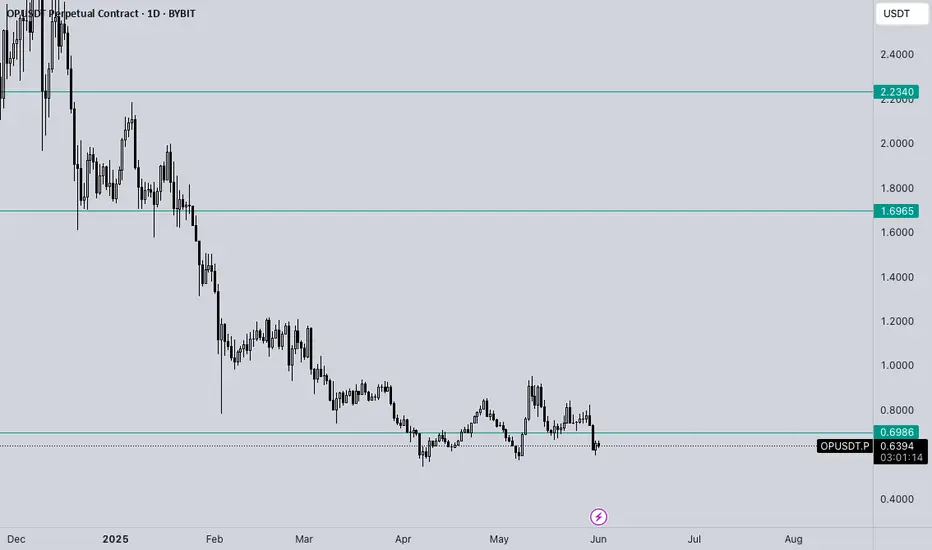
OP - Ranges overview Let's have a quick look at OP.
Market is pretty clean and setting up for some interesting moves in the coming weeks.
Let's see how the market wants to move from here.
IF we reclaim 0.70$ expect us aggressively trade back towards the HTF buyside liquidity at 1.70$.
IF we fail to hold 0.60$ expect us to trade lower towards 0.50$ and eventually 0.40$.
From a HTF perspective we are back into a weekly FVG from October 2022....if you pay attention you will notice it is the exact FVG which 'changed the bearish trend into a bullish trend' - to explain it in simple terms.
WAIT FOR THE MARKET TO SHOW YOU ITS HAND AND TRADE WITH IT.
Stay safe and never risk more than 1-5% of your capital per trade. The following analysis is merely a price action based analysis and does not constitute financial advice in any form.
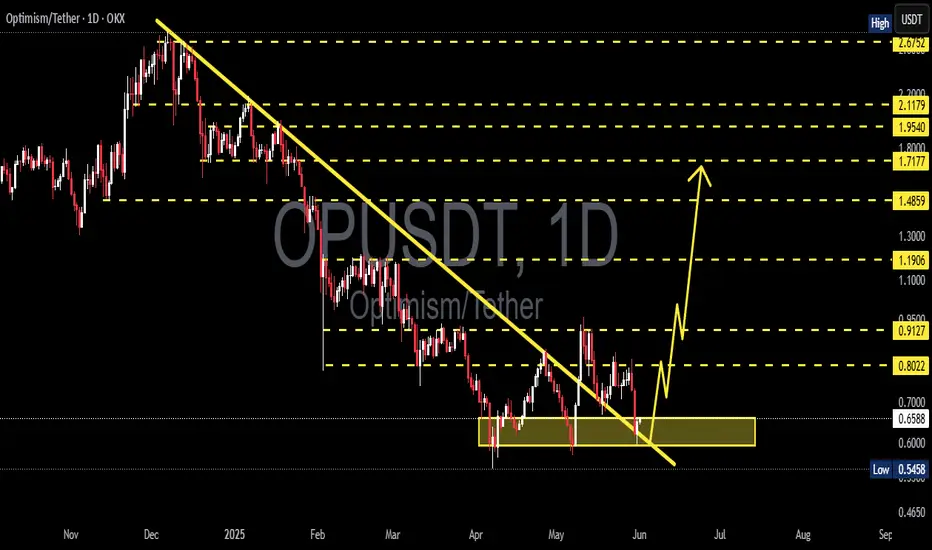
OPUSDT 1D AnalysisOP ~ 1D Analysis
#OP Buy in stages from here with a short term target of at least 15%+ and a long term target of $2.7

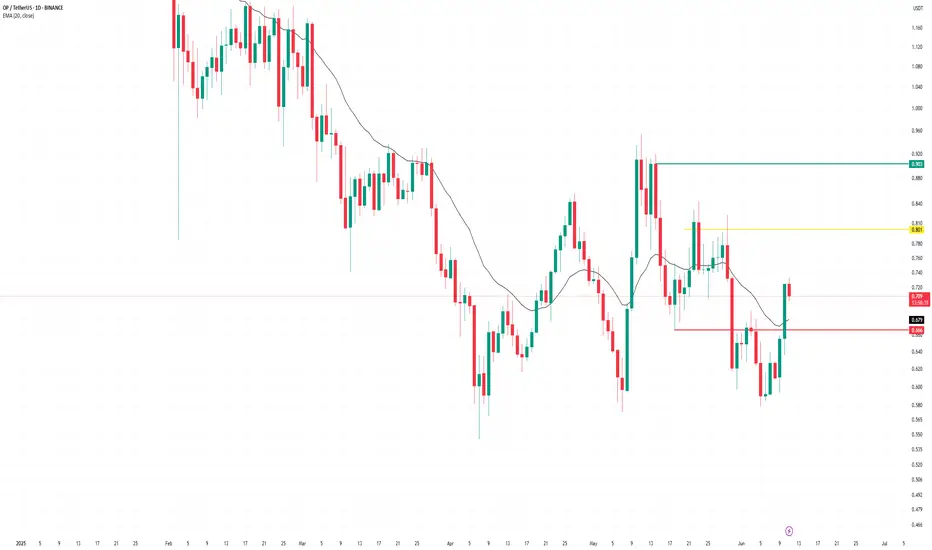
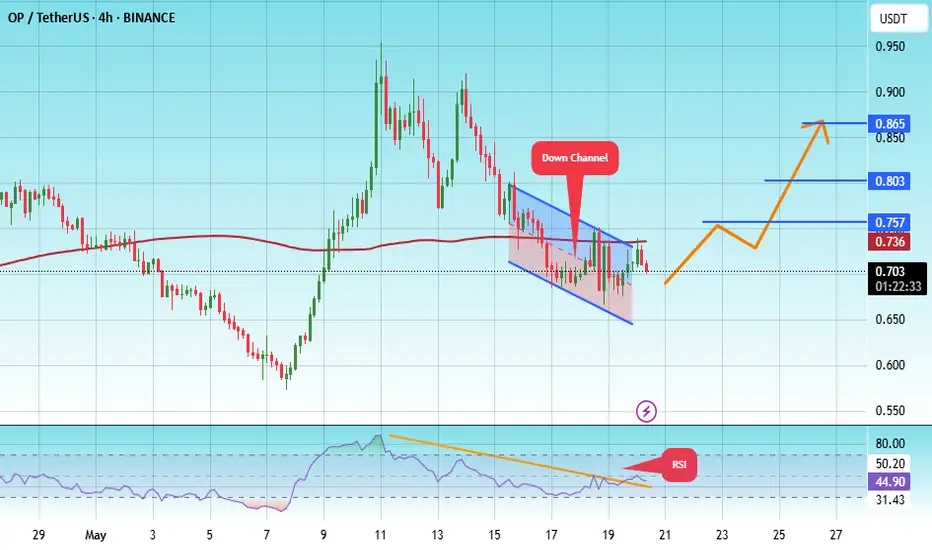
#OP/USDT#OP
The price is moving within a descending channel on the 1-hour frame, adhering well to it, and is heading for a strong breakout and retest.
We are seeing a bounce from the lower boundary of the descending channel, which is support at 0.653.
We have a downtrend on the RSI indicator that is about to be broken and retested, supporting the upward trend.
We are looking for stability above the 100 moving average.
Entry price: 0.702
First target: 0.757
Second target: 0.805
Third target: 0.865
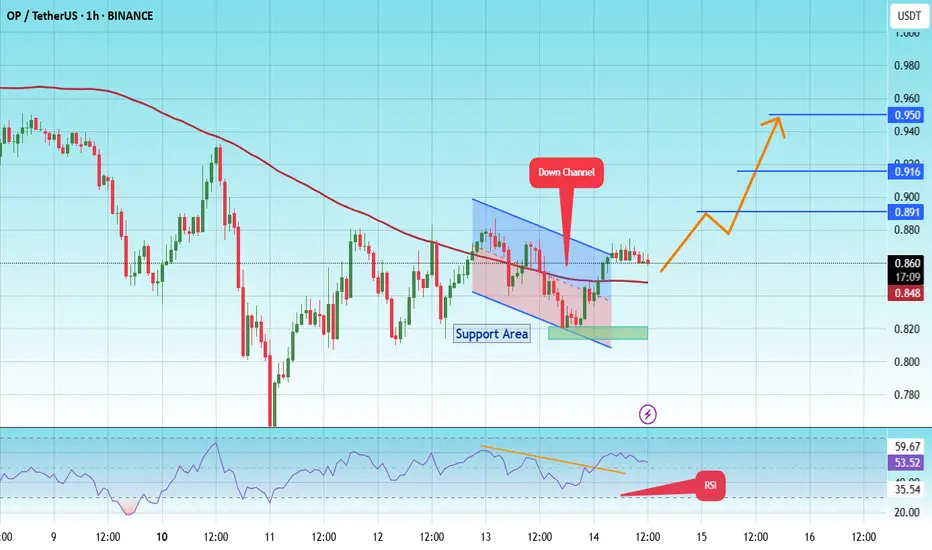
#OP/USDT#OP
The price is moving within a descending channel on the 1-hour frame and is expected to continue upward.
We have a trend to stabilize above the 100 moving average once again.
We have a downtrend on the RSI indicator, which supports the upward move by breaking it upward.
We have a support area at the lower limit of the channel at 0.817.
Entry price: 0.860
First target: 0.891
Second target: 0.916
Third target: 0.950
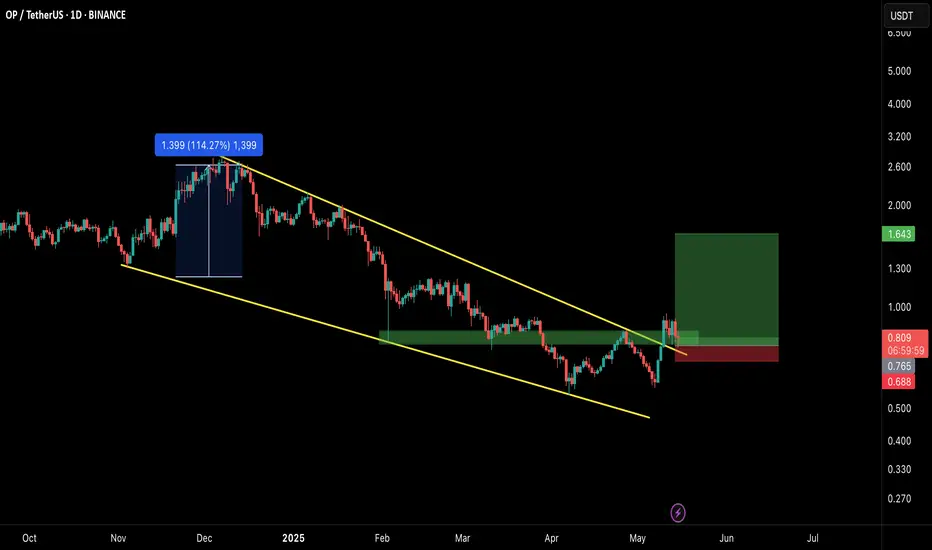
OP/USDT Breakout Alert!!🚀 OP Breakout Alert – 100% Potential Incoming?! 👀🔥
Hey Traders! If you're all about high-conviction plays and real alpha, smash that 👍 and tap Follow for more setups that actually deliver! 💹💯
OP has successfully broken out from the falling wedge pattern on the daily timeframe, which historically signals a strong trend reversal. After retesting the breakout zone, price action looks ready for a fresh upside move!
🔹 Entry: CMP and add more up to $0.76
🎯 Targets:
→ $0.98
→ $1.21
→ $1.43
→ Final Target: $1.64
🛑 SL: $0.688
⚙️ Leverage: Low leverage (Max 5x)
📊 Structure:
Falling wedge breakout ✅
Retest holding strong ✅
Volume starting to pick up 📈
We’re watching closely—this setup has the potential to mimic the last 114% rally. Let's see how it unfolds! 🚀
💬 What’s your take on OP from here?
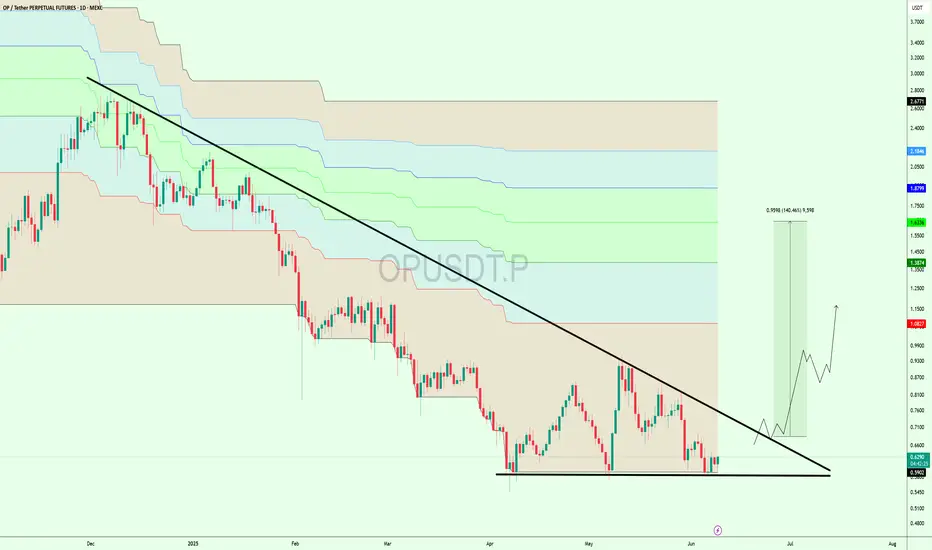
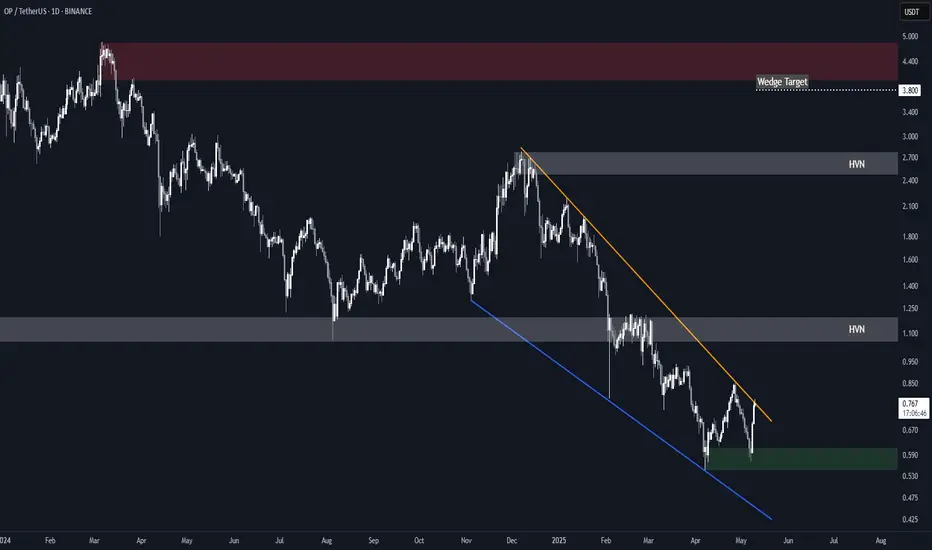
Optimism (OP) Falling WedgeBINANCE:OPUSDT is attempting a breakout from a 14 months long falling wedge.
A sustained break above the resistance in the near term would set the target at $3.80, just shy of the main $4.00-$4.80 supply zone.
Key Levels to Watch
• $0.55-$0.60: Main demand zone and invalidation point for the setup
• $1.00-$1.20: High Volume Node and key S/R dating back to June 2023.*
• $2.50-$2.80: High Volume Node and wedge high point.*
• $4.00-$4.80: Main supply zone.
* These could offer resistance and represent good levels for partial TPs.
#OP time to buy backSuccessfully breakout this resistant line with a short -term target of at least +10% ~ 50%
