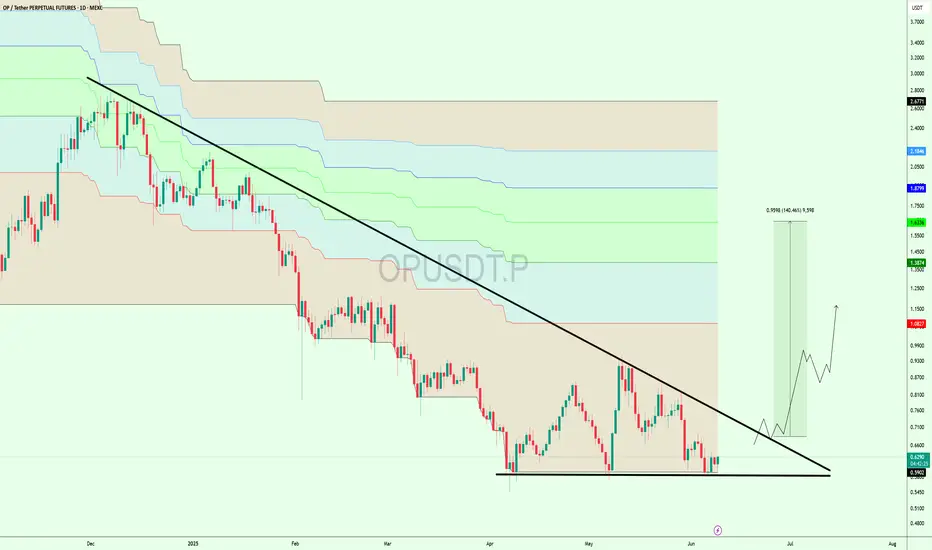
OP TARGETS FOR Q2 2025🔥 NASDAQ:OP long setup (1D) 🚀
✅ Entry Zone: $0.46 – $0.506 (descending-channel base)
🎯 Targets
• TP-1: $1.55 (Nov-23 supply flip)
• TP-2: $1.80 (201-day breakdown block)
⛔ Stop-Loss
Daily close < $0.42
📊 Thesis
• Superchain mainnet ties OP, Base, Mode & Fraxtal together Q4-25
• Bedrock upgra

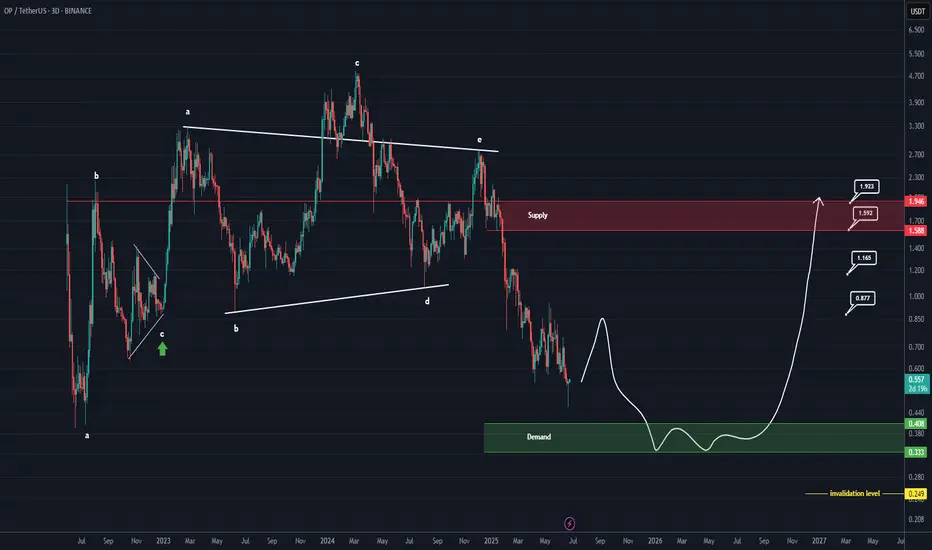
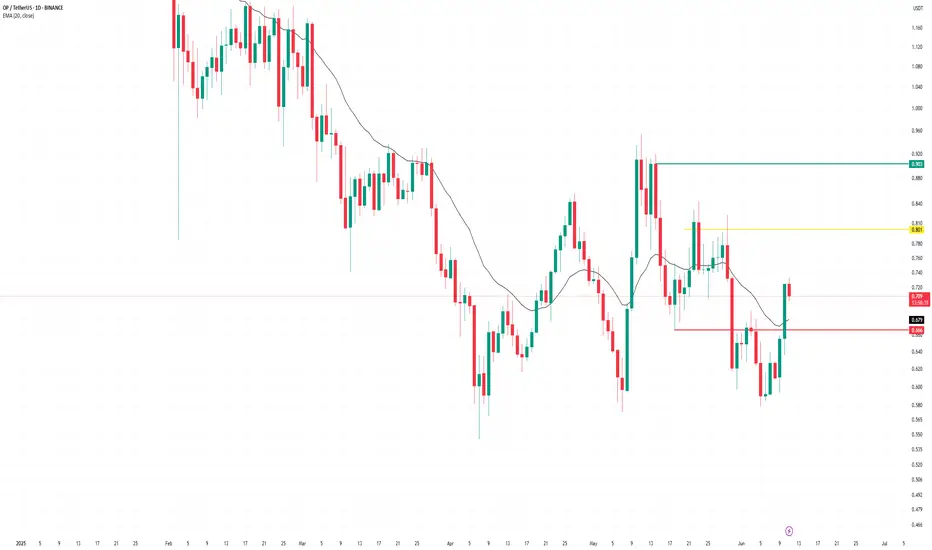
OP Roadmap (3D)The OP token has entered a bearish phase after completing a triangle pattern. We are currently in this bearish phase.
Such large bearish phases typically require a sweep of liquidity from key levels before ending. It appears that OP, after sweeping the liquidity below support levels, may reverse an
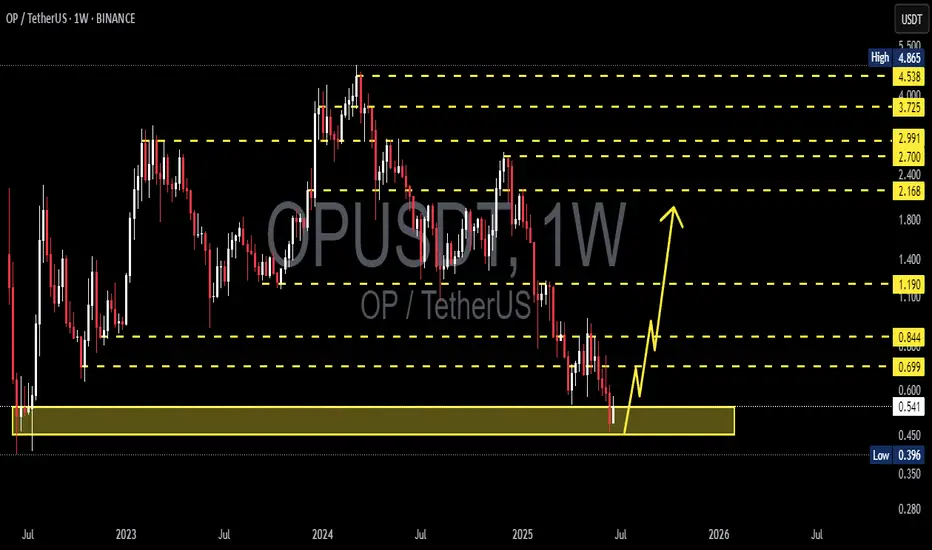
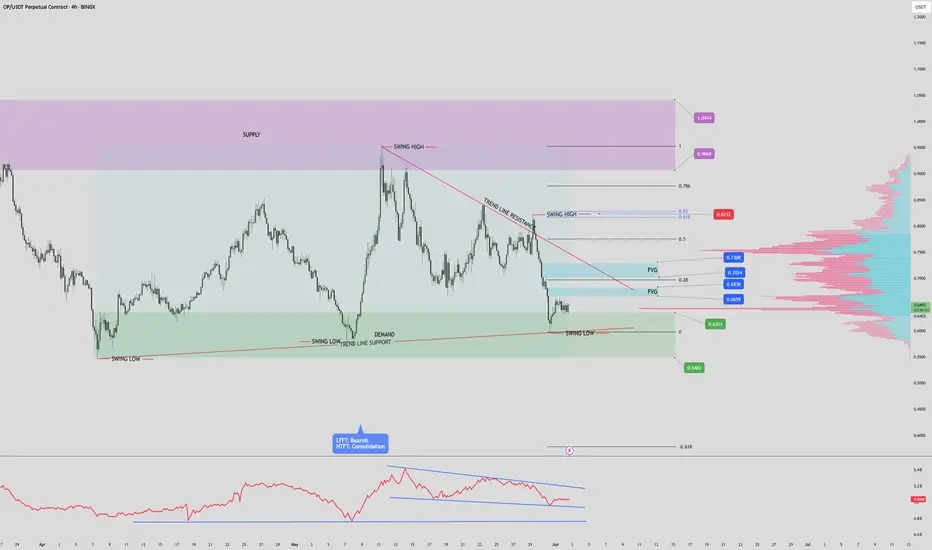
OP/USDT Weekly Reversal Zone: Strong Bounce ExpectedThe OP/USDT pair is currently showing strong signs of a potential trend reversal from a major long-term demand zone.
📊 Timeframe: 1W (Weekly)
🟨 Key Support Zone: 0.396 – 0.542 USDT
The price has revisited a historically strong support area that previously served as an accumulation zone since mid-20
#OP/USDT#OP
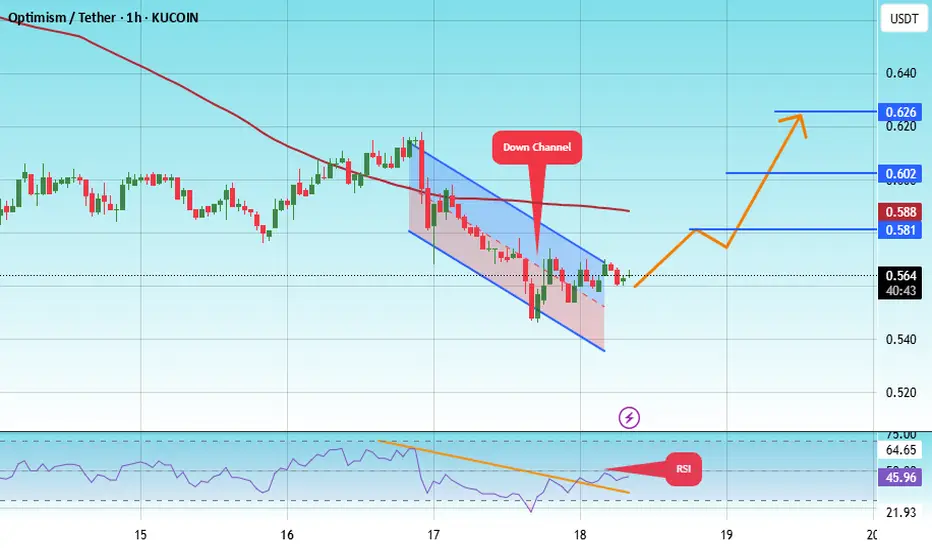
The price is moving within a descending channel on the 1-hour frame, adhering well to it, and is heading toward a strong breakout and retest.
We are experiencing a rebound from the lower boundary of the descending channel. This support is at 0.544.
We have a downtrend on the RSI indicator that
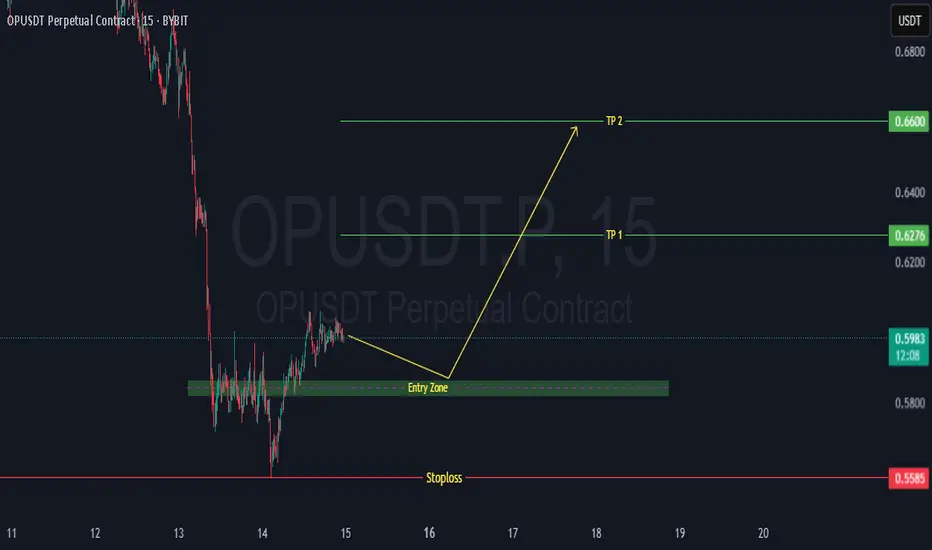
OP BullishA potential long entry could be around the current price range of 0.5864 to 0.5814 USDT, as the price seems to be bouncing off a recent support level near 0.5585. Before entering, it's important to confirm the move with a bullish candlestick pattern like a hammer or engulfing candle, check for a bul
OP / USDT 4hr PUMP INCOMING? OP/USDT – 4H Chart Summary
Market Structure:
4H Timeframe:
- Price consolidating within a descending triangle/wedge pattern, indicating potential buildup before a breakout.
- Lower Timeframes (1H and below): Bearish trend structure with lower highs and lows.
- OBV (On-Balance Volume): Forming
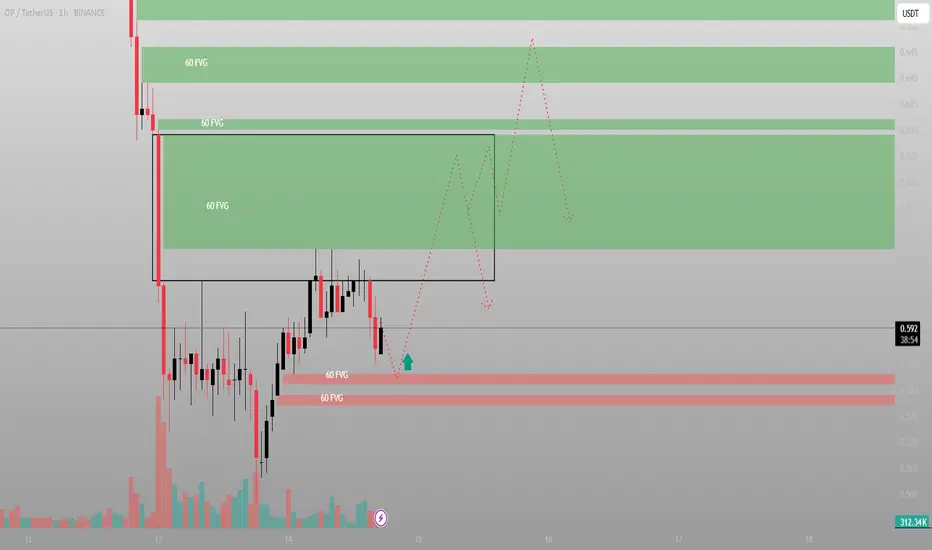
Everyone saw the drop. I saw the gapPrice nuked — but it didn’t break structure. It filled imbalance, paused, and now it's reloading beneath a stack of untouched FVGs. This isn't capitulation. It's orchestration.
The setup:
We’ve got layered 60-minute FVGs stacked from 0.61 to 0.66. That’s the destination — not the mystery. What matt
$OP Building a Strong Base! Breakout Loading?NASDAQ:OP is showing a strong base here around the $0.59–$0.62 zone, holding support perfectly!
A clear breakout above this falling trendline could open the door for a big move → $0.82, $1.08, and even higher toward $1.38+ if momentum builds. 🚀
Structure looks solid, bulls are stepping in again.
See all ideas
Summarizing what the indicators are suggesting.
Oscillators
Neutral
SellBuy
Strong sellStrong buy
Strong sellSellNeutralBuyStrong buy
Oscillators
Neutral
SellBuy
Strong sellStrong buy
Strong sellSellNeutralBuyStrong buy
Summary
Neutral
SellBuy
Strong sellStrong buy
Strong sellSellNeutralBuyStrong buy
Summary
Neutral
SellBuy
Strong sellStrong buy
Strong sellSellNeutralBuyStrong buy
Summary
Neutral
SellBuy
Strong sellStrong buy
Strong sellSellNeutralBuyStrong buy
Moving Averages
Neutral
SellBuy
Strong sellStrong buy
Strong sellSellNeutralBuyStrong buy
Moving Averages
Neutral
SellBuy
Strong sellStrong buy
Strong sellSellNeutralBuyStrong buy
Displays a symbol's price movements over previous years to identify recurring trends.