ordiSupport and press the rocket to cheer me up
Observe the ten percent loss limit
Stay away from Bitcoins
Feel free to buy and sell and post your comments
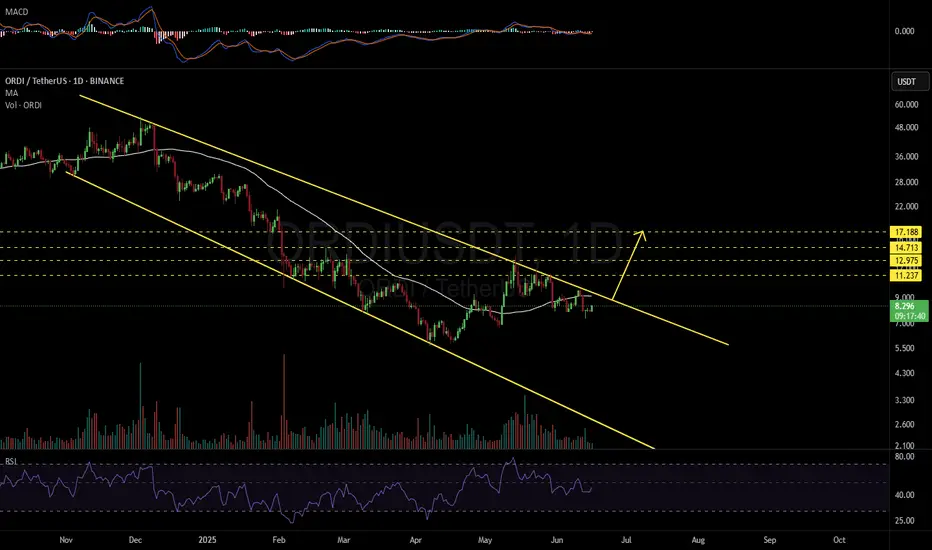
ORDIUSDT 1D#ORDI — 2x Rally on the Horizon? 🚀
#ORDI is trading inside a Descending Broadening Wedge on the daily chart — a bullish reversal pattern.
A breakout above the wedge resistance and the daily MA50 could trigger a strong upward move.
If confirmed, the upside targets are:
🎯 $11.237
🎯 $12.975
🎯 $14.71
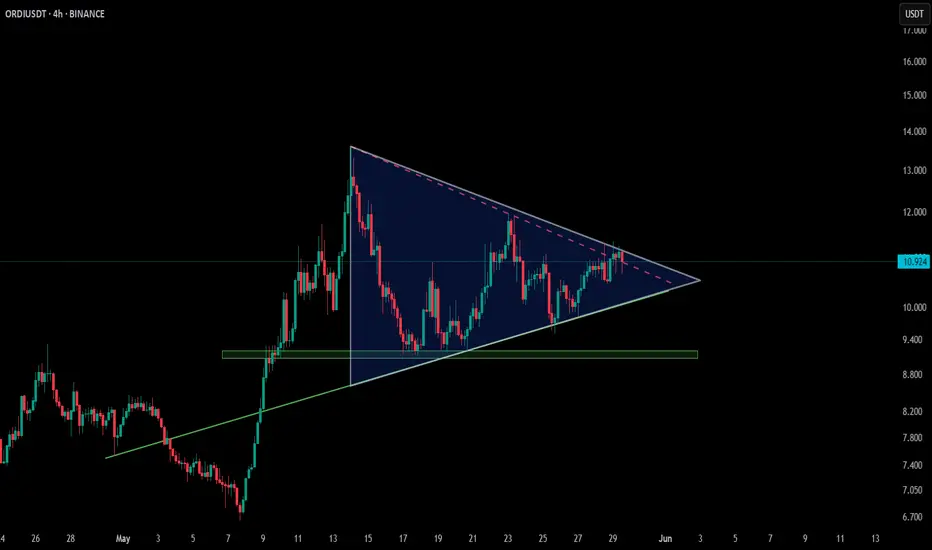
ORDI – Symmetrical Triangle Nearing Decision Point (4H)📐 SEED_DONKEYDAN_MARKET_CAP:ORDI is consolidating tightly within a symmetrical triangle on the 4H timeframe, and it's now pushing toward the upper trendline 📊
A breakout from this range could signal fresh momentum, but failure to break out cleanly might lead to more sideways chop ⚠️
Structure is
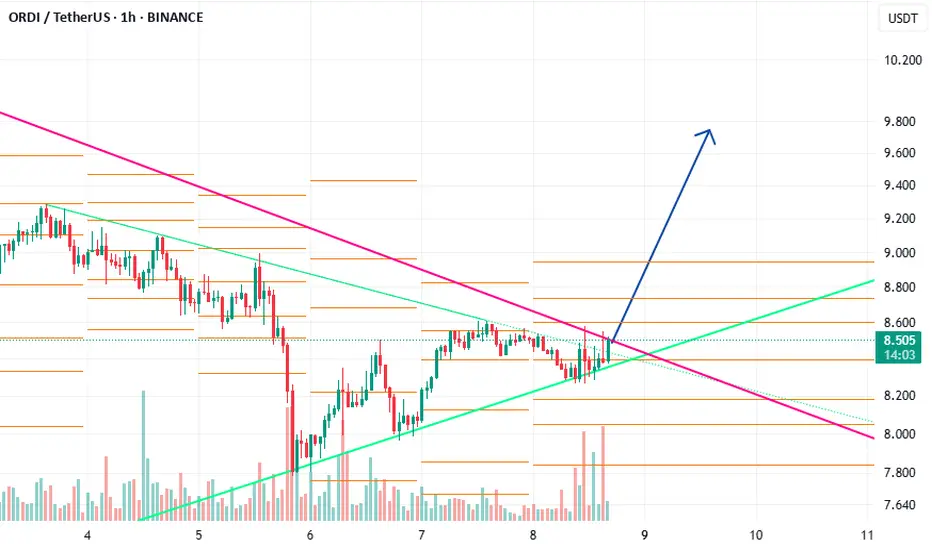
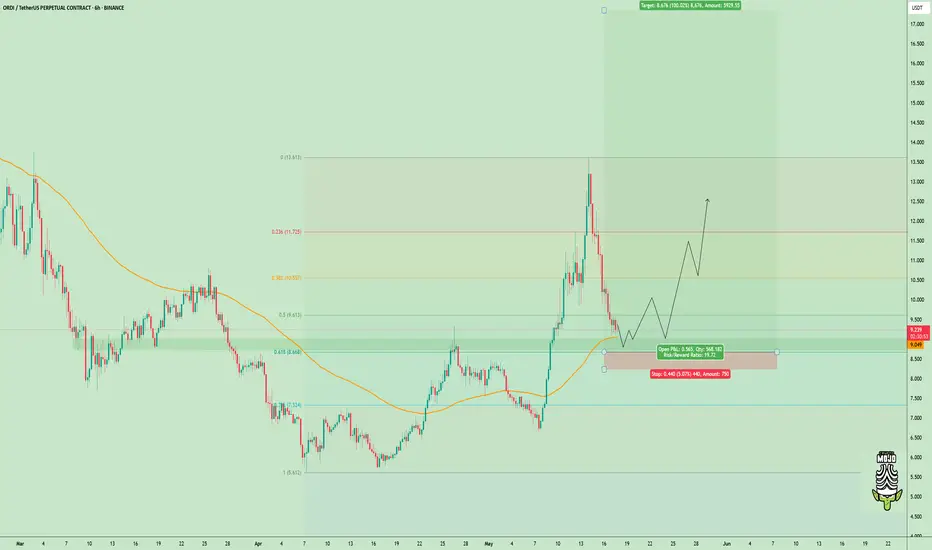
ordiWe have a series of numbers that can be considered as medium-term targets. But in the short term, the red box is in the way as resistance.
Me thinks: ORDI USDT Short around 10.45ORDIUSDT short at 10.45. Sl @ 10.8 and Tp at around 9.3.
This is a winner. Don’t Fade. We dipping straight to hell..
~ W

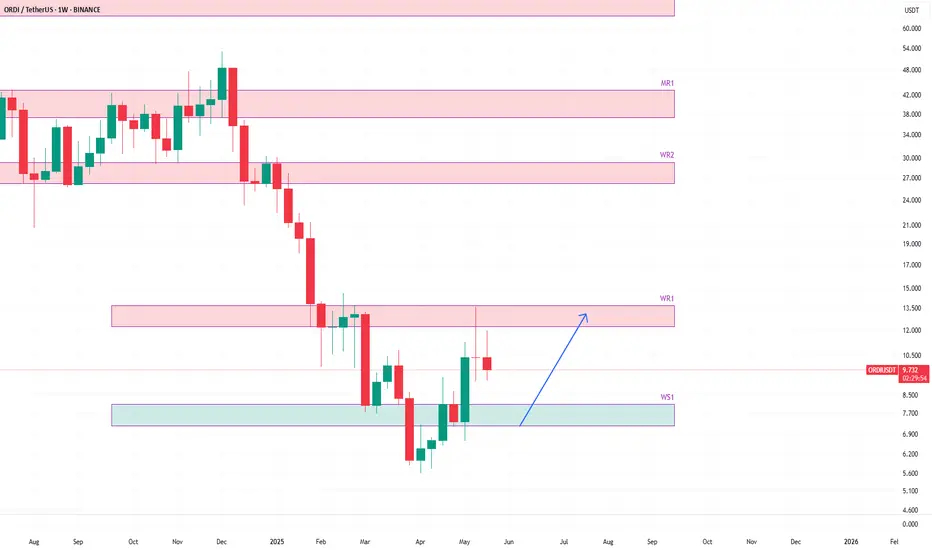
ORDIUSDT heading to weekly supportORDIUSDT is currently trending down after hitting the weekly resistance WR1.
The price is likely to head to weekly support WS1. This support is going to hold the price and provide the bounce.
I believe, the price is very likely to bounce from WS1 and then move upward and on this attempt it may bre
$ORDI Enters Key Fib Support, Watching for Bounce!!SEED_DONKEYDAN_MARKET_CAP:ORDI
It’s not forming any clear pattern, but based on the Fib retracement, price is currently sitting in the golden entry zone around the 0.5–0.618 level.
Also, the 100 MA, which previously acted as strong resistance, is now working as support.
This setup looks interest
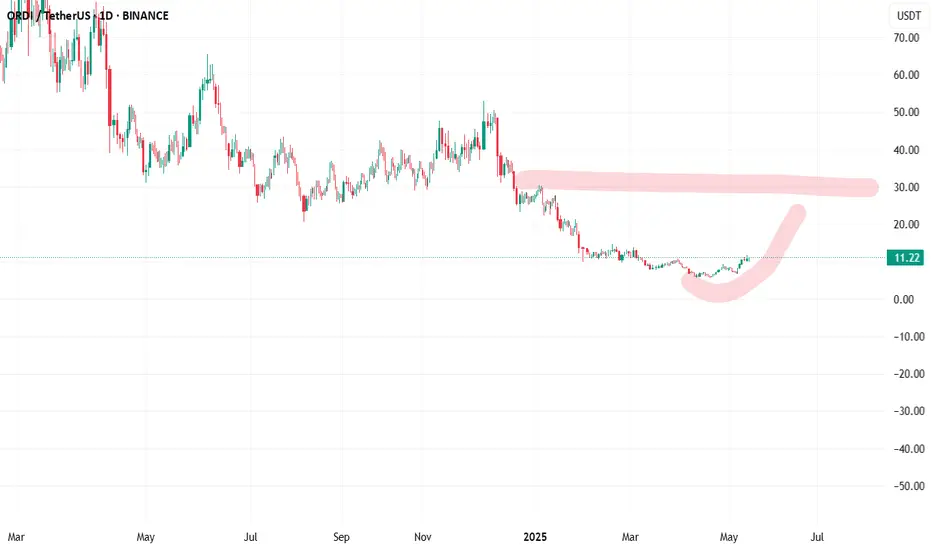
$ORDI/USDT Breakout Alert!$ORDI/USDT Breakout Alert!
After months of a brutal downtrend, ORDI has finally broken the descending trendline with strong bullish momentum. 👀
Entry:- CMP
Targets:- $ 10, $16, $23, $32, $49
Stop loss:-5.67
Risk/Reward looks 🔥 if this move holds.
Eyes on continuation! 🚀

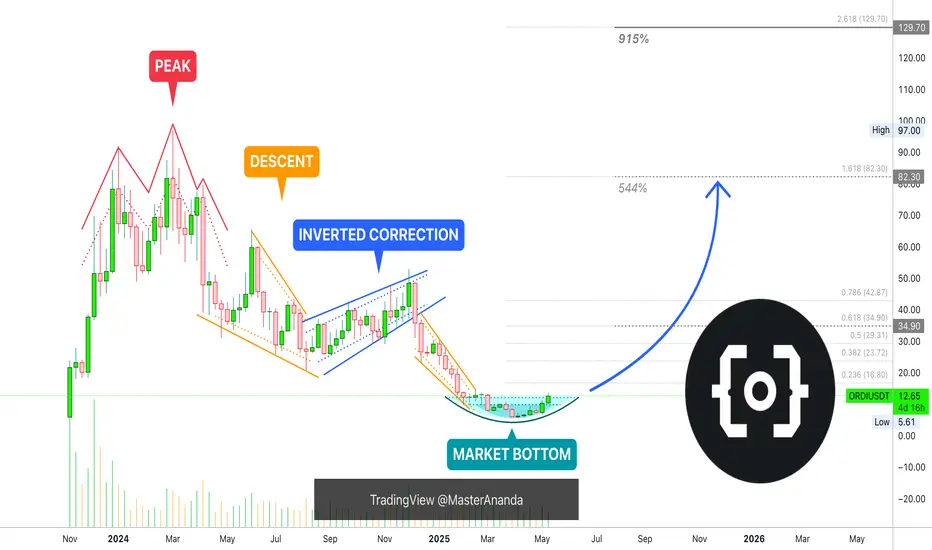
Ordinals Market Bottom, New 10X Bullish Wave In The MakingHere we have a true and perfect bottom. A rounded bottom.
The bottom is perfect because of the chart structure. First, there is a bullish wave, some bullish action. This is followed by a descent with a classic period of rest in-between the start and the end of the bearish move. After the down-wave
ORDI USDT D1 CHARTWE ARE EXPECTING BULLING ON D1 CHART
THIS IS DAILY BASED ANYLIZED PLEASE ITS MAY TAKE LONG TIME HOLDING
Capital.com: the Middle East's best broker (TradingView, 2025). Trading carries risk. Quick, fee-free AED deposits – USD also available. Instant Price Alerts. Tight Spreads.
See all ideas
Summarizing what the indicators are suggesting.
Oscillators
Neutral
SellBuy
Strong sellStrong buy
Strong sellSellNeutralBuyStrong buy
Oscillators
Neutral
SellBuy
Strong sellStrong buy
Strong sellSellNeutralBuyStrong buy
Summary
Neutral
SellBuy
Strong sellStrong buy
Strong sellSellNeutralBuyStrong buy
Summary
Neutral
SellBuy
Strong sellStrong buy
Strong sellSellNeutralBuyStrong buy
Summary
Neutral
SellBuy
Strong sellStrong buy
Strong sellSellNeutralBuyStrong buy
Moving Averages
Neutral
SellBuy
Strong sellStrong buy
Strong sellSellNeutralBuyStrong buy
Moving Averages
Neutral
SellBuy
Strong sellStrong buy
Strong sellSellNeutralBuyStrong buy
Displays a symbol's price movements over previous years to identify recurring trends.