ORDI (SPOT)BINANCE:ORDIUSDT
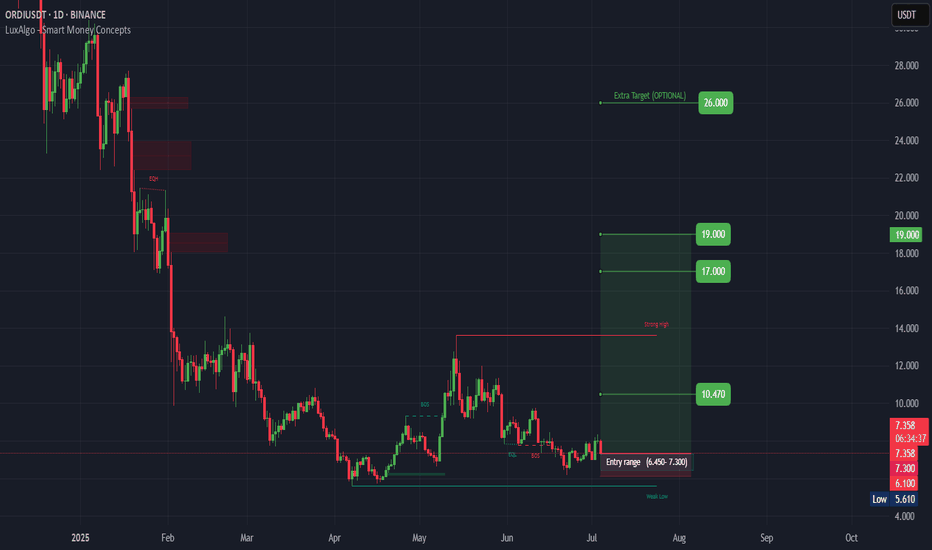
#ORDI/ USDT
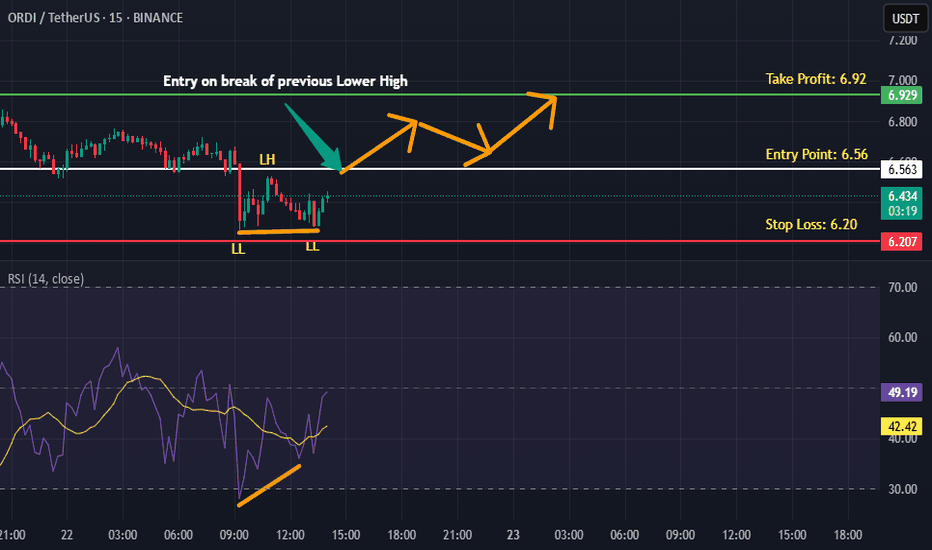
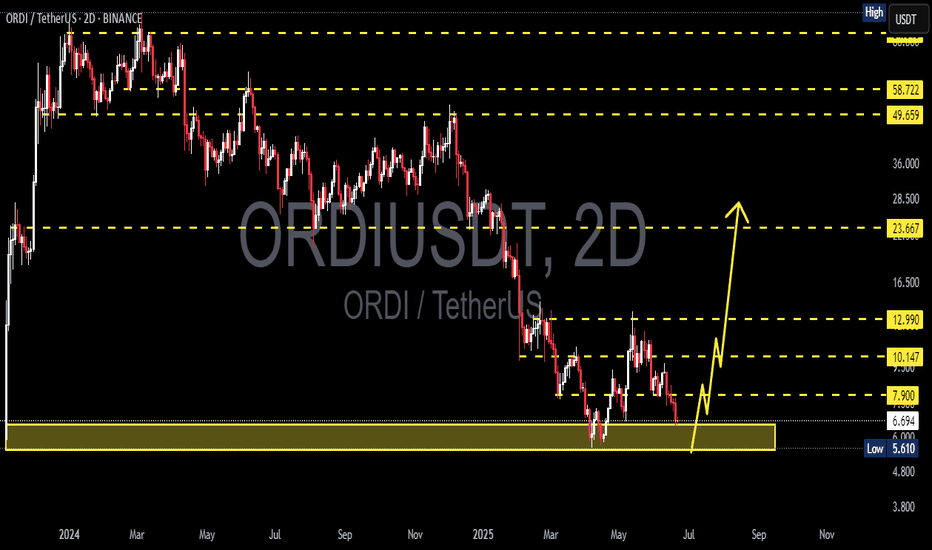
Entry(6.450- 7.300)
SL 1D close below 6.100
T1 10.470
T2 17.000
T3 19.000
1 Extra Targets(optional) in chart, if you like to continue in the trade with making stoploss very high.
______________________________________________________________
Golden Advices.
********
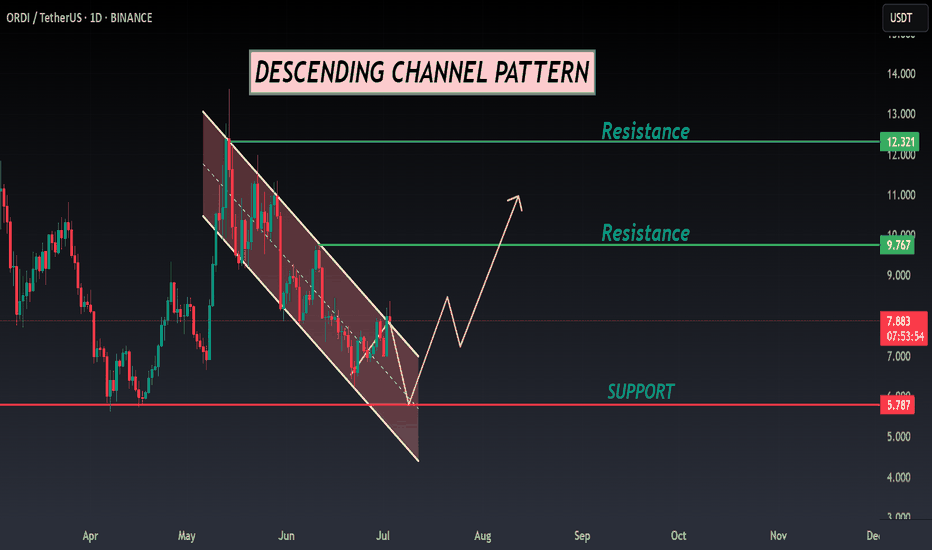
ORDI ANALYSIS📊 #ORDI Analysis
✅There is a formation of Descending Channel Pattern in daily time frame.
After a breakout of the pattern we would see a bullish momentum and can Target for $9.5 in few weeks🧐
👀Current Price: $7.890
🎯 Target Price : $9.500
⚡️What to do ?
👀Keep an eye on #ORDI price action an
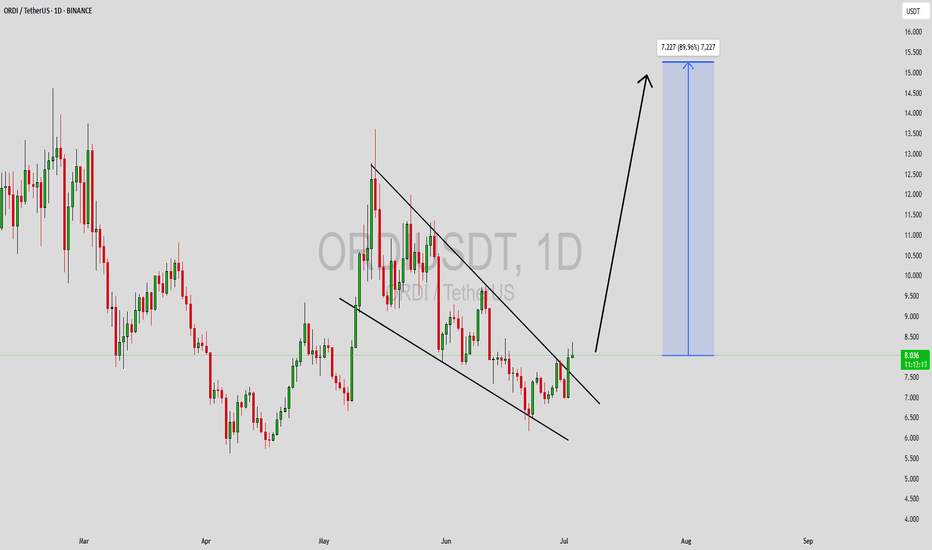
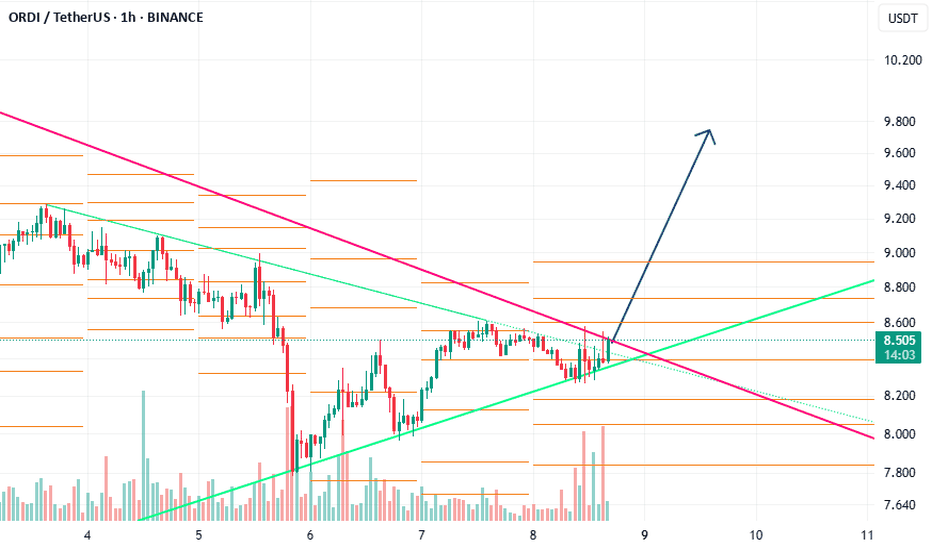
ORDIUSDT Forming Falling WedgeORDIUSDT is shaping up to be one of the more compelling opportunities on the crypto charts right now. The pair is forming a classic falling wedge pattern, which is widely regarded as a strong bullish reversal setup when spotted after a prolonged downtrend. This pattern often signals that selling pre
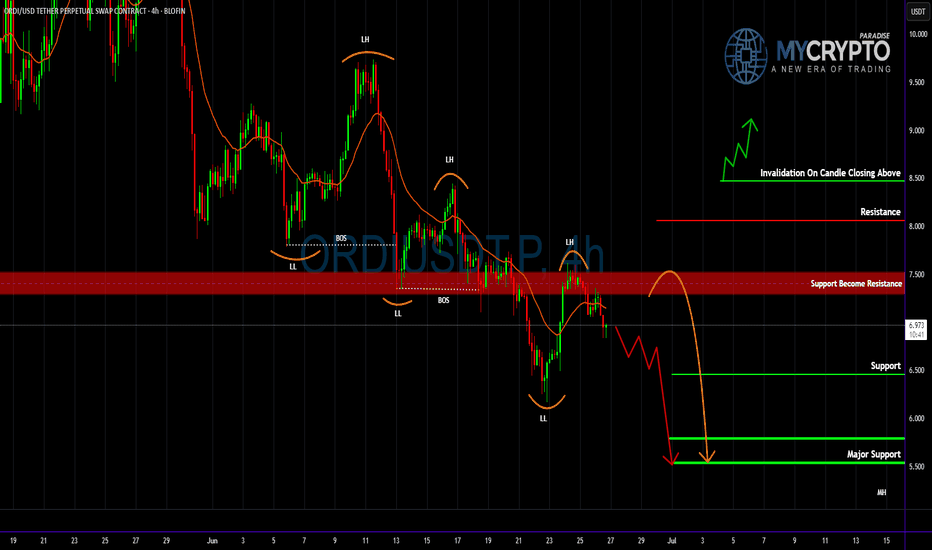
ORDIUSDT Hanging by a Thread Before the Next Leg Down?Yello Paradisers! Are you ready for the next big move on #ORDIUSDT? Because if you’re not already positioned or thinking three steps ahead, this structure could catch you off guard. We’re seeing signs of exhaustion, and the market is setting up for another potential drop. Here’s what you need to kno
ORDI/USDT – Bullish Falling Wedge Formation!!Hey Traders — if you're into high-conviction setups with real momentum, this one’s for you.
ORDI is forming a bullish falling wedge pattern and is currently consolidating near crucial support. The price is showing initial signs of breakout potential.
Here's the trade plan:
Entry: $7.20–$7.70
Targ
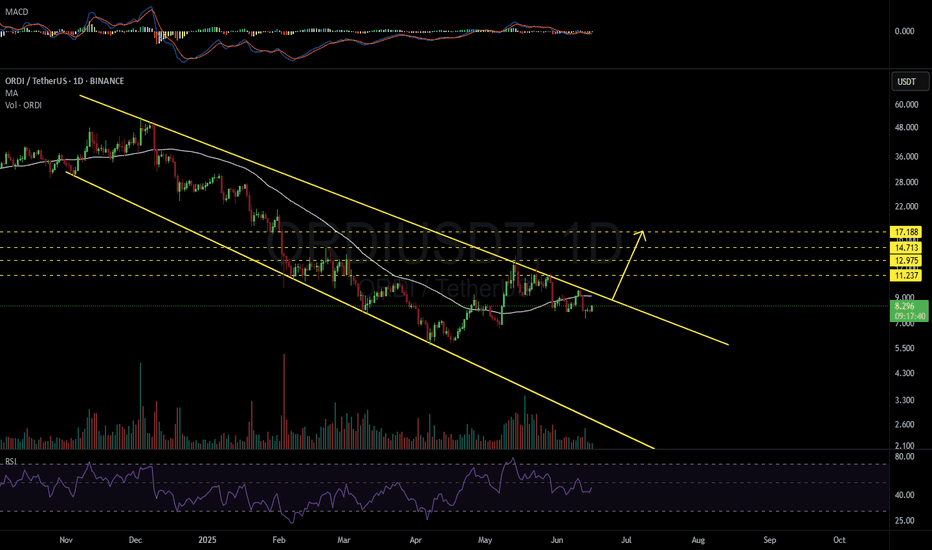
ORDIUSDT 1D#ORDI — 2x Rally on the Horizon? 🚀
#ORDI is trading inside a Descending Broadening Wedge on the daily chart — a bullish reversal pattern.
A breakout above the wedge resistance and the daily MA50 could trigger a strong upward move.
If confirmed, the upside targets are:
🎯 $11.237
🎯 $12.975
🎯 $14.71
See all ideas
Summarizing what the indicators are suggesting.
Oscillators
Neutral
SellBuy
Strong sellStrong buy
Strong sellSellNeutralBuyStrong buy
Oscillators
Neutral
SellBuy
Strong sellStrong buy
Strong sellSellNeutralBuyStrong buy
Summary
Neutral
SellBuy
Strong sellStrong buy
Strong sellSellNeutralBuyStrong buy
Summary
Neutral
SellBuy
Strong sellStrong buy
Strong sellSellNeutralBuyStrong buy
Summary
Neutral
SellBuy
Strong sellStrong buy
Strong sellSellNeutralBuyStrong buy
Moving Averages
Neutral
SellBuy
Strong sellStrong buy
Strong sellSellNeutralBuyStrong buy
Moving Averages
Neutral
SellBuy
Strong sellStrong buy
Strong sellSellNeutralBuyStrong buy
Displays a symbol's price movements over previous years to identify recurring trends.
