ORDI update for previous idea - local short scalpORDI had a nice drop since the upper golden pocket, as mentioned in the previous TA. Price also had a good local drop since the last post, but bears are just about to begin.
Locally I am also bearish and want to see continuation.
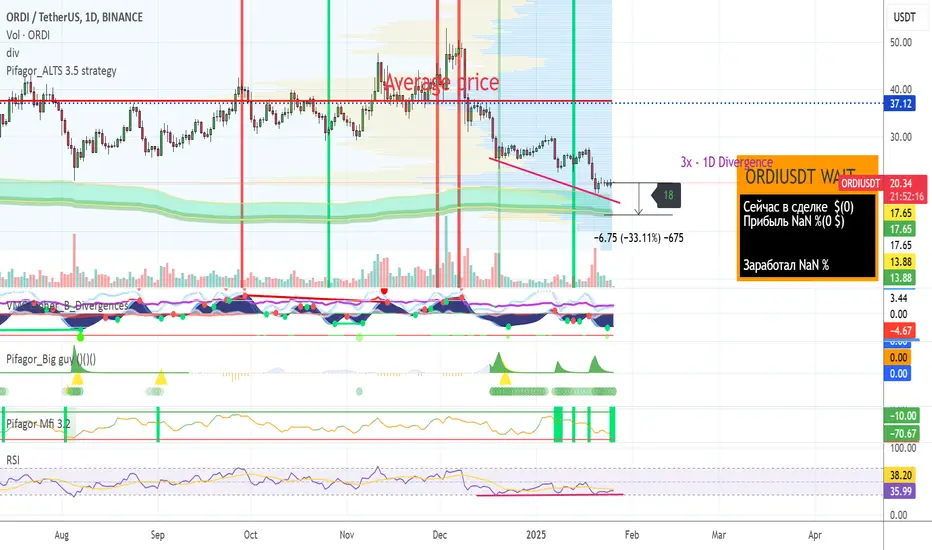
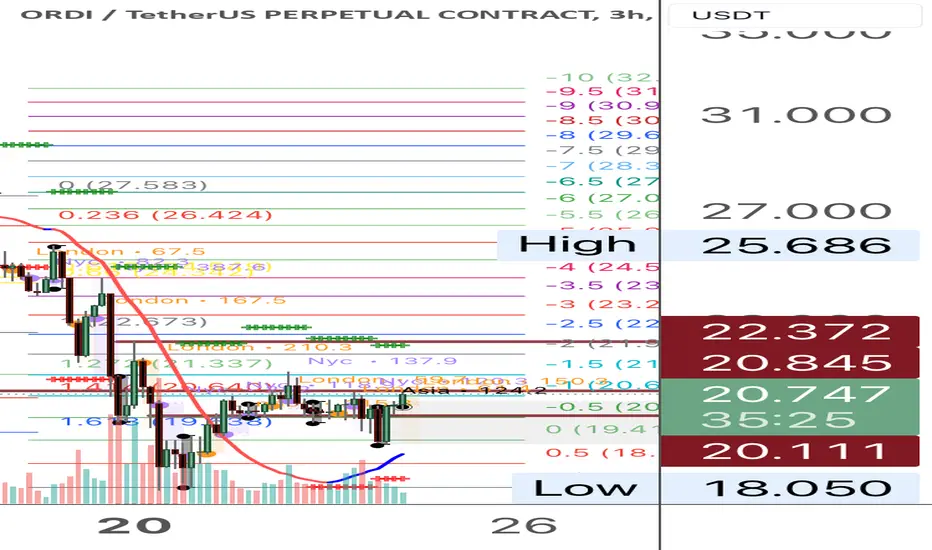
The previous high confirmed trapped longs but buyers stepped in at the range POC. Now the price is in the same zone of the previous high with the trapped longs. The previous high had lower OBV than the beginning of the range. The current high is even having lower OBV than the previous high. Imo this is just a retest / upthrust to trap more longs into the distribution setup.
Another interesting fact is that the range had the LVN (low volume node) at the top of the range above the range POC, which is a sign of weakness. That never changed but at the end of the range ones longs started to build above the range VAH (value are high). Then the LVN could have been found at the bottom of the range, below the POC. This was the first early sign for me for trapped longs even before the trapped longs of the previous high got confirmed by breaking back into the range (failed auction).
We still want to see much lower.
ORDIUSDT.P trade ideas
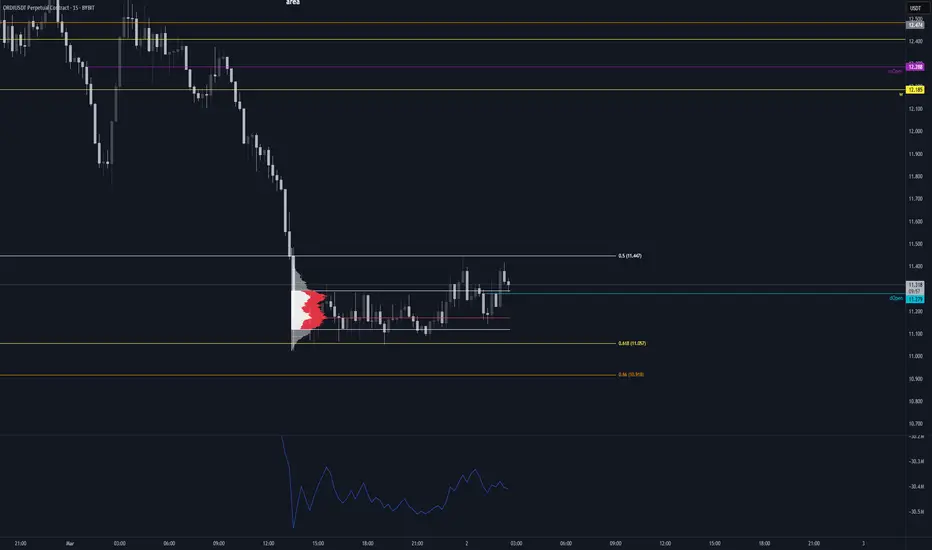
ORDI will likely go to the pmVAL I took a short at the golden pocket, because sell pressure came in. This was shown by 30 min one time framing. The upside move and retest of the 0.5 fib normally looks bullish to me and in the past I would be only in long mode since 30 min otf from the 0.5 fib. In this case I wanted to actively counter trade the bulls from higher prices and the setup was given. So as mentioned before, the upside move with the claim of the pmPOC looks bullish, but while losing it to perform the bullish backtest, it becomes a bearish move aswell. The loss of the pmPOC (to perform the bullish retest) offers a failure to rotate scenario (FTR). In this case the liquidity at the origin of the move is the target. I have marked it on the chart as FTR draw at 10.343. Whenever the price claims a POC, it could continue a lot before it performs the retest. So ideally the retest would still happen above the POC (bullish case). Then bulls are a lot in favor, but we can often see the POC claim quickly followed by a loss, giving a 50 / 50 chance for bears and bulls, two setups at the same time. So why am I more bearish than bullish on this one? If you look at the freshest pwProfile, which is the only relevant for the current price action, then you can see that the price got rejected by the POC (reversion to the mean, then the auction process started again and bears stepped in) and then again the more local retest (where I took the short) happened from the low volume area of that profile. If bulls would be strong, then they would manage to get through the low volume area at least to the POC and ideally above. Well, they didn´t. That was another sign of weakness for me. So locally bears are in favor and if you check the 4 hr chart, below are some singleprints, fvg whatever you want to call it. That is interesting liquidity which isn´t given locally above. That´s another bearish factor here. Now let´s think about the previous month profile. The whole price action down here is rather below the POC than above. Yes an attempt with a claim of the POC could be bullish, but all the claims above where short lived indicating that it was only a liquidity hunt - not too bullish. It fell back below and spend here most of the time. That is accumulation below the POC which is also rather bearish. I have checked these liquidity hunts above and all of them rejected a low volume area of the pmProfile. It isn´t even the LVN (low volume node) of the profile. If bulls would be in control, they would easily slip through the low volume area and flip it to support. They didn´t multiple times. What do we have below? Singleprints offering interesting liquidity, the frontran pmVAL offering liquidity and below (check the 4 hr or daily chart) are singleprints aswell, offering liquidity once again. All these things are much more bearish than bullish so I decided to not stick to the potential bullish setup off the 0.5 fib. That´s why I have decided to take the short. First target is the FTR draw but the main target is the pmVAL to finish the bearish rotation. The bearish setup remains valid as long as bulls can not claim the pmPOC, hold it, form higher lows above locally as first signs of strength. That´s why the swing high at 13.110 is my invalidation. Btw: As mentioned before, the loss of the pmPOC (to perform the bullish retest) offers a FTR scenario. So does the pwProfile now because the price is unable to fully rotate it (obviously because of the rejection). Both profiles confirmed a FTR which is bearish.

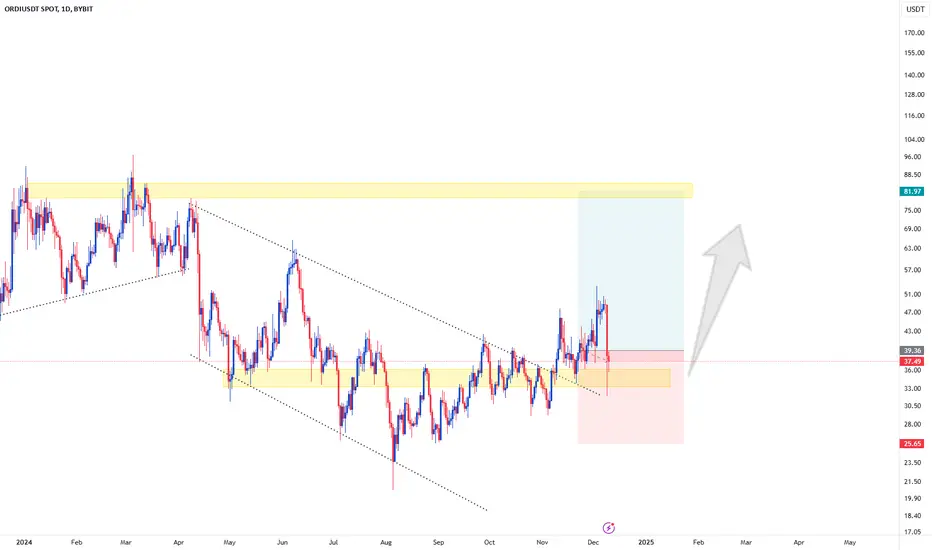
#ORDI $ORDIThe chart caught my attention,
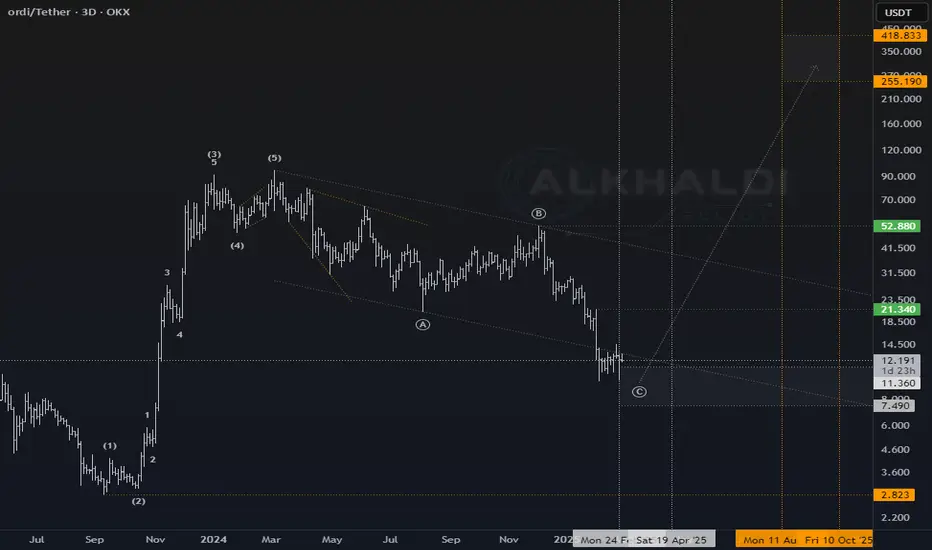
The coin is in a zone likely for consolidation and a bounce, but its price range is wide, so whoever is thinking of entering should manage their allocation well. Monitoring is crucial because if the bounce from the specified zone and time happens strongly, the target is 3 figures as shown, but if it’s weak, a reassessment will be needed.
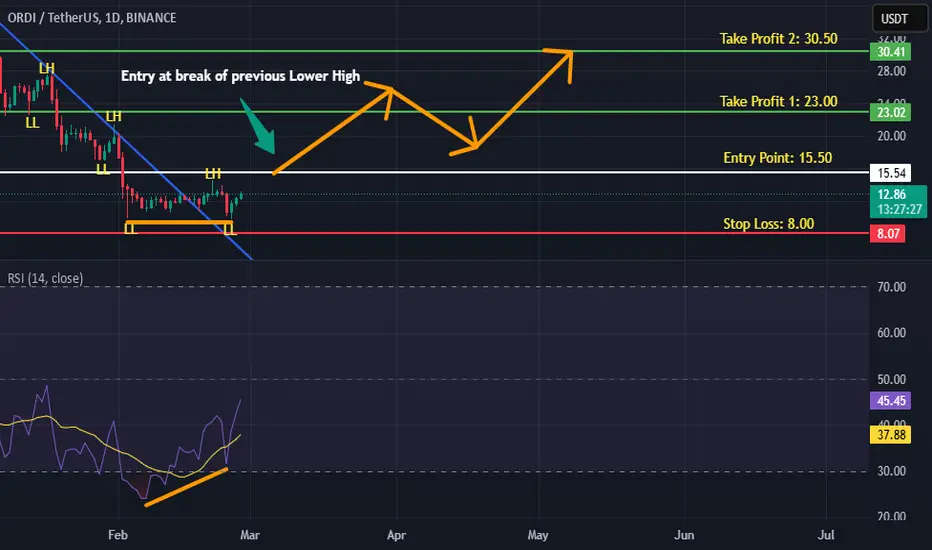
ORDIUSDT is BullishPrice was in a downtrend on daily time frame, however, the months old descending trendline is broken, hinting the return of bulls. The notion is further validated by the emergence of a bullish divergence along with a double bottom reversal pattern. If previous lower high is broken successfully then we can expect a bullish reversal as per Dow theory. Targets are mentioned on the chart.
ORDIUSDT CHART ANALYSİS - EDUCATIONAL POSTWhat Are Crypto Wallets?
In simple terms, a crypto wallet is a digital vault for storing any of the hundreds of popular cryptocurrencies available on the market. Technically, however, its first function isn’t to store cryptocurrencies; rather, it holds the private keys that give access to the cryptocurrencies.
Usually, wallets contain two types of keys: the private keys and the public key (also called the wallet address). The private keys allow the user to access and control their crypto assets.
Losing one’s private keys means losing one’s wallet and the assets therein. The public key, on the other hand, is a string of alphanumeric characters used to send or receive funds into the wallet.
Wallets can be classified in two ways: either based on where the private keys are stored or whether they are connected to the internet.

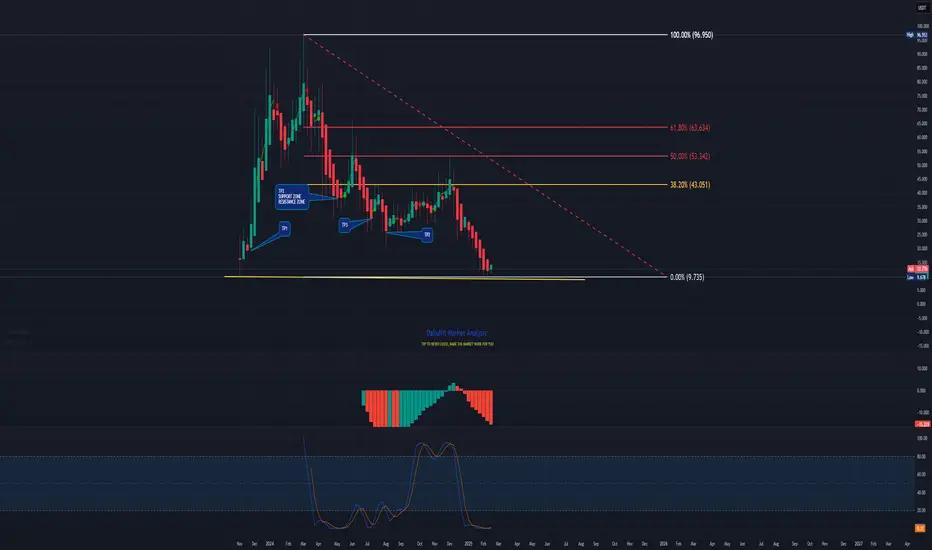
ORDIAs we can see, Ordi is oversold and sent to launch area, so knowing resistance zones i have called each one as TP points, if price will develop as it should at this point, i could say that my profit target it will be 40$.
very curious to see how market will develop by Monday, knowing that there is so much things going on on political field and also in the crypto world.
my trade will be only Spot for this token.
nfa
dyor
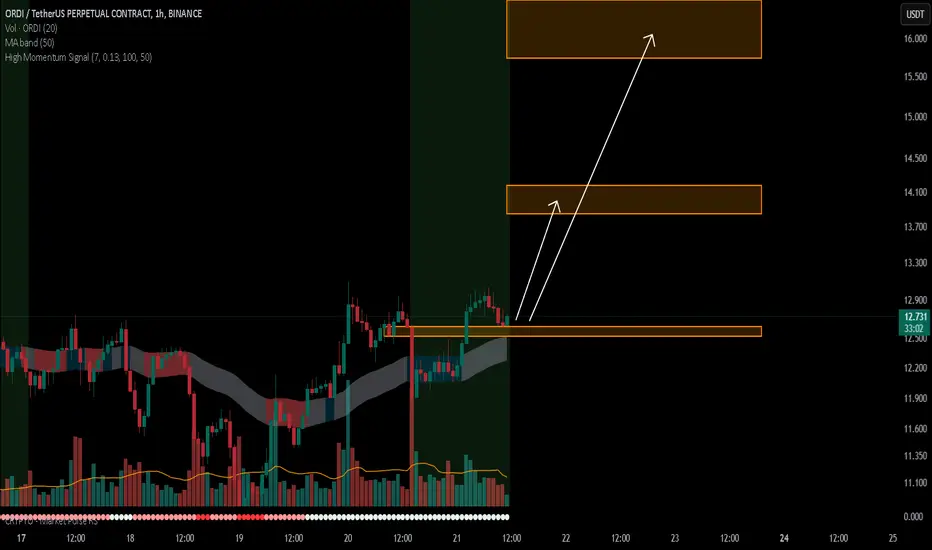
ORDI/USDTKey Level Zone: 12.520 - 12.620
HMT v6 detected. The setup looks promising, supported by a previous upward/downward trend with increasing volume and momentum, presenting an excellent reward-to-risk opportunity.
HMT (High Momentum Trending):
HMT is based on trend, momentum, volume, and market structure across multiple timeframes. It highlights setups with strong potential for upward movement and higher rewards.
Whenever I spot a signal for my own trading, I’ll share it. Please note that conducting a comprehensive analysis on a single timeframe chart can be quite challenging and sometimes confusing. I appreciate your understanding of the effort involved.
Important Note :
Role of Key Levels:
- These zones are critical for analyzing price trends. If the key level zone holds, the price may continue trending in the expected direction. However, momentum may increase or decrease based on subsequent patterns.
- Breakouts: If the key level zone breaks, it signals a stop-out. For reversal traders, this presents an opportunity to consider switching direction, as the price often retests these zones, which may act as strong support-turned-resistance (or vice versa).
My Trading Rules
Risk Management
- Maximum risk per trade: 2.5%.
- Leverage: 5x.
Exit Strategy
Profit-Taking:
- Sell at least 70% on the 3rd wave up (LTF Wave 5).
- Typically, sell 50% during a high-volume spike.
- Adjust stop-loss to breakeven once the trade achieves a 1.5:1 reward-to-risk ratio.
- If the market shows signs of losing momentum or divergence, ill will exit at breakeven.
The market is highly dynamic and constantly changing. HMT signals and target profit (TP) levels are based on the current price and movement, but market conditions can shift instantly, so it is crucial to remain adaptable and follow the market's movement.
If you find this signal/analysis meaningful, kindly like and share it.
Thank you for your support~
Sharing this with love!
HMT v2.0:
- Major update to the Momentum indicator
- Reduced false signals from inaccurate momentum detection
- New screener with improved accuracy and fewer signals
HMT v3.0:
- Added liquidity factor to enhance trend continuation
- Improved potential for momentum-based plays
- Increased winning probability by reducing entries during peaks
HMT v3.1:
- Enhanced entry confirmation for improved reward-to-risk ratios
HMT v4.0:
- Incorporated buying and selling pressure in lower timeframes to enhance the probability of trending moves while optimizing entry timing and scaling
HMT v4.1:
- Enhanced take-profit (TP) target by incorporating market structure analysis
HMT v5 :
Date: 23/01/2025
- Refined wave analysis for trending conditions
- Incorporated lower timeframe (LTF) momentum to strengthen trend reliability
- Re-aligned and re-balanced entry conditions for improved accuracy
HMT v6 :
Date : 15/02/2025
- Integrated strong accumulation activity into in-depth wave analysis
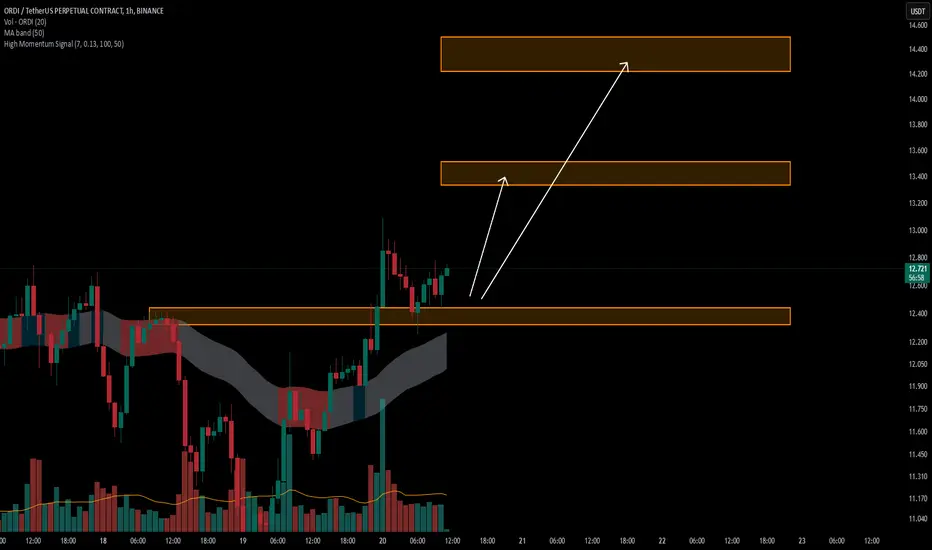
ORDI/USDTKey Level Zone: 12.320 - 12.440
HMT v6 detected. The setup looks promising, supported by a previous upward/downward trend with increasing volume and momentum, presenting an excellent reward-to-risk opportunity.
HMT (High Momentum Trending):
HMT is based on trend, momentum, volume, and market structure across multiple timeframes. It highlights setups with strong potential for upward movement and higher rewards.
Whenever I spot a signal for my own trading, I’ll share it. Please note that conducting a comprehensive analysis on a single timeframe chart can be quite challenging and sometimes confusing. I appreciate your understanding of the effort involved.
Important Note :
Role of Key Levels:
- These zones are critical for analyzing price trends. If the key level zone holds, the price may continue trending in the expected direction. However, momentum may increase or decrease based on subsequent patterns.
- Breakouts: If the key level zone breaks, it signals a stop-out. For reversal traders, this presents an opportunity to consider switching direction, as the price often retests these zones, which may act as strong support-turned-resistance (or vice versa).
My Trading Rules
Risk Management
- Maximum risk per trade: 2.5%.
- Leverage: 5x.
Exit Strategy
Profit-Taking:
- Sell at least 70% on the 3rd wave up (LTF Wave 5).
- Typically, sell 50% during a high-volume spike.
- Adjust stop-loss to breakeven once the trade achieves a 1.5:1 reward-to-risk ratio.
- If the market shows signs of losing momentum or divergence, ill will exit at breakeven.
The market is highly dynamic and constantly changing. HMT signals and target profit (TP) levels are based on the current price and movement, but market conditions can shift instantly, so it is crucial to remain adaptable and follow the market's movement.
If you find this signal/analysis meaningful, kindly like and share it.
Thank you for your support~
Sharing this with love!
HMT v2.0:
- Major update to the Momentum indicator
- Reduced false signals from inaccurate momentum detection
- New screener with improved accuracy and fewer signals
HMT v3.0:
- Added liquidity factor to enhance trend continuation
- Improved potential for momentum-based plays
- Increased winning probability by reducing entries during peaks
HMT v3.1:
- Enhanced entry confirmation for improved reward-to-risk ratios
HMT v4.0:
- Incorporated buying and selling pressure in lower timeframes to enhance the probability of trending moves while optimizing entry timing and scaling
HMT v4.1:
- Enhanced take-profit (TP) target by incorporating market structure analysis
HMT v5 :
Date: 23/01/2025
- Refined wave analysis for trending conditions
- Incorporated lower timeframe (LTF) momentum to strengthen trend reliability
- Re-aligned and re-balanced entry conditions for improved accuracy
HMT v6 :
Date : 15/02/2025
- Integrated strong accumulation activity into in-depth wave analysis
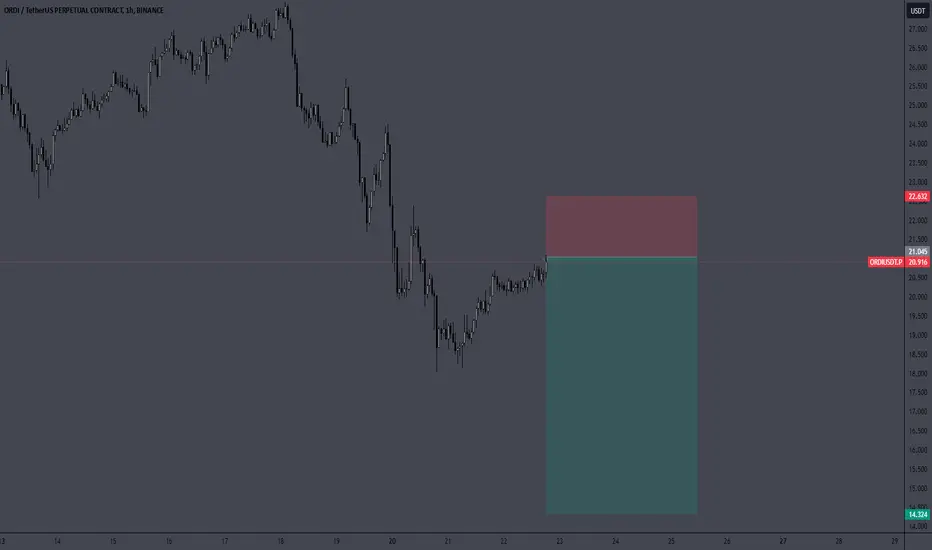
ORDI buy/long setup (2H)Notice: This coin is highly volatile and somewhat risky—trade with caution.
After a sharp drop, it has formed a ranging zone. As long as no candle closes below the previous low, we can look for buy/long positions in the lower order blocks, as there are sell orders in the swap zone and above, aiming to push the price lower.
Note: Enter positions only within the demand zone, not higher.
Targets are marked on the image.
A daily candle closing below the invalidation level will invalidate this analysis.
Do not enter the position without capital management and stop setting
Comment if you have any questions
thank you

ORDI Reversal....possible or not!!!!!The Ordinals protocol has garnered attention for integrating NFTs into the Bitcoin ecosystem, allowing for the creation of unique digital assets known as "Ordinal Inscriptions" on satoshis
There you have a full cycle.
A bullish impulse followed by a long-term correction.
After this long-term correction, a new cycle can develop.
The next move is a bullish move, a bullish wave, a bullish trend. Higher highs and higher lows; long-term growth.
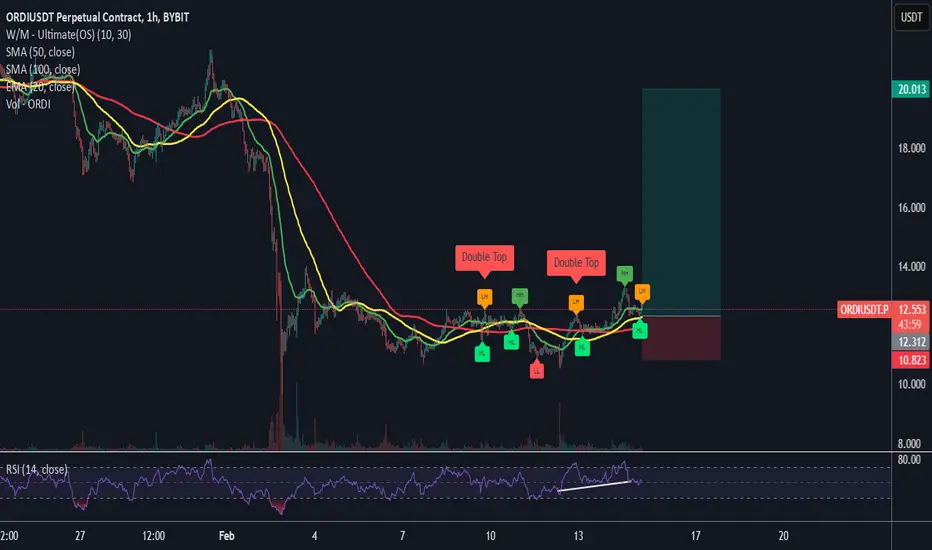
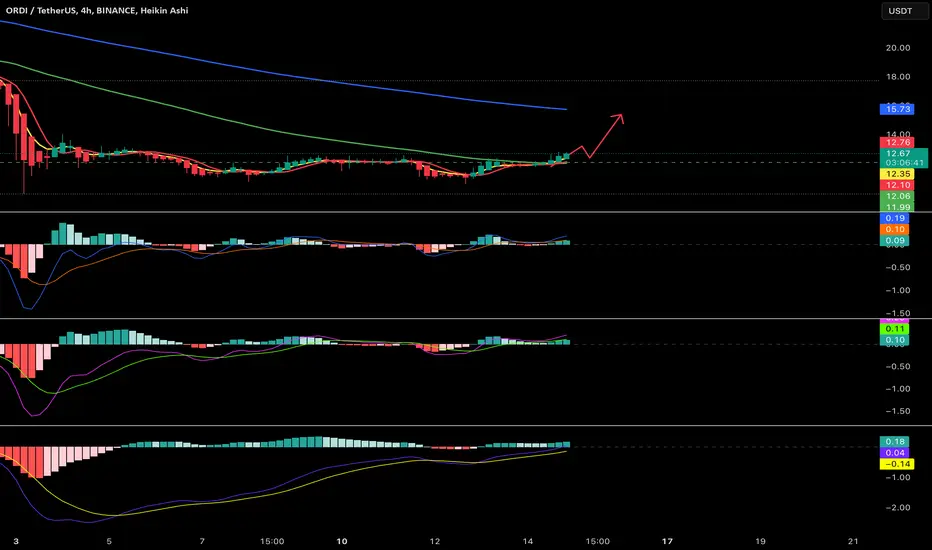
1️⃣ Break Above EMA 20 & SMA 50 – Reclaiming $14.50+ with volume would be an early sign.
2️⃣ Higher Lows & Higher Highs – A HL above $12 and a HH above $14.50-15 would confirm trend reversal.
Key Considerations for Entry:
✅ Current Price (~$12.67) Near Historical Support – ORDI is near a major correction low, making it an attractive entry if accumulation is happening.
✅ RSI Showing Strength – A bullish RSI divergence hints at possible momentum shift.
✅ Market Structure Reset – If ORDI breaks above $14.50–15 with strong volume, it signals a new uptrend.
Potential Trade Plan:
🔹 Aggressive Entry: Accumulate near $12–$13 with a stop-loss below the recent low (~$11).
🔹 Conservative Entry: Wait for a break above $15 (confirming trend shift) before entering.
🔹 Profit Targets: $25, $50, $100, and $252 (long-term).
Ordinals: Full AnalysisThis pair/project is always very interesting to me as I love everything Bitcoin. It is just intriguing...
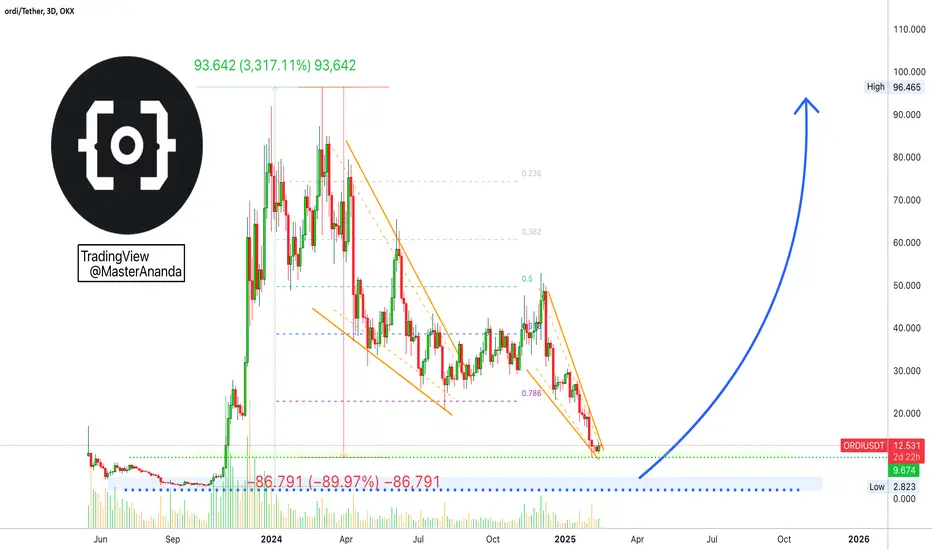
Ordinals (ORDIUSDT) went through a full correction. The growth period preceding it was just awesome with a massive 3,317% growth from bottom to top. The correction that followed removed 90% of all these gains. The low happened below the 0.786 Fib. retracement level and lasted 336 days or 11 months, assuming it already ended with the last low.
There you have a full cycle.
A bullish impulse followed by a long-term correction.
After this long-term correction, a new cycle can develop.
The next move is a bullish move, a bullish wave, a bullish trend. Higher highs and higher lows; long-term growth.
The correction ended as a higher low compared to the bottom that was hit in 2023. This higher low in 2025 tells us that there is potential for a new All-Time High when the current bull-market that is now starting fully develops.
This new ATH can reach as high as $252 if the bull-market develops in a normal and standard way. It can also go higher but our concern right now is with a great entry price and great entry timing. This we have for sure.
How to approach this pair?
This is the easiest part right now. This is the best part.
Buy and hold. We are now in the accumulation phase and accumulation zone.
For the next few days, weeks or months, for as long as it takes for the market to break bullish and move up; that's the buy and hold zone. Once the action starts to happen, we just enjoy the ride and plan an exit strategy: When to take profits and by how much?
Growth potential is huge.
I am wishing you the best.
Thanks a lot for your continued support.
Feel free to message me if you have any questions.
Namaste.
BUY SPOT SCALPING ORDIUSDT🚀 BUY SPOT SCALPING ORDIUSDT
📢 Short-term scalping setup for ORDIUSDT – Time-sensitive execution!
📌 Trade Setup & Market Outlook
✔ Scalping spot trade with a 1-2 day timeframe
✔ Strict trade management required, as the signal expires after 1-2 days if the target isn’t met
📌 Trade Plan
📍 Trade Type: Scalping Spot (Short-Term)
📍 Entry Point: $12
📍 Target: $15 (~30% gain)
📍 Hold Time: 1-2 days, after which the signal is automatically invalidated
📍 Capital Allocation: Designed for short-term gains, enter & exit quickly
💡 Key Considerations
📍 Monitor price action closely for rapid execution
📍 Exit early if momentum weakens before reaching the target
📍 Use stop-loss protection to limit downside risk
🔥 ORDIUSDT is set for a quick scalping opportunity – Execute with precision! 🚀
ORDI / TetherUS Mine prediction, your ideasHello, dear traders,
like u see my prediction is bulish, u can take entry as I show on video and close after 1hour and 30min. first profit taker! Have a nice day!


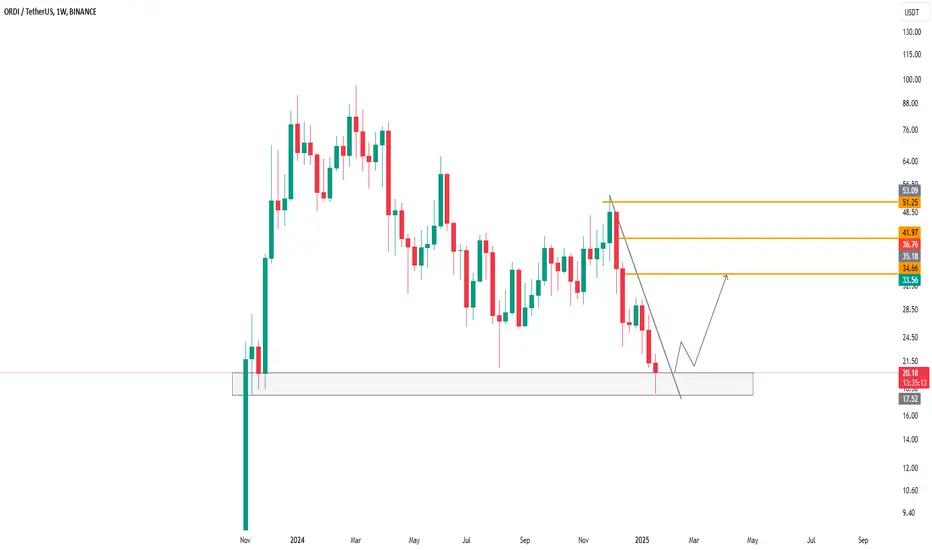
ORDI.USDT - 1WOrdi has reached its major support level, lvl 1. You can take a step to buy. It is worth it in the medium and long term.
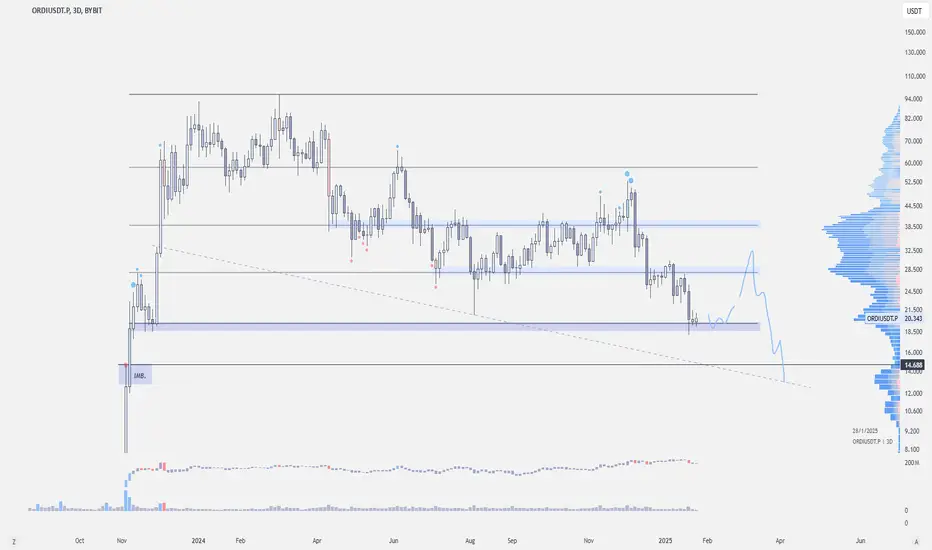
$ORDI - Imbalance at $14-ishThe price is currently holding $20, but there's an imbalance around 14s
We might see a bounce at the current level, but any rejection we get at 28-34s, would look to re-enter at 14s-12s
ORDI accumulation zoneHey, crypto enthusiasts! 🌟 Let's talk about ORDI today. 📉📊
In the accumulation zone, we're observing some interesting movements. There's a potential for further decrease, perhaps by another 30-40%, but it's already clear that accumulation is happening at rates higher than the current market price. 📈
On the daily chart, we can clearly see some significant divergences forming. This is a key indicator for those looking to position for a long play. 🚀 I'll be looking to enter positions about 20% lower than current levels, anticipating a robust upturn.
Keep your eyes on the charts and be ready to make your move! 🧐💼
#CryptoTrading #ORDI #InvestmentTips #MarketAnalysis
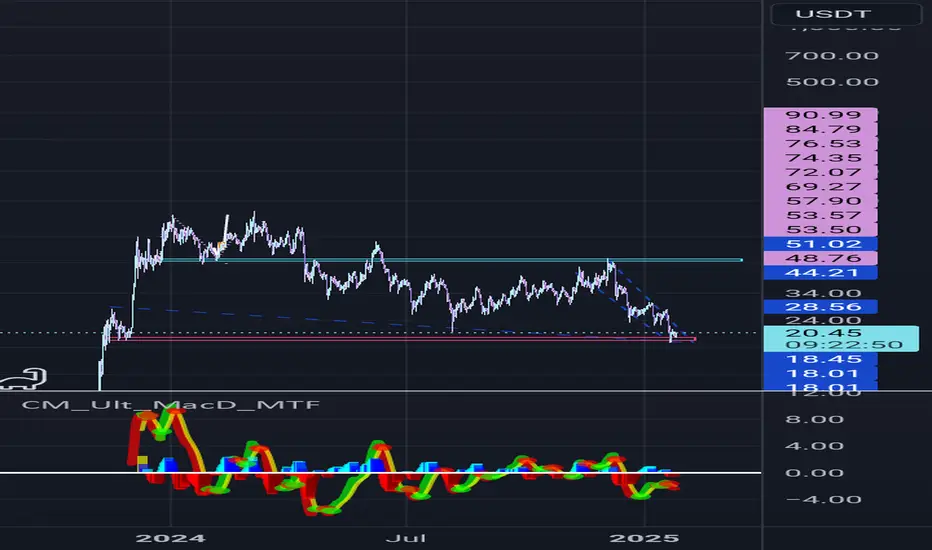
OrdiusdtAnother strong long term bullish divergence in the works here
Steep falling wedge/bullflag
Right into the yearly low
Technically a high fundamental project
Btc ordinals are one of the few apps networks guaranteed a long term lifeline in this market
However much better technology on other chains than btc but I'm sure there will be updates/upgrades given its btc
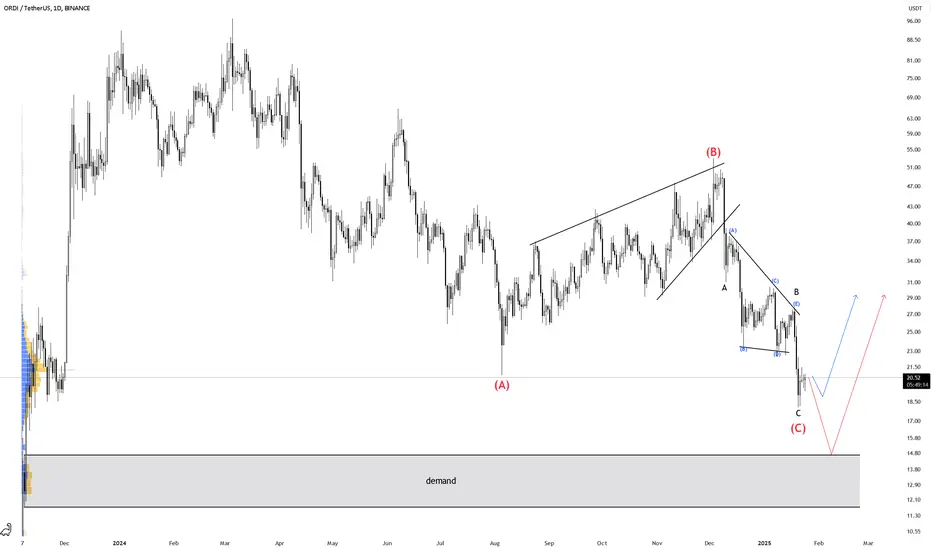
ORDI rising plan#ORDI made a huge correction in its bearish phase its waves tell us that its the end of correction but there is another scenario too its hitting the last demand zone so if you want to buy this coin its better to save 50% for the worse scenario !
Short squeezes before the final and biggest drop.As we can see, the entire market is practically falling, but this particular coin is rising. The market maker is misleading the crowd with promises of the long-awaited gains. But they won't happen. I'm taking a short for the final long squeeze. It will be an excellent short. By the way, the previous trade was fantastic—one of the best shorts in terms of execution.
Ordi is a Long Look at ordi.. 33$ calling. Ordi is in a buy program. It has reclaimed some levels and want to keep pushing it higher. Btc might be correcting but some coins have to regain ground
ORDIUSDT 4DORDI ~ 4D
#ORDI This is the key support that needs to be maintained. If you still have Conviction on this coin,. Small quantity purchases from here are not so bad. target 20%++
