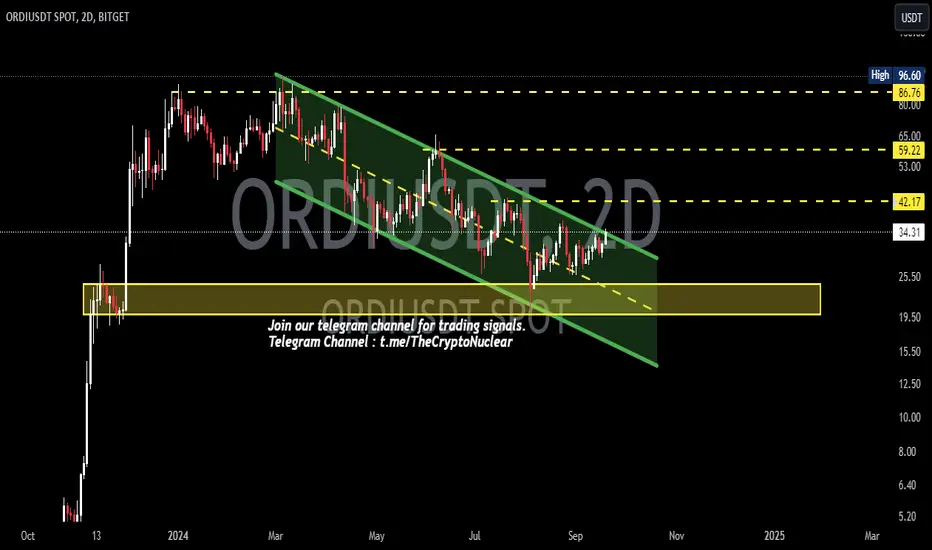
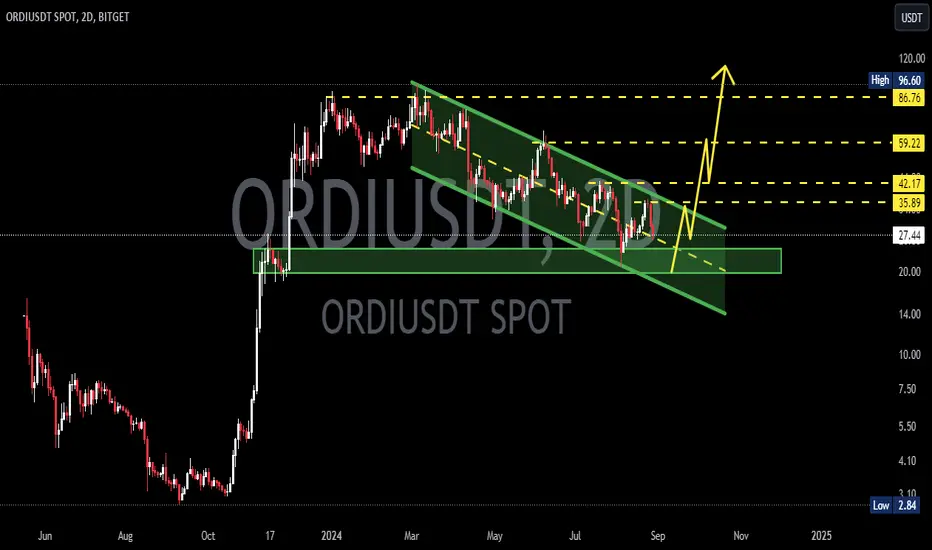
ORDIUSDTORDI ~ 2D ✅
#ORDI Ready to continue rising after successfully closing the price above the resistance of this descending pattern.
Rejection from here will make the price consolidate even longer in this descending pattern.
ORDIUSDT.P trade ideas
#ORDI 86 % EXIT PUMP Loading..#ORDI 86 % EXIT PUMP Loading..
All Retracement and Buy Back Completed. Now It's TARGET Time ONLY.
ORDIUSDT: BULL FLAG FORMATION, 30X GAIN EXPECTED!!Join our community and start your crypto journey today for:
In-depth market analysis
Accurate trade setups
Early access to trending altcoins
Life-changing profit potential
Hello everyone,
I'm curating a list of promising projects to hold for the upcoming bull run.
1. FETUSDT (already posted)
2. ONDOUSDT (already posted)
3. AAVEUSDT (already posted)
4. ANKRUSDT (already posted)
5. ORDIUSDT
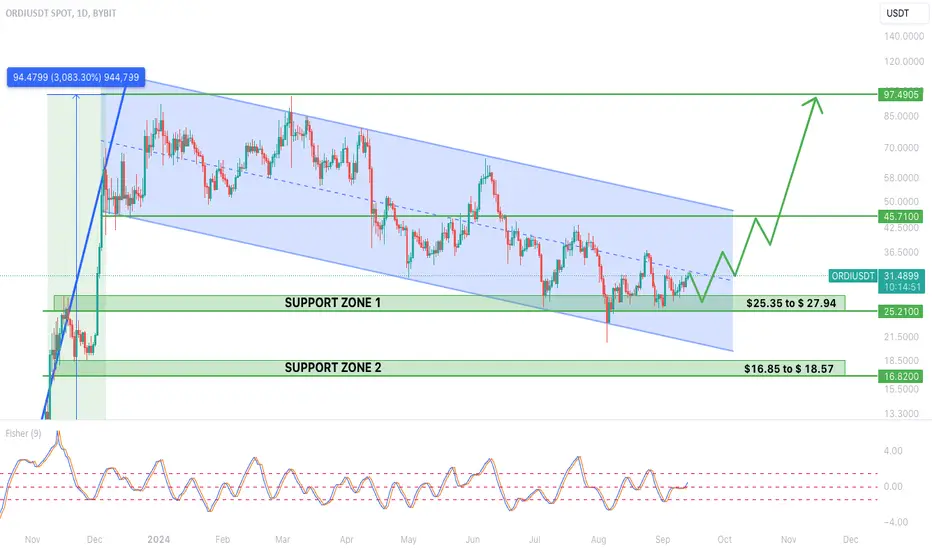
Let's analyse ORDIUSDT both fundamentally and technically.
FUNDAMENTAL ANALYSIS:
The Ordinals Protocol enables the creation of non-fungible tokens (NFTs) directly on the Bitcoin blockchain. By inscribing data onto individual satoshis (the smallest Bitcoin units), it allows unique digital assets to be represented and traded on Bitcoin's base layer. This approach leverages Bitcoin's security and decentralization, offering a new method for creating digital collectibles and assets. Unlike NFTs on other blockchains, Ordinals operate directly on Bitcoin, ensuring permanence and immutability. As a recent innovation, the Ordinals Protocol opens new possibilities for digital art and asset management within Bitcoin’s established framework.
TECHNICAL ANALYSIS:
ORDIUSDT has exhibited a strong uptrend, likely fueled by its solid fundamentals. The formation of a bullish flag pattern on the weekly chart suggests a continuation of this upward momentum.
Despite a recent consolidation phase, ORDI has demonstrated remarkable growth, gaining over 3000% in just 77 days. This highlights its underlying strength.
Technical Analysis:
Fibonacci Retracement: Key levels identified for potential accumulation based on Fibonacci retracement.
Bullish Flag: The chart pattern indicates a potential continuation of the uptrend.
Buying Levels:
$25.35 to $ 27.94
$16.85 to $ 18.57
Target Levels:
$45.7
$97.5
$214
$355
If you find this analysis helpful, please hit the like button to support my content! Share your thoughts in the comments and feel free to request any specific chart analysis you’d like to see.
Happy Trading!!
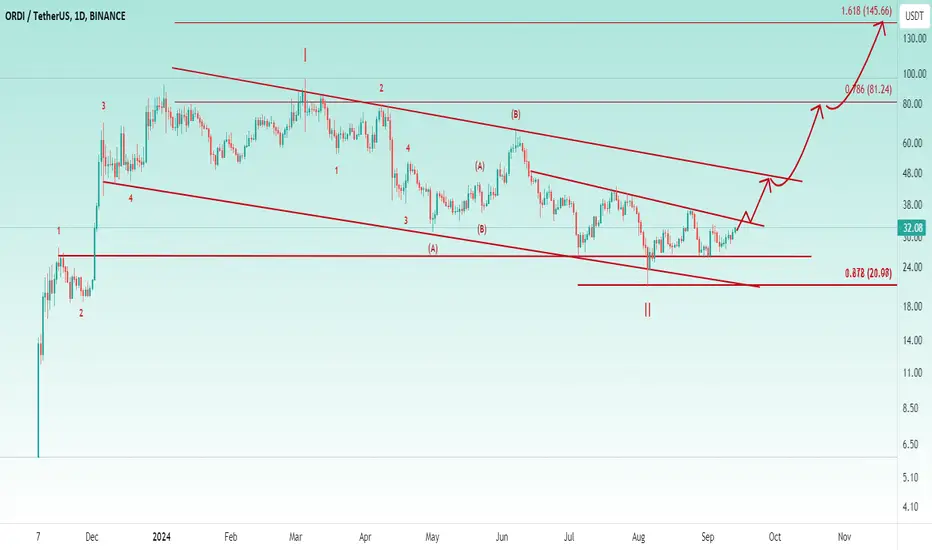
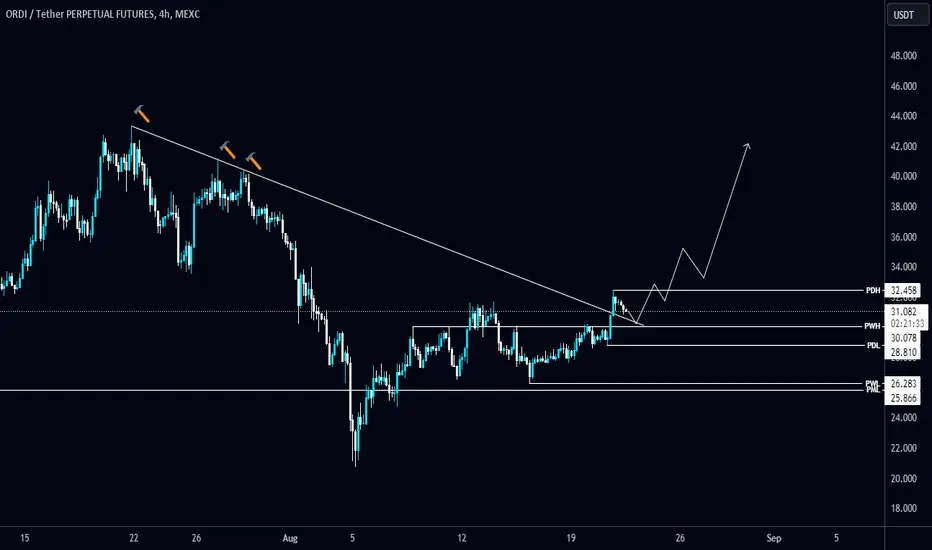
Bullish Setup And Wave 3 Is About To Start 📈 Perfect Bull Flag Formed At The Chart By The Clear ABC Formation And Wave C From 2 Completed At 21$ And We Had a Good Bounce From That Area, Currently Seems Wave 3 Is Started ,34$ and 49$ Are Next Important Resistance Levels Before Main Breakout From The Bull Flag Trend Line, Totally ORDI Setup Is Bullish
ORDIUSDTHi
we can see an order block on 27, & liquidity is needed to contionue the growth...
ichi system & price action both are giving us the signal for sell this!!
please give me your opinion about my TA
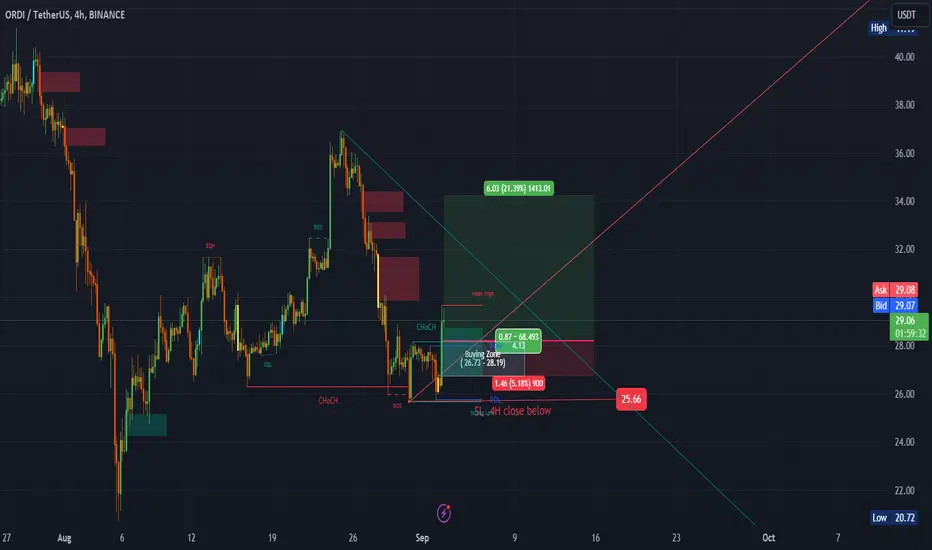
#ORDI entry range ( 26.73 - 28.19) for 20% profit (34.22)#ORDI
entry range ( 26.73 - 28.19)
20% Target (34.22)
SL .4H close below 25.66
#ORDI
SEED_DONKEYDAN_MARKET_CAP:ORDI
#ORDIUSDT
#ORDIUSD
#swingtrade
#shortterminvestment
#ALTCOIN
#Cryptotading
#cryptoinvesting
#investment
##trading
#cryptocurrencytrading
#bitcoininvestments
#Investing_Coins
#Investingcoins
#Crypto_investing
#Cryptoinvesting
**** #Manta ,#OMNI, #DYM, #AI, #IO, #XAI , #ACE #NFP #RAD #WLD #ORDI ****
#bitcoin
#BTC
#BTCUSDT
BINANCE:ORDIUSDT
ORDI PriceRising by 5% in the past seven days, ORDI crypto is attempting to break the falling channel and looking to cross the upper trendline hurdle of $30.
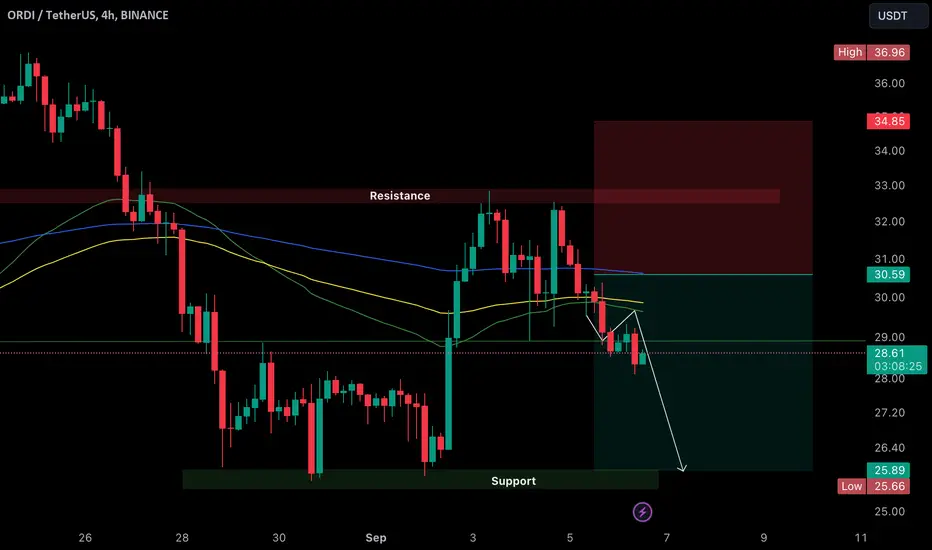
#ORDI/USDT ANALYSIS T: F 4H#ORDI has been trading below its Resistance Zone of $32 for some time now, and the latest price development has pushed it further down to $29.84, below the 200 M.A.
Considering the current scenario the price is expected to continue its Bearish move, most likely to test its previous swing low of around $25.
Hit 🚀 if you guys like my simple-to-understand analysis!
#NFA
#DYOR
ORDI Price Update & Analysis in a Daily Timeframe.Hello everyone, I’m Cryptorphic.
I’ve been sharing insightful charts and analysis for the past seven years.
Follow me for:
~ Unbiased analyses on trending altcoins.
~ Identifying altcoins with 10x-50x potential.
~ Futures trade setups.
~ Daily updates on Bitcoin and Ethereum.
~ High time frame (HTF) market bottom and top calls.
~ Short-term market movements.
~ Charts supported by critical fundamentals.
Now, let’s dive into this chart analysis:
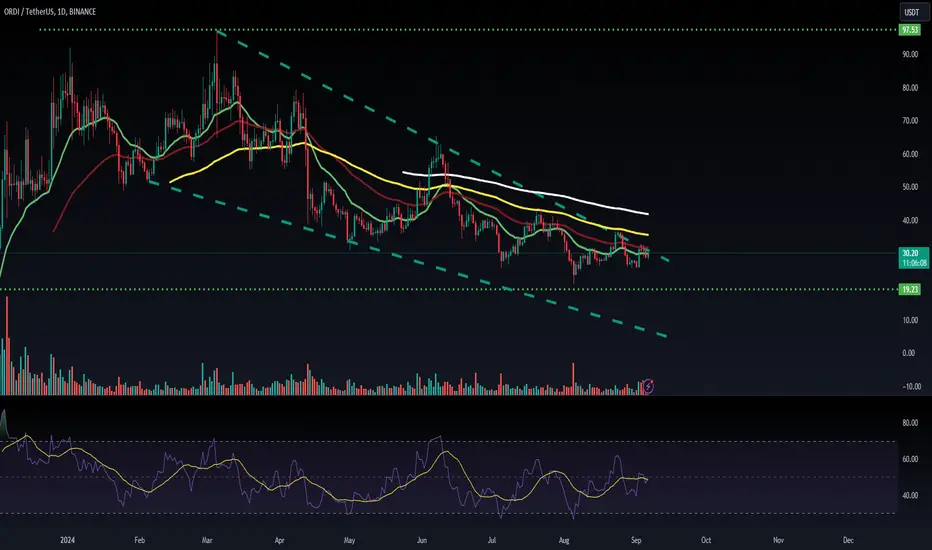
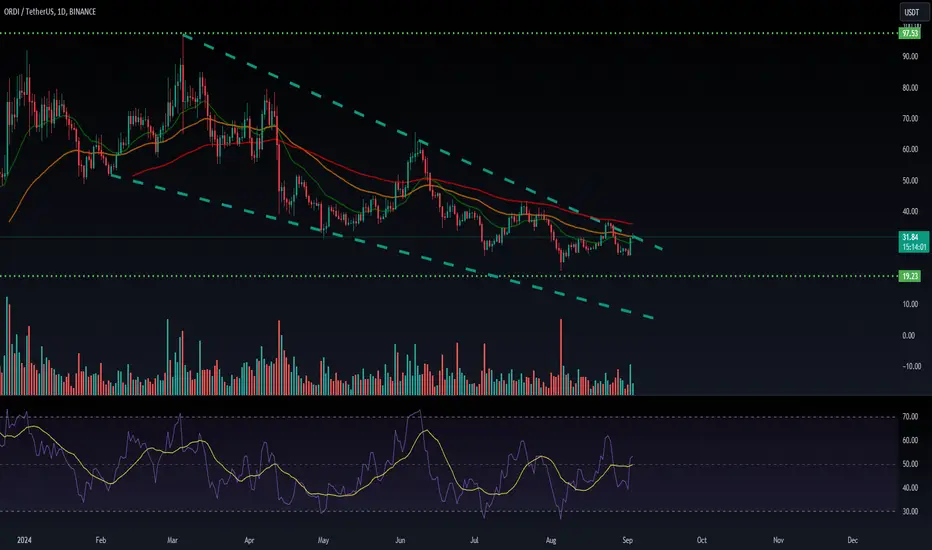
ORDI held the $25.70 support well and showed a decent rebound. It is currently facing resistance at the 50 EMA. If ORDI breaks above the EMA, it will still need to contend with the resistance trendline around $40-$41.
The lower support range between $18.40 and $21.40 is a good accumulation zone if the price dips. The RSI is in the middle band, so any move on ORDI could be significant. To reach its all-time high, ORDI would need a 2x-3x gain from the current market price.
Key levels:
- Primary Support: $25.70.
- Lower Support/Accumulation Range: $18.40 and $21.40.
- Primary Resistance: $31.88.
- Secondary Resistance: $40-$41.
- Long-term Target: $97-$100.
DYOR, NFA.
Please hit the like button to support my content and share your thoughts in the comment section. Feel free to request any chart analysis you’d like to see!
Thank you!
#PEACE

ORDIUSDTmy entry on this trade idea is taken from a point of interest BELOW an inducement.. I extended my stoploss area to cover for the whole swing as price can target the liquidity there before going as i anticipate.. just a trade idea, not financial advise

ORDI priceORDI showed a rise in bullish momentum and could see a potential breakout shortly. Accompanied by a volume spurt of over 130%, a gigantic price surge of over 22% was recorded in the intraday session.
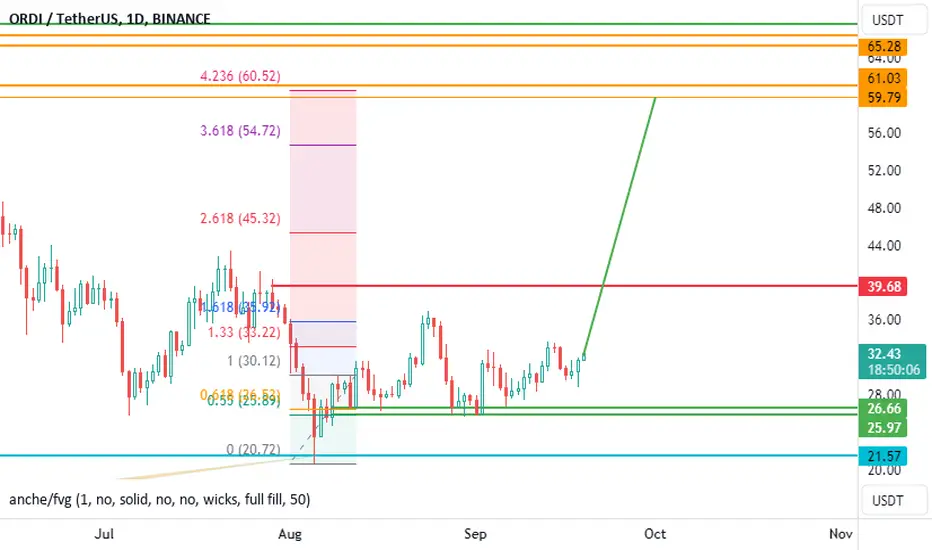
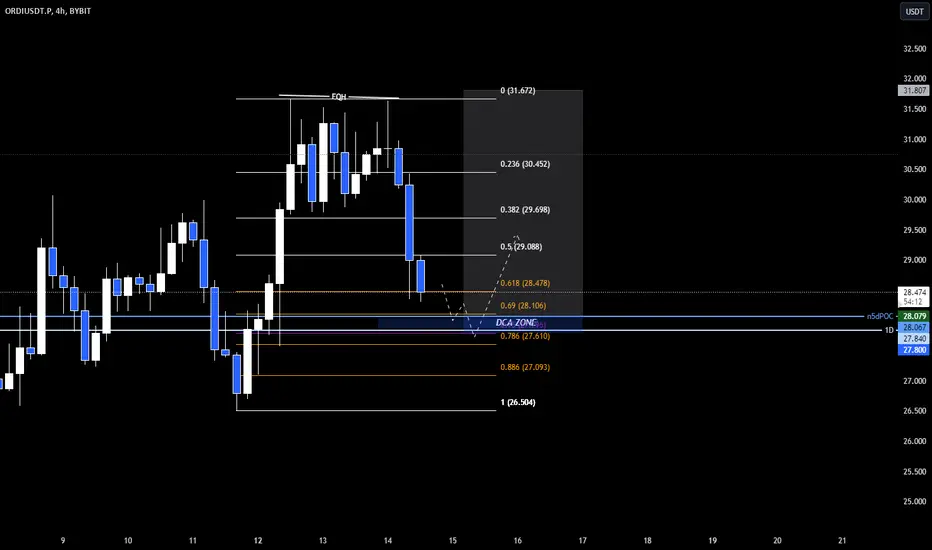
ORDIHello, friends!
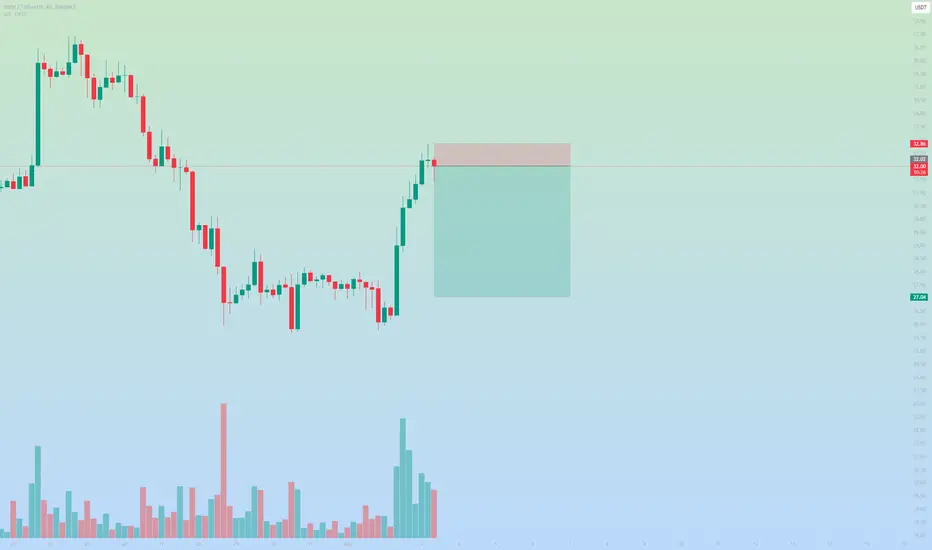
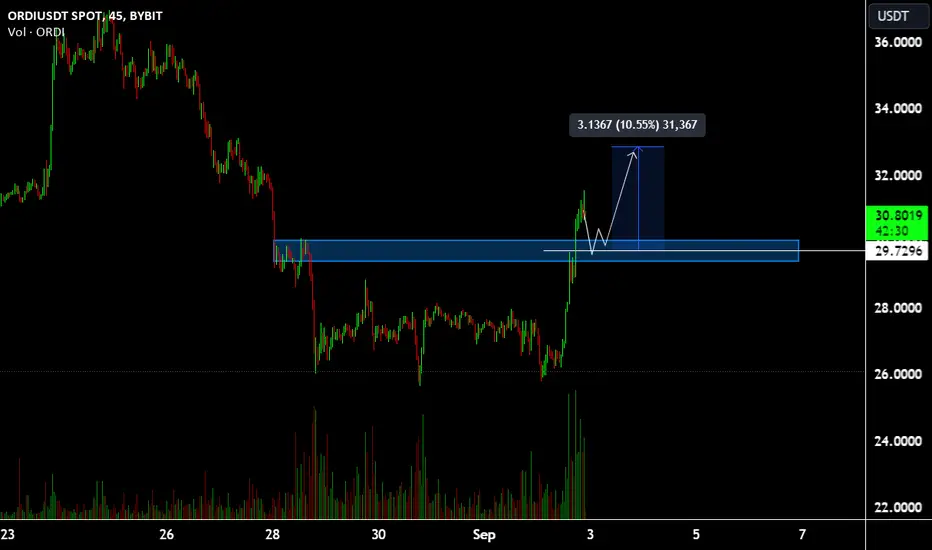
Today, we are looking at an interesting situation with the ORDI asset. On the chart, we can see that the price has broken through the previous accumulation zone and continues to rise. The important zone for us remains the 29.72-30.55 level, where the price is currently consolidating after a sharp upward impulse.
If the price holds above this zone, we can expect further growth. A potential target is the area around 32.80, which represents about a 10.55% potential profit.
The market looks favorable for growth, so keep a close eye on this level and wait for entry signals!
Buy Trade Idea for #ORDIDescription
Ordi Token (ORDI) is emerging as a significant player in the cryptocurrency market, backed by strong fundamentals and a unique approach to blockchain technology. Key factors that support a buy trade for ORDI include:
- **Innovative Technology:** ORDI is built on a next-generation blockchain that enhances transaction speed and scalability, offering a robust foundation for various decentralized applications (dApps) and smart contracts.
- **Growing Ecosystem:** The ORDI ecosystem is expanding rapidly, with increasing adoption among developers and businesses for building and deploying blockchain-based solutions. This growth is further fueled by strategic partnerships and collaborations.
- **Unique Use Cases:** ORDI provides unique utilities within its ecosystem, such as governance, staking, and transaction fee reduction, which attract both developers and investors looking for versatile use cases.
- **Strong Community Support:** ORDI has cultivated a vibrant and supportive community, contributing to its growing popularity and use. This community engagement is vital for sustaining long-term growth and adoption.
These robust fundamentals position ORDI as a compelling buy opportunity for investors looking to leverage the potential of an innovative cryptocurrency with a growing market presence.
Disclaimer
Trading and investing in cryptocurrencies involve significant risk and can result in substantial losses. The information provided here is for informational purposes only and should not be considered financial advice. Cryptocurrencies are highly volatile, and market conditions can change rapidly due to economic, regulatory, or other external factors. Always conduct thorough research, consider your risk tolerance, and consult with a financial advisor before making any investment decisions. Past performance is not indicative of future results, and investments can fluctuate in value.
ORDIUSDT.PORDIUSDT.P is in bullish trend.
Printing HH and HL.
No sign of reversal here.
We wait and watch for the breakout of last HH.

ORDIUSDTORDI ~ 2D
#ORDI If you have Conviction on this Coin,. You need to consider this support block., To start purchasing gradually. at least for a 20%+ increase
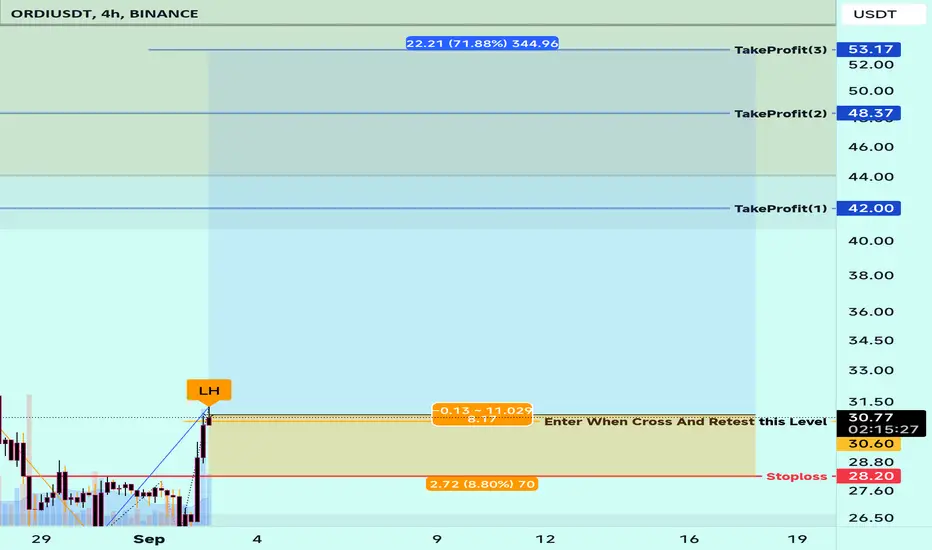
#ORDI/USDT breaks the Diagonal Trendline in 4-Hour TF!#ORDI/USDT breaks the Diagonal Trendline in 4-Hour TF!
SEED_DONKEYDAN_MARKET_CAP:ORDI is heading towards a retest, Wait for a successful retest to open a long position. The local support level is PWH $30.
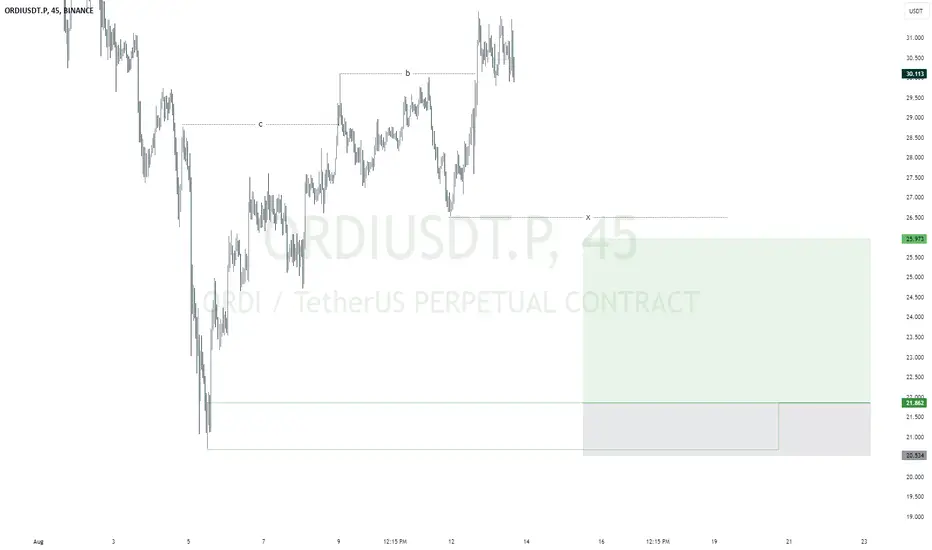
Ordinals | Accumulation Zone Briefly Activated (How To Trade)If just by a tiny bit, the "accumulation zone" for Ordinals has been activated. This is the yellow pattern drawn on the chart.
Ordinals is great but we are now looking at technical analysis and not fundamentals.
The drop on the 5th of August marks a major milestone. While not the end of the corrective move, it does signal that change is soon taking place. Volume was low on the drop; the correction is reaching its end.
We can say the correction ended but within the accumulation phase there can be swings and even lower lows. This is likely what is coming next.
There can be small swings to the upside as well but nothing major until next year, because this is one of the big pairs.
So, to be safe, wait for lower prices... Once lower prices are in, Nov.-Dec., we can consider jumping in. Like this, we secure lower long-term risk.
Lower prices can translate into higher, long-term potential profits.
Patience is key.
Ordinal is not ready yet, but in 2025, definitely a sure win.
Namaste.

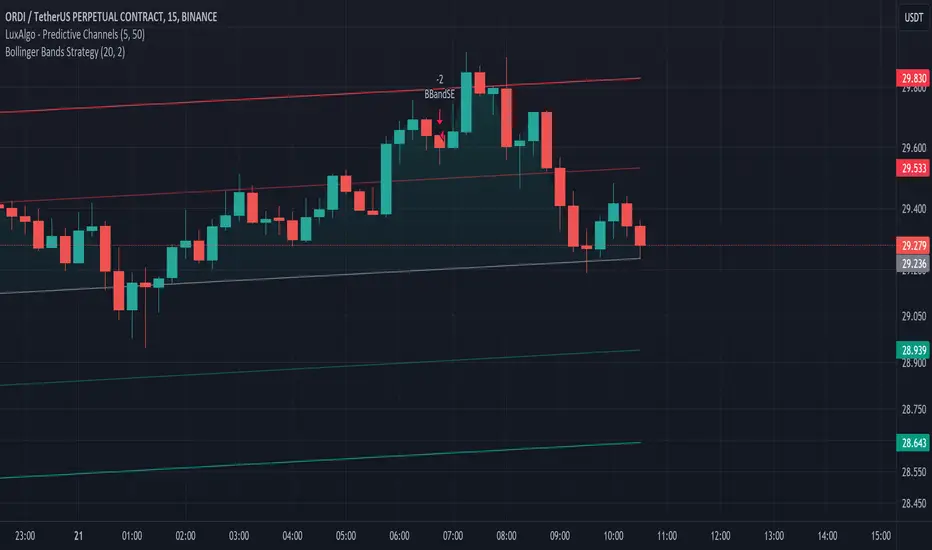
Breakout SignalsDYOR
this will actually check BB for breakouts and help you execute sells and buys in between based on the support and resistance bands.
do your own research; this is not a financial advice and actual losses might occur
ORDIUSDTmy entry on this trade idea is taken from a point of interest BELOW an inducement.. I extended my stoploss area to cover for the whole swing as price can target the liquidity there before going as i anticipate.. just a trade idea, not financial advise
ORDINALS (Y24.P2.Video1).Potential massive opportunityHi Traders.
This one is worth keeping an eye on and if it plays out to what I described, with conditions , we might find a x10 or more gem.
All the best,
S.SAri

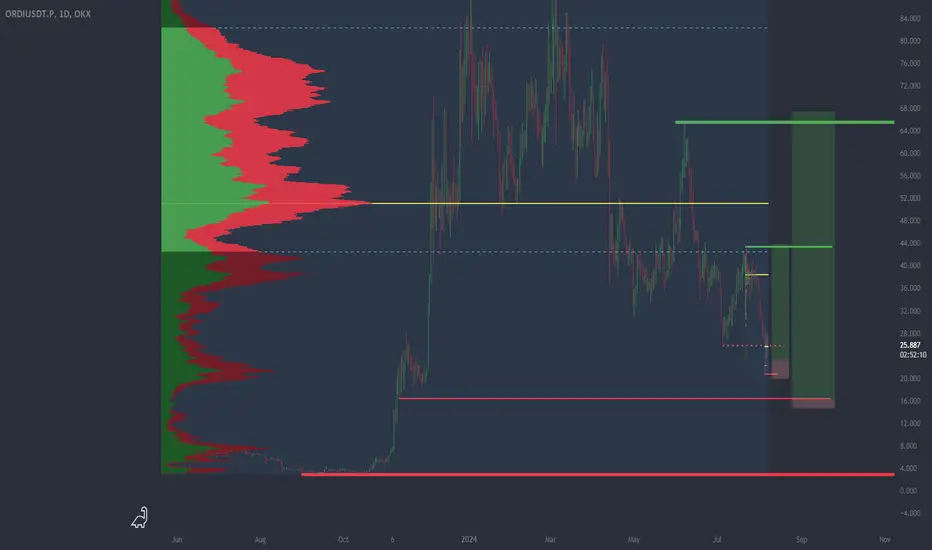
ORDI analysis Going to be starting BINANCE:ORDIUSDT.P with this All-Time Fibonacci
note the v.POC confluence with 0.5 Fib.
Focus on the current weekly candle structure; specifically, will we close above or below the previous sweep level at 25.8 ?
Volume node rotation visualized here:
You may also notice the 1D Sell-Side at 16.3, which may present an opportunity for longs if we lose the current low.
Showing the 1W S.F.P., but as a 30m F.A. with all the key levels to be watched. Starting with the local 0.5 Fib & v.VAL down to the poor lows & All-Time 0.786 Fib.
Also note the DMI at the bottom, D+ (green) crossing over D- (red) is a significant signal for bullish price action when combined with structure. For example: the crossover occurrs during a sweep of the 4H S.S. while creating a good low.
May act like dynamite go boom.
25 Day CC correlation is 0.95, require BTC to flip bullish first.
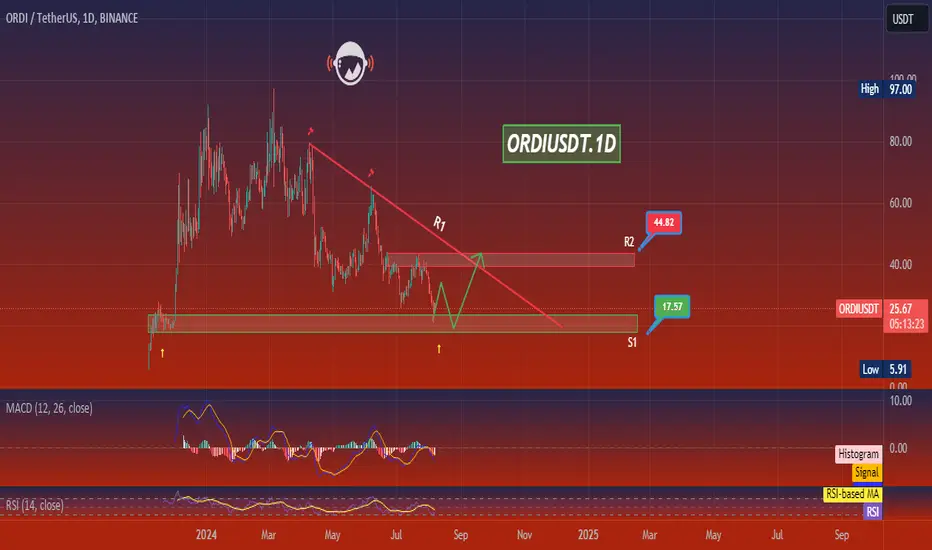
ORDIUSDT.1DIn my latest technical analysis of the ORDI/USDT daily chart, several critical indicators and price movements offer a nuanced perspective on potential future price action. First and foremost, it's notable that the Moving Average Convergence Divergence (MACD) is displaying a bearish momentum, as indicated by the MACD line residing below the signal line. The separation between these lines suggests that the bearish trend could persist in the short term.
The Relative Strength Index (RSI) is currently at 34.12, nearing the oversold territory but not quite there yet. This suggests that while the selling pressure has been significant, there could be room for more downside before the market considers the asset truly oversold and due for a potential rebound.
Examining the price action, ORDI/USDT has experienced a notable decline, establishing a recent low at $17.57, which I am considering as the current critical support level (S1). Looking forward, if this support holds, it may act as a springboard for a price correction or consolidation phase. The resistance levels to watch are at $44.82 (R2) and initially at $17.57 (R1), which is now a pivotal point for any bullish recovery.
Given the current technical setup, I predict that if the price manages to stabilize and rebound from the S1 level at $17.57, we could see a movement towards R1. This would require a shift in market sentiment and potentially positive developments related to the asset itself. However, should the support at $17.57 fail to hold, it would likely lead to further declines, potentially testing even lower historical supports.
In conclusion, the ORDI/USDT market currently shows bearish tendencies with a close watch on the $17.57 support level. A break below this level could exacerbate the bearish sentiment, while stabilization and a bounce back could pave the way for a retest of higher price levels. Traders should remain cautious and monitor these key technical levels closely, adjusting their strategies based on confirmed price actions and indicator signals.