ORDIUSDT CORRECTION TO THE $30Hello Traders,
I'm currently watching ORDIUSDT and I expect an interesting price movement in the coming days.
Key Levels:
Current Price: $26.88
Support Level: $24
Resistance Level: $30
Analysis:
Price Action: The price has been exhibiting a bearish trend recently, and I anticipate a drop to the $24 support level. This level has shown historical significance as a strong support zone.
Indicators:
RSI: Currently indicating overbought conditions, suggesting a potential for further downside.
MACD: Showing bearish divergence, supporting the case for a correction.
Volume: Decreasing volume on the recent uptrend indicates weakening buying pressure, which aligns with the expected drop.
Candlestick Formation: Watch for the formation of a bullish Luftwing candle around the $24 level. This specific candle pattern typically marks the beginning of significant buy interest, indicating a potential reversal.
Strategy:
Entry Point: Look for potential buy opportunities around the $24 support level, especially if a bullish Luftwing candle forms. This could be an ideal entry point if the price shows signs of reversal.
Target: $30. This is a key resistance level and could be the next target after the anticipated bounce from $24.
Stop Loss: Consider placing a stop loss below $22 to manage risk effectively.
Conclusion:
Keep a close eye on the $24 level for potential buying opportunities. The formation of a bullish Luftwing candle at this level could signal the start of a rally towards $30. As always, manage your risk and trade safely.
Happy Trading!
@thelastluftwaffe
ORDIUSDT.P trade ideas

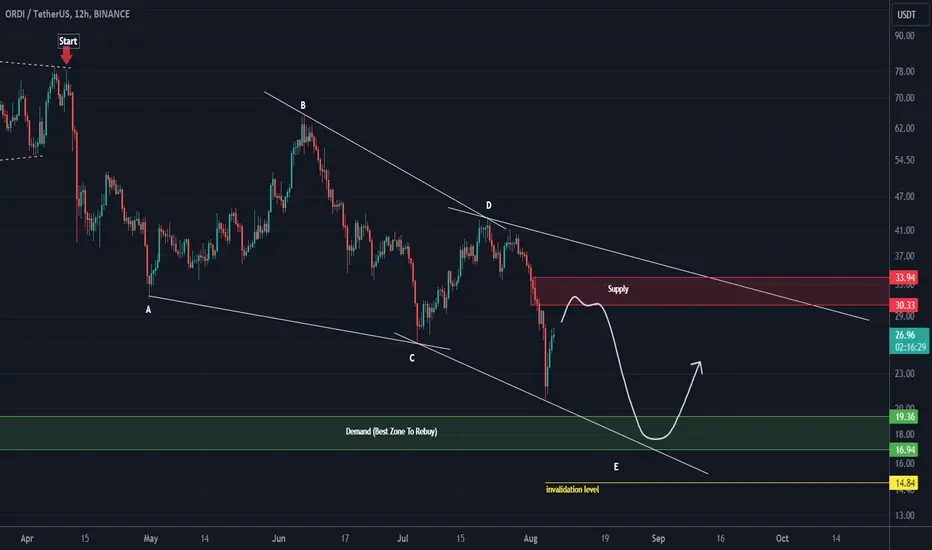
ORDI analysis (12H)From where we placed the red arrow on the chart, it seems that ORDI's correction has started.
This correction appears to be a diametric as we now appear to be in wave e.
From the supply range, it can be rejected downwards.
We are looking for buy/long positions on the green range.
Closing a daily candle below the invalidation level will violate the analysis.
For risk management, please don't forget stop loss and capital management
Comment if you have any questions
Thank You
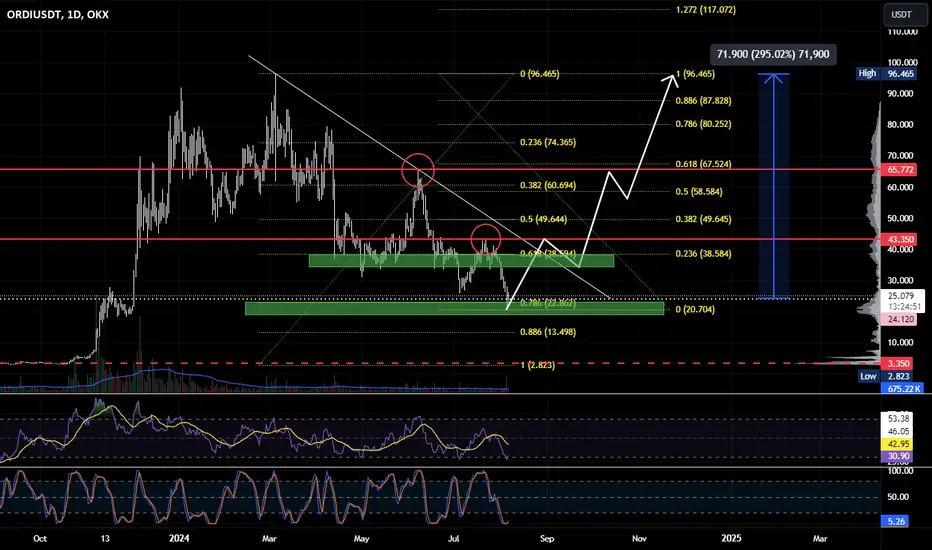
#ORDI #ORDIUSD #Ordinal correction reached buy zone @78.6% Fibo#ORDI #ORDIUSD #Ordinal correction reached buy zone at 78.6% Fibonacci , personally I take a long position at 24. 1st target at previous high 43.35
$ORDI/USDT pessimistic outlook, I do not invest anymore.I have invested and made good money trading SEED_DONKEYDAN_MARKET_CAP:ORDI for a while. I have ridden the rise and sold at $69, missing the peak and feeling bad at the time.
Now my sentiment about SEED_DONKEYDAN_MARKET_CAP:ORDI is very bearish, and I will explain why I will stop trading it. Here are several events that have happened and are red flags:
1. SEED_DONKEYDAN_MARKET_CAP:ORDI was created in March 2023 by Domo, an enigmatic blockchain analyst; he just posted it on Github, and it was adopted by the team developing Bitcoin code. Binance launched it nobody knows why,
2. SEED_DONKEYDAN_MARKET_CAP:ORDI does not have a proper website. The founder didn't make money out of it and is not supporting it.
3. SEED_DONKEYDAN_MARKET_CAP:ORDI does not have an identified legal entity, no budget, no tokenomics, no roadmap, and no ecosystem.
4. SEED_DONKEYDAN_MARKET_CAP:ORDI now has RUNE (not the Thorchain CRYPTOCAP:RUNE ), which has a questionable name and seems to be a modification of BRC-20 to make money out of it. I personally think that it is shady.
So SEED_DONKEYDAN_MARKET_CAP:ORDI is a VERY HIGH investment risk, manipulated by Binance, with no team, and no future, to be honest. Worse, RUNE seems to be a takeover by Casey Rodarmor, a Bitcoin dev, and the name he has chosen is not compatible with any exchange because it already exists with a top 50 token that is older and succesful!
What the hell is going on?
I think that $95 is the all-time high for this coin for its lifetime, which will dump into oblivion before the end of this bull run, with no fundamental attached to it, I do not see what can save it.
Of course, I might be wrong; some magic could happen, and some pump might occur, but the signs of imminent death are already showing. It has dumped 66%, one of the worst performances of all the top 100 cryptos since its ATH. It is not recovering.
Conclusion: Be very careful with this coin. It has been short-lived and is probably in the process of dying.
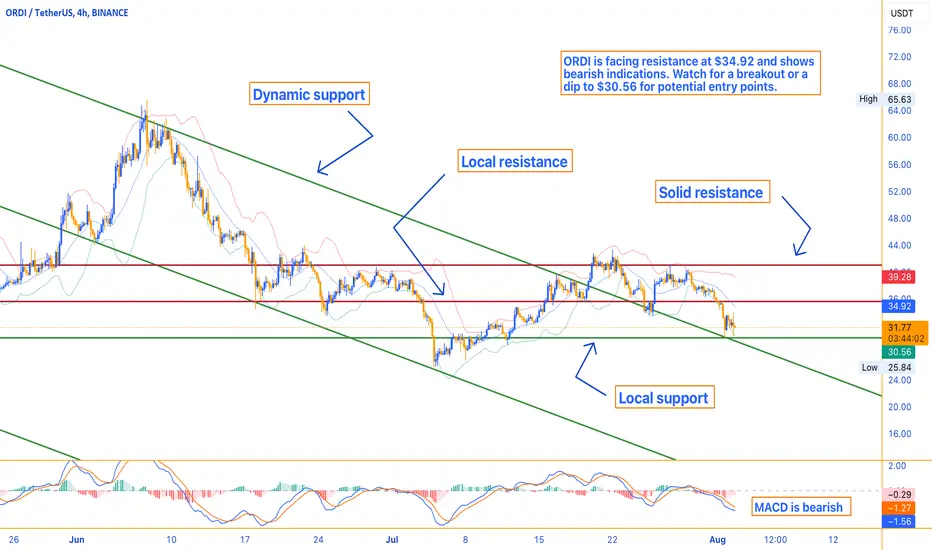
ORDI: Looking BearishThe market sentiment for ORDI is currently bearish. Recent technical indicators suggest caution due to potential downside risks.
The MACD is bearish, with the histogram at -0.29 and the MACD line at -1.56, indicating a strong bearish momentum.
With %K at 20.64 and %D at 24.66, the Stochastic Oscillator indicates oversold conditions, suggesting a potential for a short-term rebound.
The RSI is at 30.27, indicating that ORDI is in oversold territory, which could signal a potential reversal or consolidation.
Potential Market Scenarios
Bullish Scenario:
A break above the local resistance at $34.92 could lead to further upward movement, potentially targeting the solid resistance at $39.27. This move would likely confirm bullish momentum and attract more buyers.
Bearish Scenario:
If ORDI fails to break above the local resistance, it could retest the support levels at $31.80 and potentially fall to the dynamic support level at $30.56. A break below $30.56 could signal further declines, with $25.84 acting as the next support level.
Conclusion and Market Outlook
ORDI is currently positioned with significant support and resistance levels to watch. The bearish MACD and overall market activity suggest caution, as the potential for further declines exists. Monitoring the key resistance levels and potential support levels is crucial for making informed trading decisions.
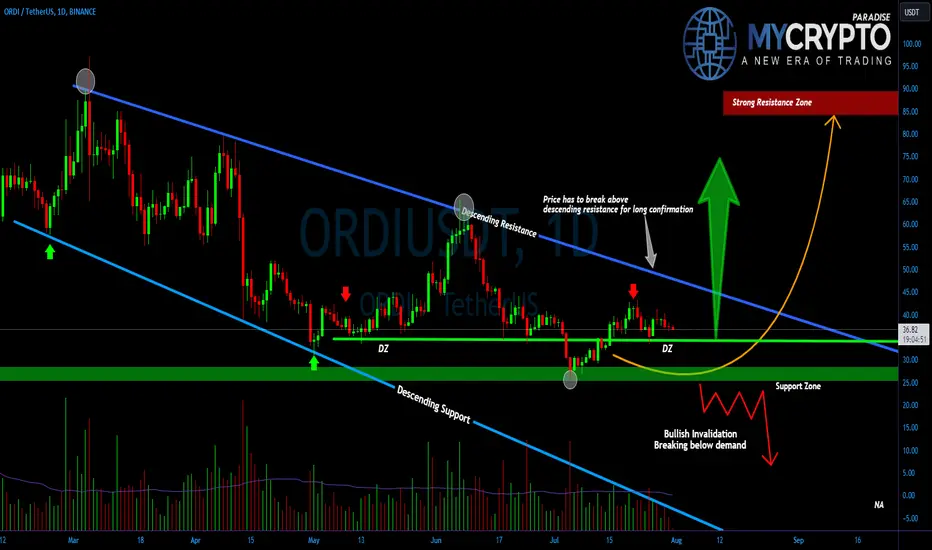
ORDIUSDT Poised for a Major Move Bullish Breakout or Bearish ?Yello Paradisers! Are we on the brink of a bullish breakout, or are we facing a potential bearish breakdown with ORDIUSDT? This cryptocurrency has been navigating a descending channel for a while, and it’s now at a critical juncture.
💎#ORDIUSDT is currently testing a crucial demand zone at $34.30. This level is significant because if the price can sustain above it, we might see a bullish breakout from the descending channel. The upper expansion of the channel also hints at growing bullish sentiment. However, as always, caution is warranted.
💎 If the price fails to hold above $34.30, our focus will shift to the next support level at $25.18. A break below this level could signal a bearish shift, invalidating the current bullish setup and potentially leading to a more substantial decline. This scenario underscores the importance of being prepared for both outcomes.
Remember, disciplined and well-planned trading is the key to consistent success. Stay focused and trade smart, Paradisers!
MyCryptoParadise
iFeel the success🌴
ORDI/USDT Triangle Bullish arrow ( Buy ) The triangle pattern has broken through the resistance line on July 27, indicating a potential bullish price movement. This breakout suggests a shift in market sentiment towards a more positive outlook. Over the next 7 days, we could see the price potentially rise towards 53.0260. This target is derived by measuring the height of the triangle at its widest point and projecting that distance from the breakout point. Traders should watch for confirmation signals and consider this potential trend in their trading strategies.
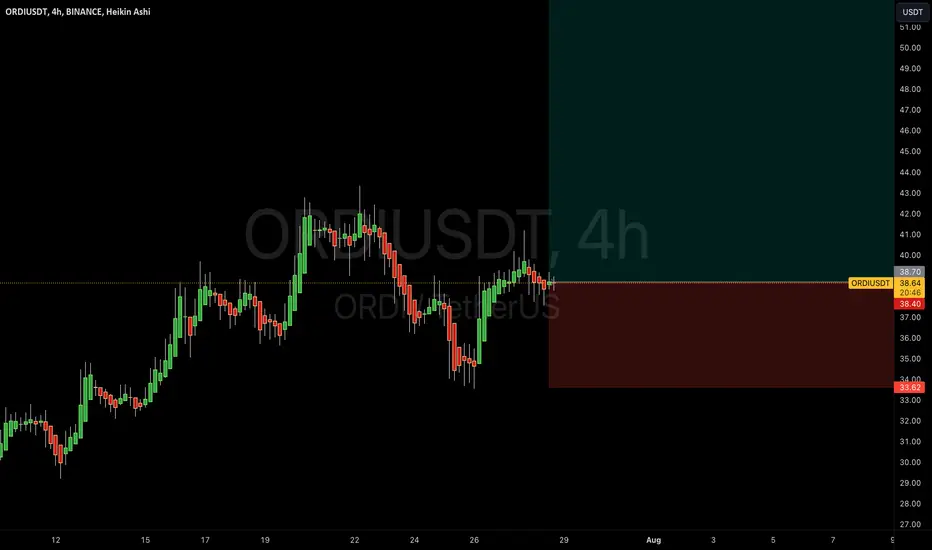
ORDIUSDTmy entry on this trade idea is taken from a point of interest BELOW an inducement.. I extended my stoploss area to cover for the whole swing as price can target the liquidity there before going as i anticipate.. just a trade idea, not financial advise
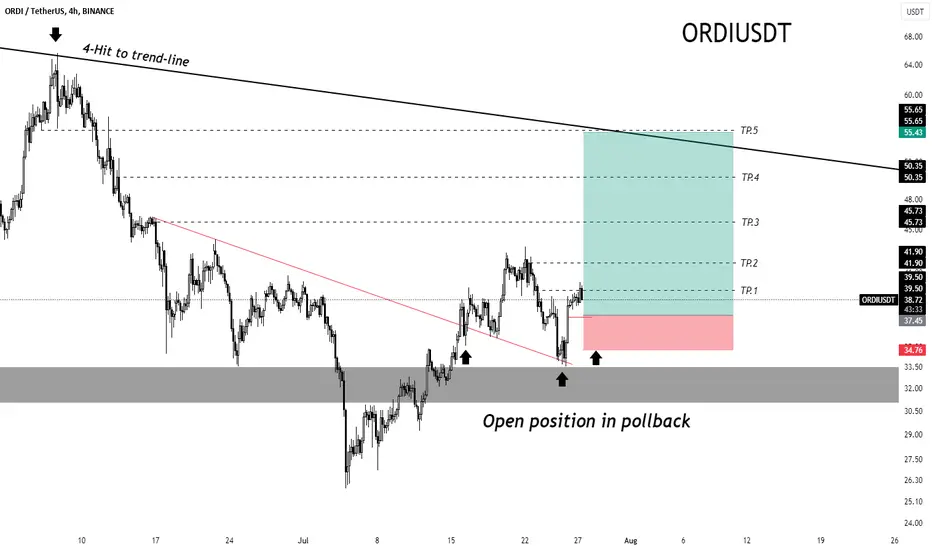
ORDI: wait best for candle🟢 Buy Signal for ORDIUSDT 🟢
📍 Entry Point: 38.89 USDT
🎯 Target Prices:
- TP1: 39.50 USDT 🥇
- TP2: 41.90 USDT 🥈
- TP3: 45.73 USDT 🥉
- TP4: 50.35 USDT 🏆
- TP5: 55.65 USDT 🏆
🔴 Stop Loss: 34.76 USDT
📈 Technical Analysis:
After the price hit the support zone and pulled back to the downtrend line, a favorable position for entering a buy trade has been established. Multiple target prices have been set at different levels.
This analysis are based on the provided chart and may need revision with market changes. Always consider risk management and trade only with capital you can afford to lose. 📊💡
ORDI Buy Trade Idea: Leveraging Ordinals' Innovative PotentialDescription
Ordinal (ORDI) offers a unique investment opportunity backed by its strong fundamental qualities. As an innovative cryptocurrency, ORDI aims to enhance the efficiency and security of blockchain transactions through its advanced protocol design. The project emphasizes scalability, aiming to handle a high volume of transactions while maintaining low fees, making it attractive for both users and developers. ORDI's focus on interoperability ensures seamless integration with various blockchain platforms, fostering a versatile ecosystem. With these robust fundamentals, ORDI is well-positioned for significant growth and adoption in the cryptocurrency market.
Disclaimer
Trading and investing in cryptocurrencies involve significant risks and can result in substantial losses. The content provided here is for informational purposes only and should not be considered financial advice. Always conduct your own research, consider your risk tolerance, and consult with a financial advisor before making any investment decisions. Past performance is not indicative of future results, and the value of investments can fluctuate widely.

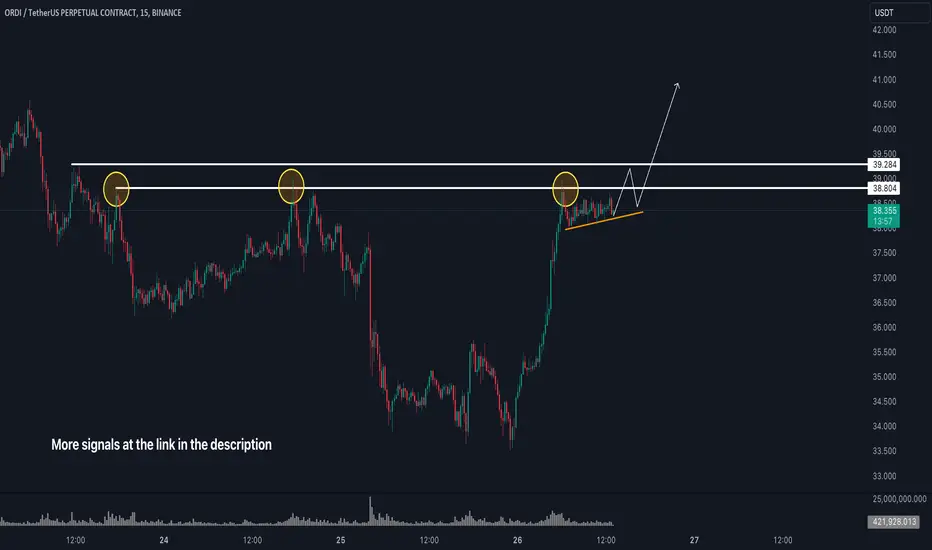
LONG #ORDIUSDTLONG #ORDIUSDT from $39.095 stop loss $38.871
15m TF. Two clear resistance levels were formed on the coin with a lot of touches, behind which the stops of participants who opened positions from them accumulated. There is also a buyer who pushes the price to update the highs, forming an active preload.
I am considering the formation of consolidation and movement due to stops.
1 TP — 39,473
2 TP — 39,850
3 TP — 40,130
MARKET EYES THE $30 PRICE REGIONSThe ORDIUSDT pair is under close scrutiny as it approaches the $30 mark. Here's a detailed analysis for our crypto community:
🔍 Market Trends:
ORDI has been showing signs of weakness, struggling to maintain recent gains.
The current downward momentum suggests potential further declines.
💡 Key Factors:
Technical Indicators: Moving averages and RSI are signaling a bearish trend, indicating potential selling pressure.
Resistance Levels: The key resistance level stands at $33, which has been a tough barrier to break.
Support Levels: There are no significant support levels nearby, making the market more vulnerable to further drops.
📊 Market Sentiment:
Overall market sentiment is turning bearish, with traders cautious about further declines.
Pay attention to any major news or events that could impact market sentiment and price action.
🔔 Trading Strategy:
For Bears: Consider short positions if the price fails to break the $33 resistance level. Target the $30 region, and monitor for signs of continued weakness.
For Bulls: Exercise caution and wait for a clear reversal signal before entering long positions. Without significant support, the market may continue to drop.
Stay informed with the latest analysis and trade carefully. Happy trading!
#ORDIUSDT #CryptoAnalysis #Trading #MarketUpdate #CryptoNews

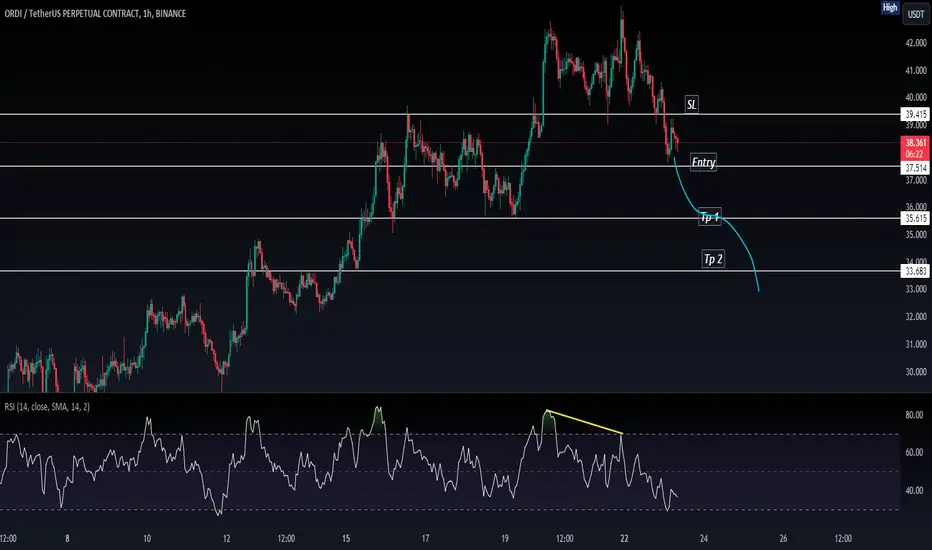
ORDIUSDT.PORDIUSDT.P is in bearish trend.
Potentially printing LH and LL.
Bearish divergence also shown in RSI.
We wait and watch for the breakout of last LL.
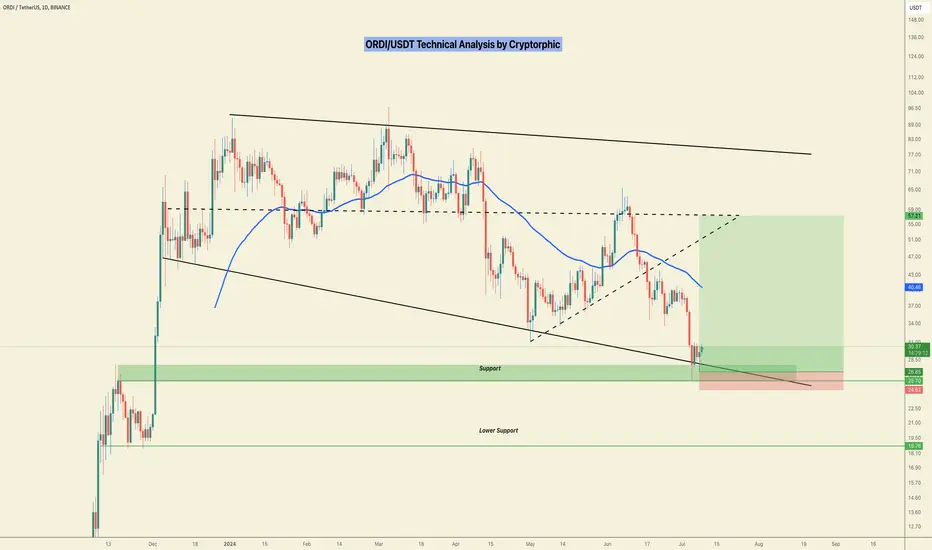
Alikze »» ORDI | Pullback to the broken area.?🔍 Technical analysis: Pullback to the broken area.?
- It is moving in a downward channel in the daily and 4H time frames.
- In the previous post , price reversal zones were identified, which after hitting PRZ-3, the price reversed and corrected the price up to the set targets.
- At present, according to the downward behavior and structure, the price correction can be continued.
- Therefore, if this price reversal cannot lead to the failure of the region, this reversal can be a pullback to the broken structure.
- So, we expect that the price will face selling pressure in response to the supply, first the price will be corrected to $25 and then the price correction will continue until the green box.
💎 Alternative scenario: if the price can break the supply range and stabilize above it, it can navigate the second movement path and move up to the red box range and the ceiling of the descending channel.
»»»«««»»»«««»»»«««
Please support this idea with a LIKE and COMMENT if you find it useful and Click "Follow" on our profile if you'd like these trade ideas delivered straight to your email in the future.
Thanks for your continued support.
Best Regards,❤️
Alikze.
»»»«««»»»«««»»»«««
BINANCE:ORDIUSDT

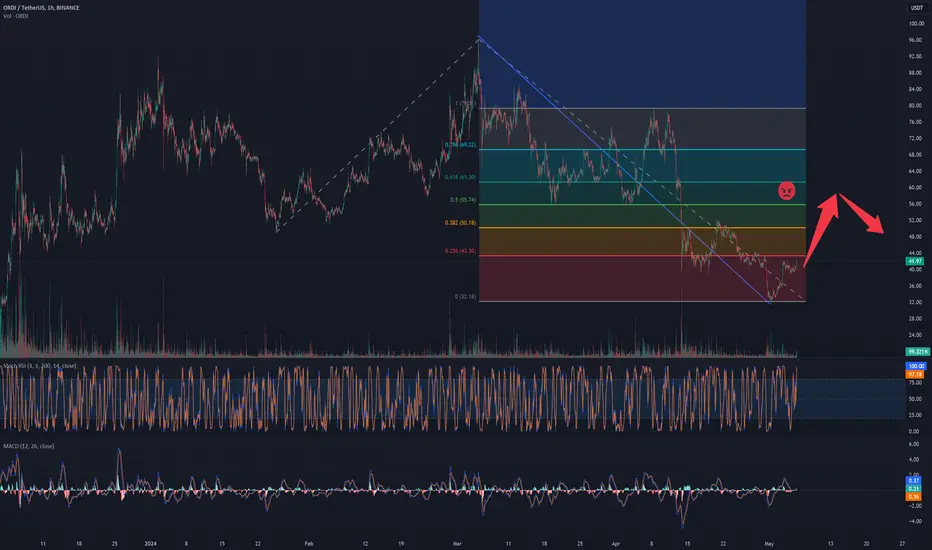
ORDI price is preparing powerful impulse, the question is where?The #ORDIUSDT price is in a long consolidation, trading volumes are falling, as is possible interest in it.
The delta of trading shows that sales are slightly higher than buying in the consolidation.
Perhaps this consolidation is a preparation for the continuation of super growth, as it was before with a similar but smaller pattern.
But personally, if we were to decide to buy SEED_DONKEYDAN_MARKET_CAP:ORDI , it would be not earlier than in the range of $25-28.
Or would you say that this is already an unrealistic price?)
Write your thoughts in the comments.
Ordi to 25$-19$Ordi is dropping hard recently, follow the pattern shown, it should be dipped at 25-19 supprt cluster area, if you would like to buy ORDI and hold it for future, look for these targets for entry.
#ORDI 113% Potential PUMP, RR 1:13#ORDI Update:
It is one of the few altcoins demonstrating strength by bouncing directly from support and maintaining its position. Higher Highs (HH) and Higher Lows (HL) are evident in the lower time frames (LTF).
- Outlook: Bullish for the upcoming weeks
- Risk-Reward (RR): 1:13 (Highly lucrative)
- Invalidation: A daily close below $24.62
Trade Setup:
Monitor the chart closely for optimal entry points.
Do follow me for more and please hit the like button.
Thank you
#peace
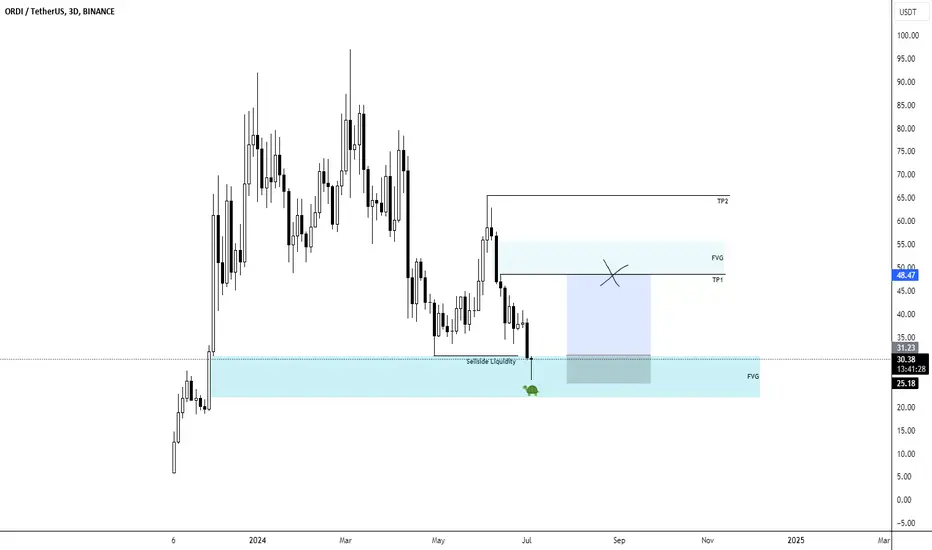
ORDI Long opportunity- Sellside Liquidity has been taken
- Price dipped into the 3D FVG.
- Our target is Buyside Liquidity combined with the 3D FVG on the uspide.
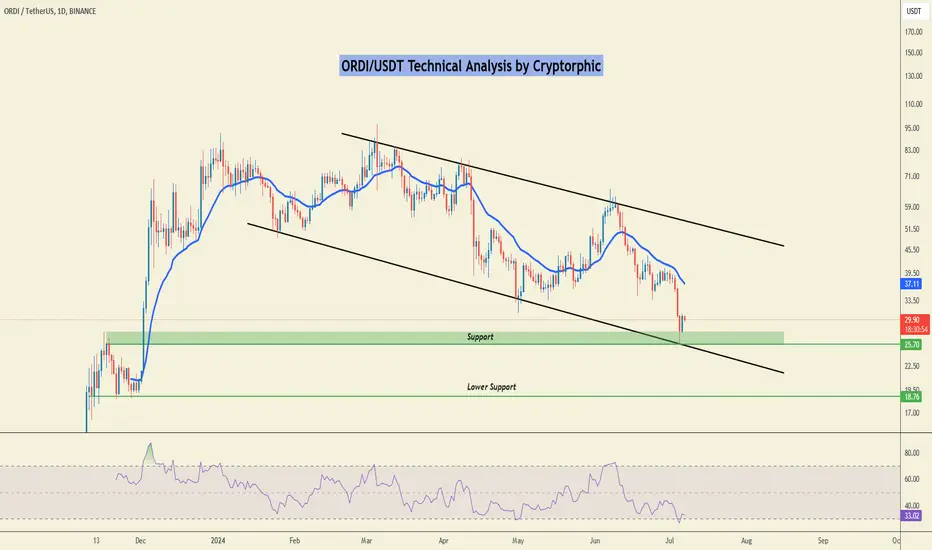
ORDI Technical Analysis in Daily TimeframeHello everyone, I’m Cryptorphic.
For the past seven years, I’ve been sharing insightful charts and analysis.
Follow me for:
~ Unbiased analyses on trending altcoins.
~ Identifying altcoins with 10x-50x potential.
~ Futures trade setups.
~ Daily updates on Bitcoin and Ethereum.
~ High time frame (HTF) market bottom and top calls.
~ Short-term market movements.
~ Charts supported by critical fundamentals.
Now, let’s dive into this chart analysis:
ORDI/USDT is currently holding support at $25.7. The price is in a downtrend, falling almost 60% from its local high of $65.63.
If the price sustains the primary support levels, we can expect a rebound toward $50 soon. A breakdown below the primary support will likely test the lower support at $18.7.
Key Observations:
Primary Support: $25.7.
Lower Support: $18.7.
Resistance: $50.
RSI: Oversold.
DYOR, NFA.
Please hit the like button to support my content and share your thoughts in the comment section. Feel free to request any chart analysis you’d like to see!
Thank you!
#PEACE
ORDI probably bottomed out hereNot much to say here as everything is shown in the chart. Please ignore the timing (usually I'm bad at timing things), however, I think we could see something like this coming weeks/months.
This is just an analysis, i'm not trading this coin if you want to know. I'm interested in other stuff but for those who have interest in Ordi, think right now is a good time to step back in.
Stay safe!

ORDI PriceORDI token had made a double bottom pattern and displayed signs of reversal, investors have guided their attention to it and are looking to bet on it to ride with the reversal.
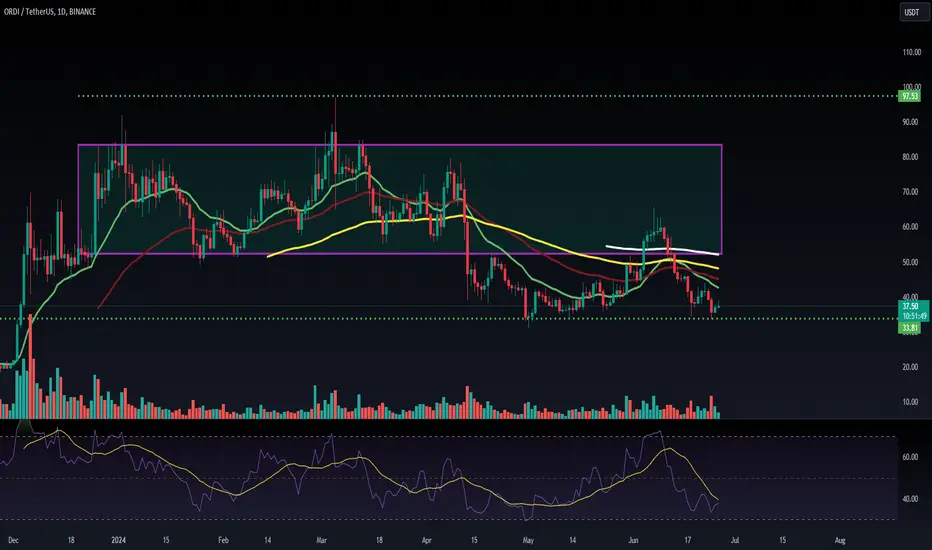
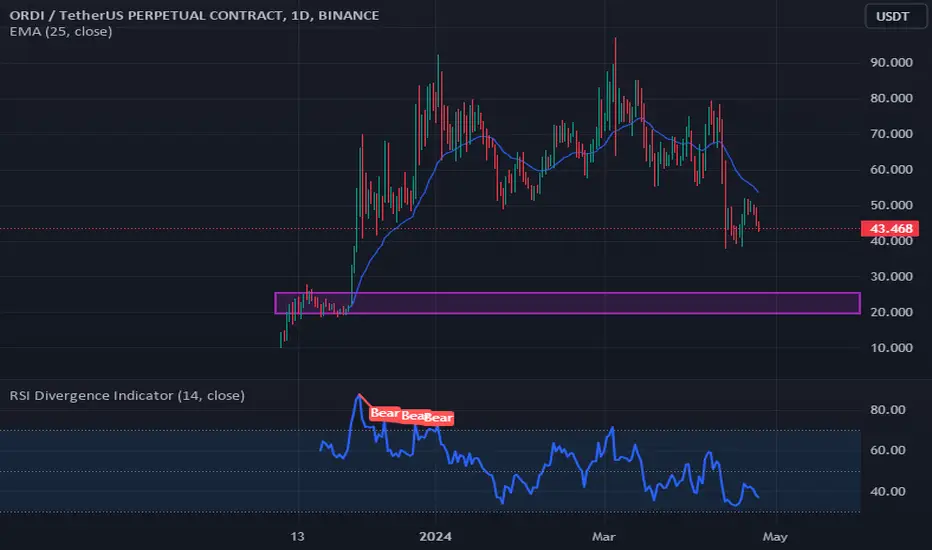
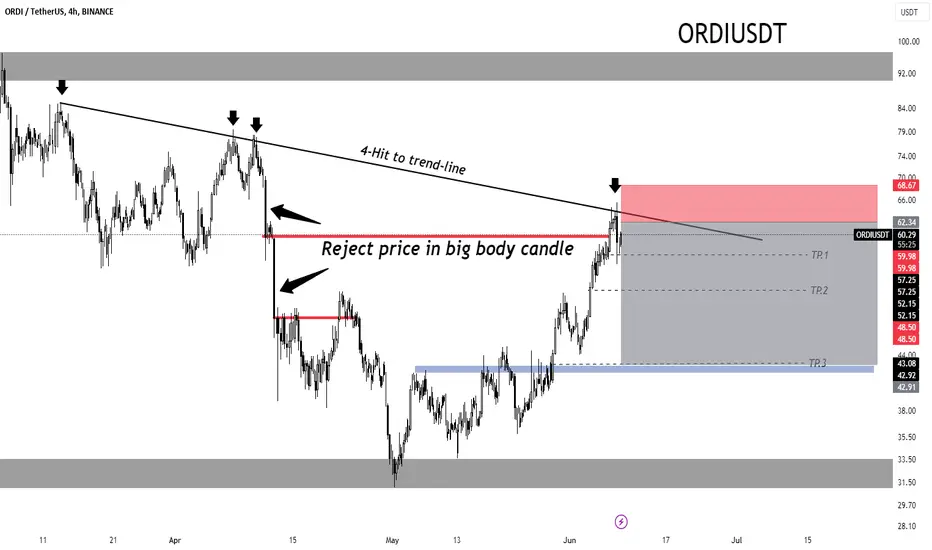
ORDI: effect big candle📊 Token analysis Ordinal done in the style of price cushion, by Ahmadarz analysis team
🚦In the main structure, in the daily time frame, we are in a trading range between the prices of $31 and $95. When I reached this support floor and formed a short-term trading range between the prices of $31.5 and $51, and its failure from the price of $43, a good pump was done. The price went up to $65.
In the continuation of the price trend, since we have reached the middle of this trading range, there is a possibility of returning to the breaking point, i.e. the same price of $42, and if the downtrend line drawn upwards is broken with a codenel with a large body, we can see the price ceiling of $90.
But now I see the downward trend
Upcoming support: 🔺
The most important support is at the price floor of $33
The next support at the break of the last trend is $42
Upcoming resistances: 🔻
The closest resistance: $2.231 as the first target
The most important resistance is: $2.40
💲How to get the trade :
We can enter in the bearish candle created below the trend line.
⬅️Entry: $62.34
🔴Stop: $68.67
🟢Targets: $43 - $55.15 - $57.25
Capital management should be followed because Ahmadarz analytical team is not responsible for your profit and loss. ⚠️
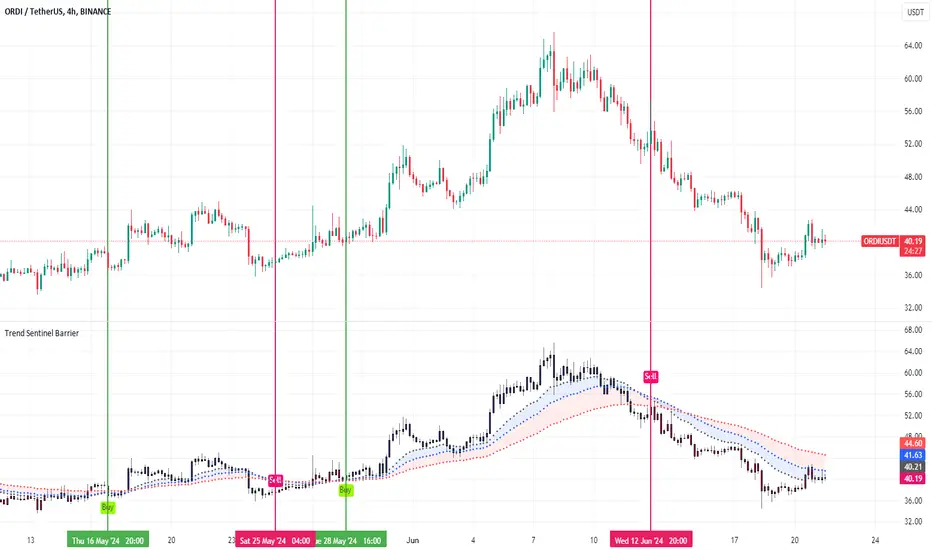
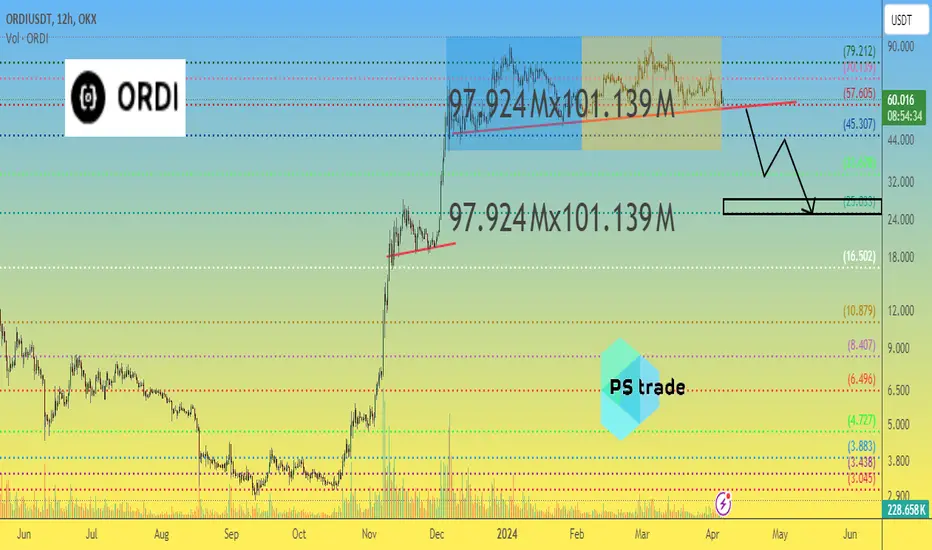
The Popularity of Inscription Track Drops ---- ORDIAt the end of 2023, the popularity of the BTC ecosystem increased rapidly, and various inscription and L2 staking activities appeared. At that time, as the leader of the Inscription track, ORDI once again experienced a rise and was listed on the leading CEX. Coupled with the successful approval of the BTC ETF in January 2024, funds have rapidly pushed up all protocols related to the BTC ecosystem.
ORDI is the native coin of the Ordinals protocol and is also a BRC-20 token. From the perspective of ecosystem, Bitcoin is not as diverse as Ethereum, the activities are relatively primitive, and gas fees are high. Although ORDI and BRC-20 have emerged, they are more like hype, full of meme attributes, and do not have wide application scenarios.
And as the BTC price reaches ATH and a large amount of BTC is released from staking activities, the BTC ecosystem gradually cools down. ETH's entry into the ETF era and the emergence of Runes will further draw funds away from BRC-20.
Although there is still a correlation between the fluctuations of ORDI and BTC, it is far less than before. After BTC hit ATH in mid-March, it remained high and fluctuated. However, ORDI fell sharply. Highs gradually lower.
As we mentioned in the previous article, when a token has a high meme attribute, it will be very suitable for our indicators. At the 4h level, we can see that after experiencing a rebound, the TSB indicator once again gave a SELL signal, with the wavy area providing resistance. With prices now bouncing back near the wavy zone, bears will strengthen again.
We believe that for ORDI, there may still be a good rise in the future, but it is almost impossible to reach ATH.
Introduction to indicators:
Trend Sentinel Barrier (TSB) is a trend indicator, using AI algorithm to calculate the cumulative trading volume of bulls and bears, identify trend direction and opportunities, and calculate short-term average cost in combination with changes of turnover ratio in multi-period trends, so as to grasp the profit from the trend more effectively without being cheated.
KDMM (KD Momentum Matrix) is not only a momentum indicator, but also a short-term indicator. It divides the movement of the candle into long and short term trends, as well as bullish and bearish momentum. It identifies the points where the bullish and bearish momentum increases and weakens, and effectively capture profits.
Disclaimer: Nothing in the script constitutes investment advice. The script objectively expounded the market situation and should not be construed as an offer to sell or an invitation to buy any cryptocurrencies.
Any decisions made based on the information contained in the script are your sole responsibility. Any investments made or to be made shall be with your independent analyses based on your financial situation and objectives.