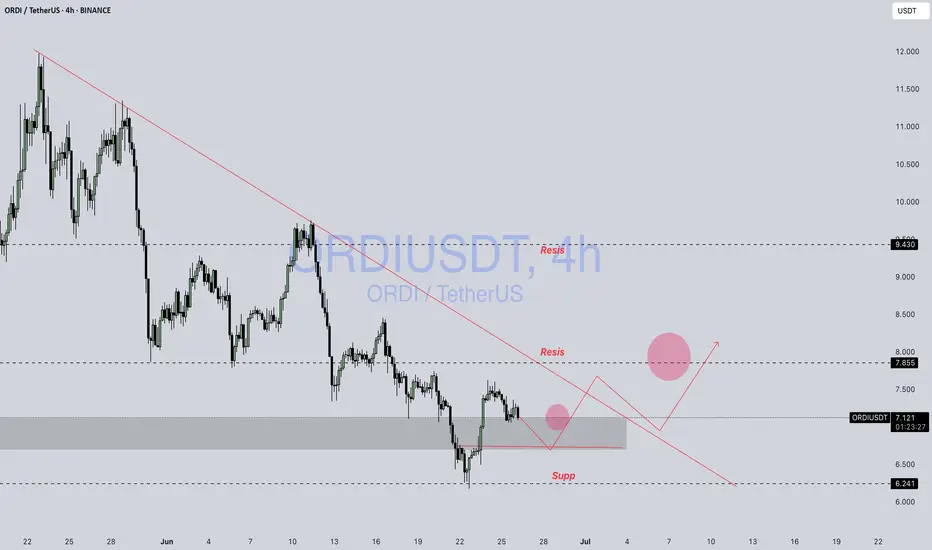
ORDI/USDT – Bullish Falling Wedge Formation!!Hey Traders — if you're into high-conviction setups with real momentum, this one’s for you.
ORDI is forming a bullish falling wedge pattern and is currently consolidating near crucial support. The price is showing initial signs of breakout potential.
Here's the trade plan:
Entry: $7.20–$7.70
Targets: $9.20 / $10.50 / $11.90
Stop Loss: $6.50 (Strict)
Excellent risk-to-reward opportunity here. Keep your stops tight and manage your risk wisely.
ORDIUSDT trade ideas
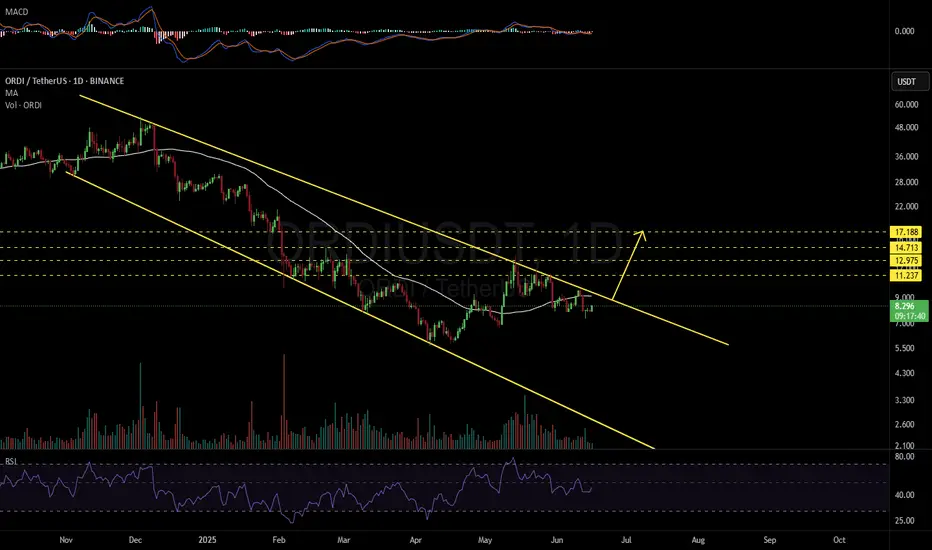
ORDIUSDT 1D#ORDI — 2x Rally on the Horizon? 🚀
#ORDI is trading inside a Descending Broadening Wedge on the daily chart — a bullish reversal pattern.
A breakout above the wedge resistance and the daily MA50 could trigger a strong upward move.
If confirmed, the upside targets are:
🎯 $11.237
🎯 $12.975
🎯 $14.713
🎯 $17.188
⚠️ Always use a tight stop-loss to manage risk and protect your capital.
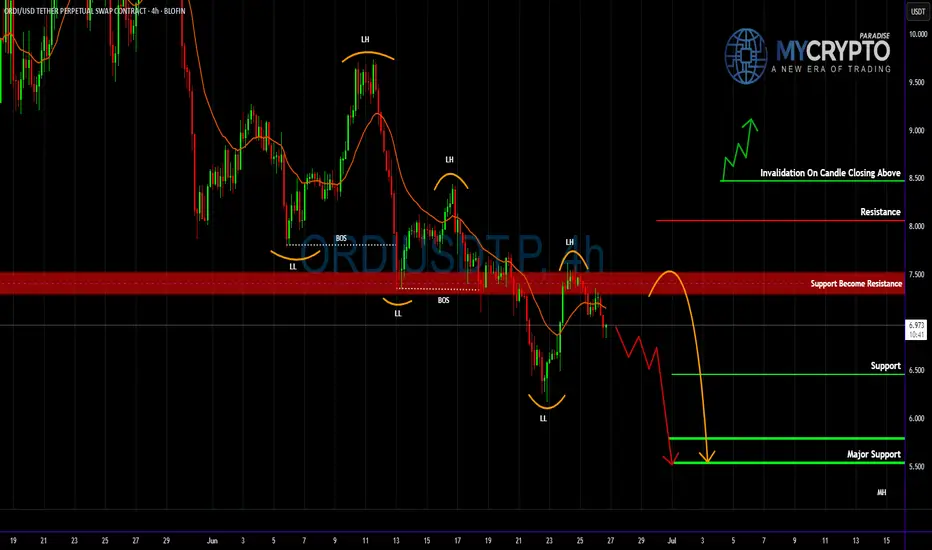
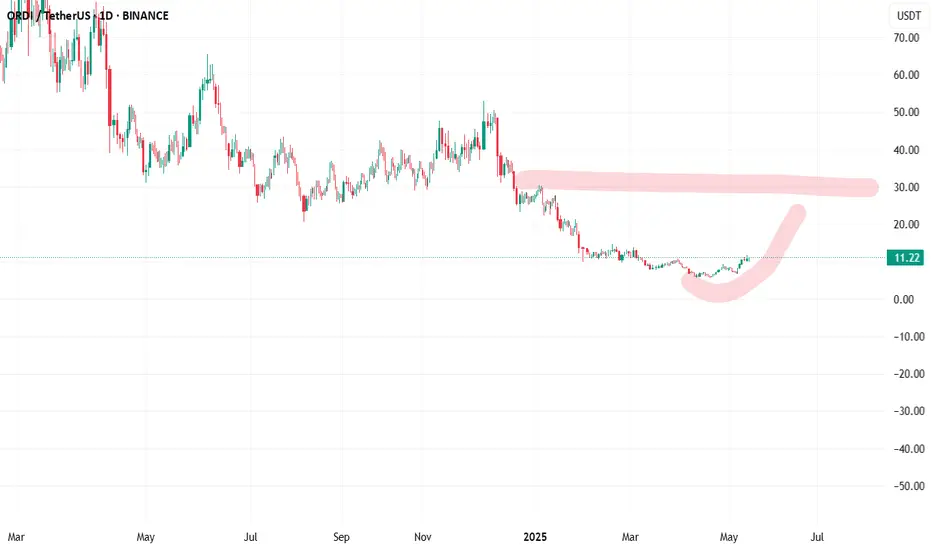
ORDIUSDT Hanging by a Thread Before the Next Leg Down?Yello Paradisers! Are you ready for the next big move on #ORDIUSDT? Because if you’re not already positioned or thinking three steps ahead, this structure could catch you off guard. We’re seeing signs of exhaustion, and the market is setting up for another potential drop. Here’s what you need to know before it's too late.
💎#ORDIUSDT remains in a clear downtrend, printing consistent lower highs and lower lows. Each rally is weaker than the last, and buyers have failed to break above key resistance zones. After the most recent failed bounce into the 7.28–7.51 area—where support has now flipped to resistance—sellers regained control and pushed price back below the 21 EMA. This confirms the
bearish momentum remains dominant and is high probability to go further down.
💎The structure continues to print classic breakdown signals. Multiple breaks of structure (BOS) further validate the downtrend. As long as price remains under the 8.47 invalidation level, there's no technical reason to consider a bullish scenario. Any short-term bounce into resistance is more likely to be a selling opportunity rather than a reversal signal.
💎If price continues lower from here, we’re watching the support levels at 6.46 and then the major support level between 5.79–5.53. A sweep of those levels could trap late shorts, but until we see a confirmed shift in market structure, our bias remains bearish. Patience will be rewarded here.
💎This is a classic scenario where retail traders often get chopped up. The real move comes after both sides get squeezed. Don't be part of the noise.
Strive for consistency, not quick profits. Treat the market as a businessman, not as a gambler. The downtrend is clear, but only disciplined traders will be able to extract profits here without emotional mistakes. Stay sharp, stay strategic, and above all—stay safe, Paradisers.
MyCryptoParadise
iFeel the success🌴
Ordi / Usdt BINANCE:ORDIUSDT
**Key Levels**
- **Resistance:** 7.855 (recent high) → 8.500 (next barrier)
- **Support:** 7.090 (today's low) → 6.241 (critical floor)
**Current Action**
- Trading at **7.118** (-1.96%) after testing **7.281** high
- Rejected from **7.281**, now near **7.090 support**
**What to Watch**
- **Bullish Case:** Hold above **7.090**, retest **7.855**
- **Bearish Risk:** Break below **7.090** → Drop to **6.241**
**Trade Setup**
- **Longs:** Only if holds 7.090 + volume (target 7.855)
- **Shorts:** If breaks 7.090 (target 6.500-6.241)
**Volume Alert**
- Weak bids → Risk of deeper correction
*(Not financial advice!)* 🔍
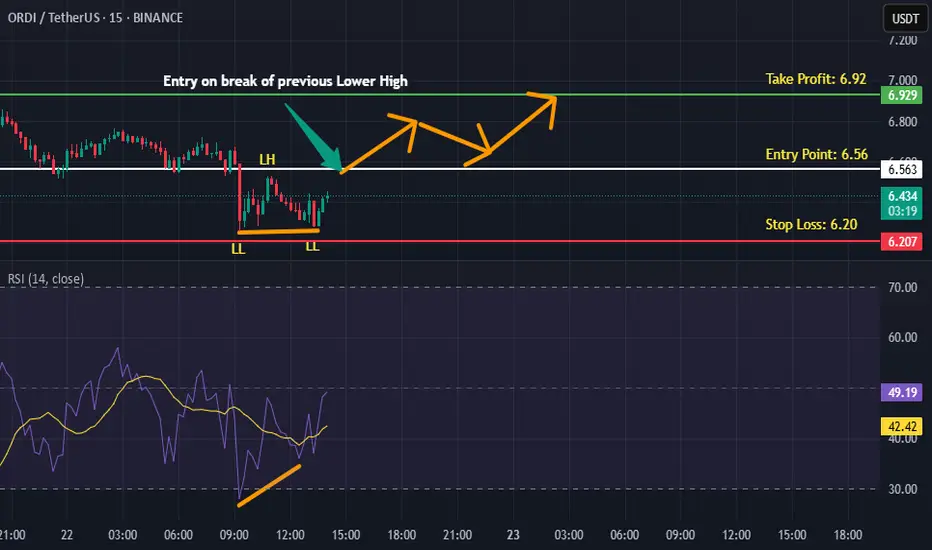
ORDIUSDT is BullishPrice is in a strong downtrend, however the bullish divergence with double bottom hints on a reversal, if previous lower high is broken then we can expect a bullish reversal as per Dow theory. Targets are mentioned on the chart.
ORDIUSDT 2D AnalysisORDI ~ 2D Analysis
#ORDI This is the lowest support block for now. Buy if you still have confidence in this coin with a short term target of at least 15%++.

ordiSupport and press the rocket to cheer me up
Observe the ten percent loss limit
Stay away from Bitcoins
Feel free to buy and sell and post your comments
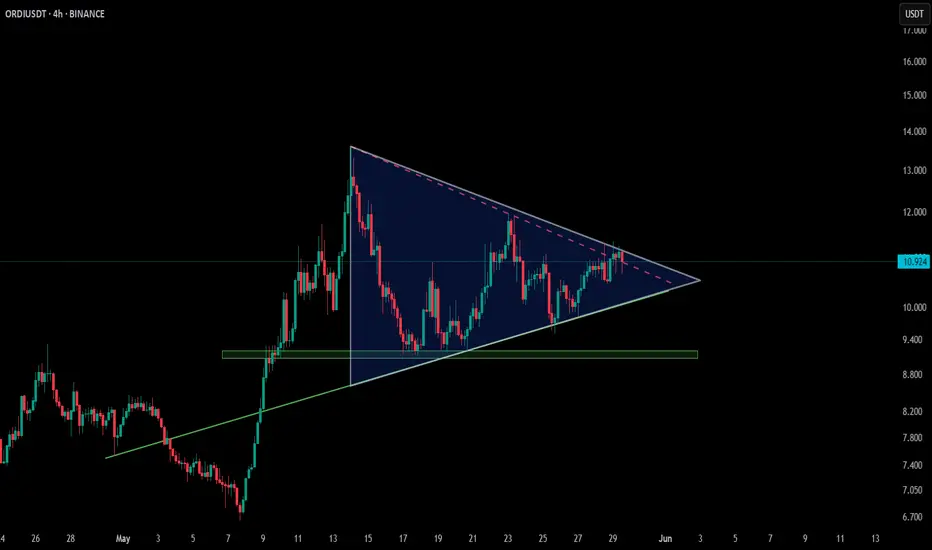
ORDI – Symmetrical Triangle Nearing Decision Point (4H)📐 SEED_DONKEYDAN_MARKET_CAP:ORDI is consolidating tightly within a symmetrical triangle on the 4H timeframe, and it's now pushing toward the upper trendline 📊
A breakout from this range could signal fresh momentum, but failure to break out cleanly might lead to more sideways chop ⚠️
Structure is compressing — volatility likely follows.
👁️ Worth keeping a close eye on this setup as the pressure builds.
ordiWe have a series of numbers that can be considered as medium-term targets. But in the short term, the red box is in the way as resistance.
Me thinks: ORDI USDT Short around 10.45ORDIUSDT short at 10.45. Sl @ 10.8 and Tp at around 9.3.
This is a winner. Don’t Fade. We dipping straight to hell..
~ W

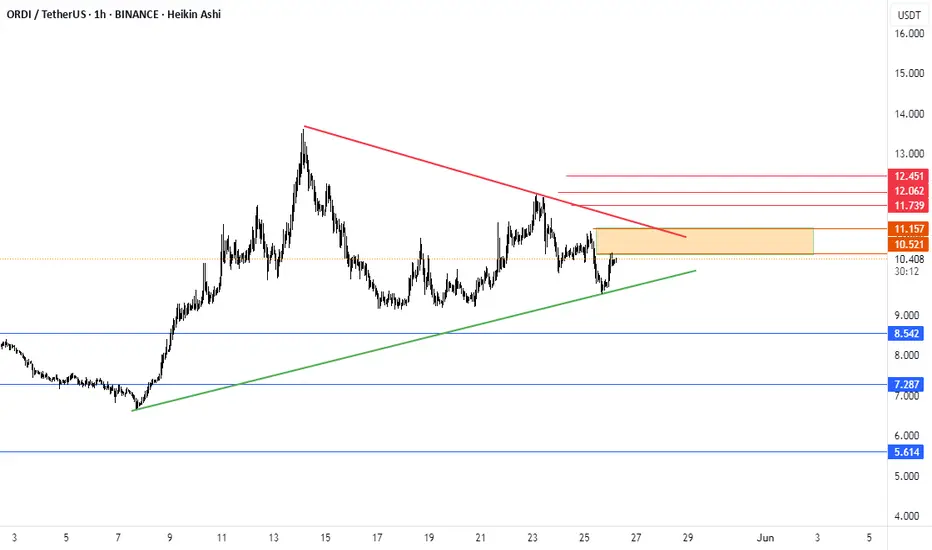
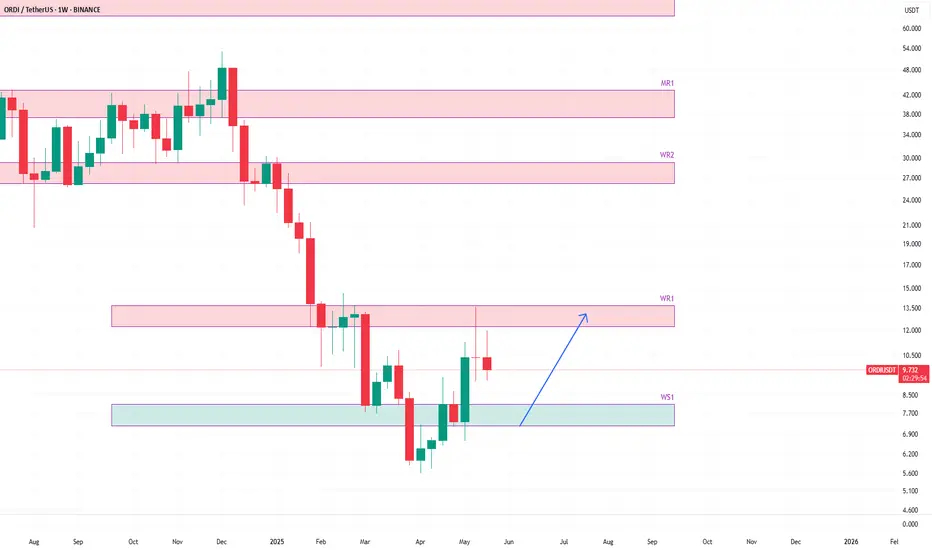
ORDIUSDT heading to weekly supportORDIUSDT is currently trending down after hitting the weekly resistance WR1.
The price is likely to head to weekly support WS1. This support is going to hold the price and provide the bounce.
I believe, the price is very likely to bounce from WS1 and then move upward and on this attempt it may break weekly resistance WR1.
I will share the update once we have the price bounce from WS1 and trading around WR1.
$ORDI Enters Key Fib Support, Watching for Bounce!!SEED_DONKEYDAN_MARKET_CAP:ORDI
It’s not forming any clear pattern, but based on the Fib retracement, price is currently sitting in the golden entry zone around the 0.5–0.618 level.
Also, the 100 MA, which previously acted as strong resistance, is now working as support.
This setup looks interesting because of the tight stop-loss and high reward potential.
I’ve entered the trade with this logic.
Let’s see how it plays out 👀
#ORDI #CRYPTOMOJO_TA
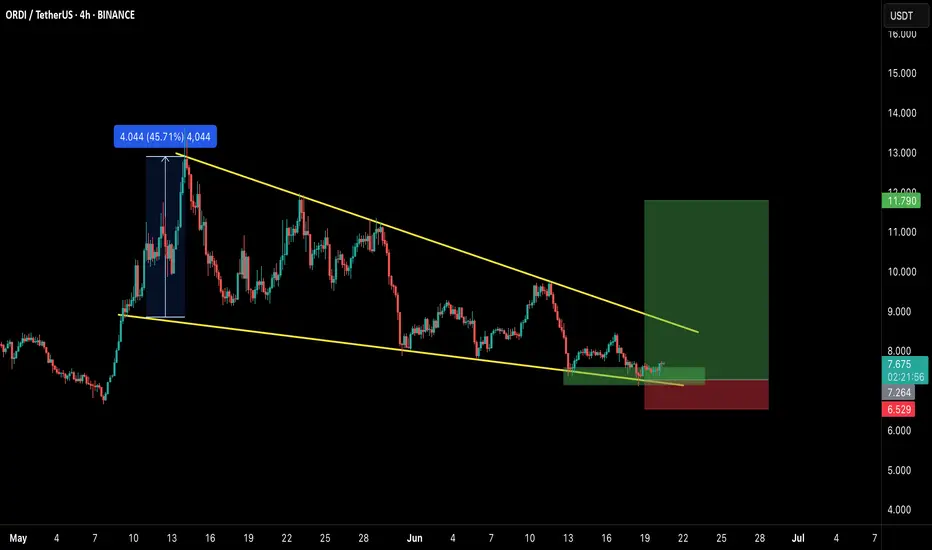
$ORDI/USDT Breakout Alert!$ORDI/USDT Breakout Alert!
After months of a brutal downtrend, ORDI has finally broken the descending trendline with strong bullish momentum. 👀
Entry:- CMP
Targets:- $ 10, $16, $23, $32, $49
Stop loss:-5.67
Risk/Reward looks 🔥 if this move holds.
Eyes on continuation! 🚀

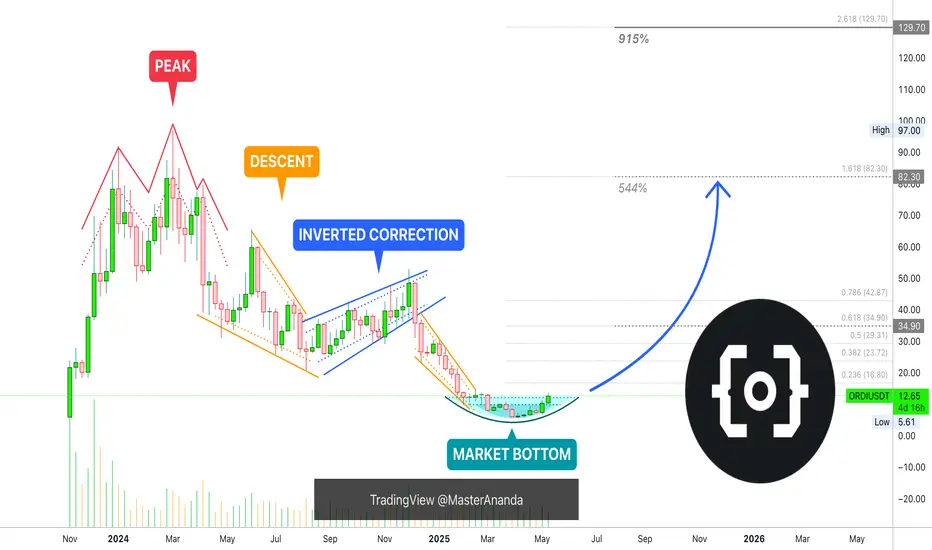
Ordinals Market Bottom, New 10X Bullish Wave In The MakingHere we have a true and perfect bottom. A rounded bottom.
The bottom is perfect because of the chart structure. First, there is a bullish wave, some bullish action. This is followed by a descent with a classic period of rest in-between the start and the end of the bearish move. After the down-wave is over, a perfect rounded bottom forms with a new All-Time Low. After the ATL, ORDIUSDT turns bullish. Classic sequence.
Here it is easy to appreciate how low Ordinals is trading compared to previous market phases, truly bottomed out. It is still trading below mid-November 2023. The only candle that is being matched right now is the first trading session in early November 2023 on the way up.
The same range was also active in February this year but this was part of the final descent.
The bottom leads to a recovery and the recovery will transform into a full blown bull market, growth long-term.
The targets on the chart are easy targets, it is likely that the new All-Time High in 2025 will end up being something higher than what is shown on this chart. Even if it doesn't go beyond, the second target amounts to more than 10X. Huge potential for growth.
Namaste.
ORDI USDT D1 CHARTWE ARE EXPECTING BULLING ON D1 CHART
THIS IS DAILY BASED ANYLIZED PLEASE ITS MAY TAKE LONG TIME HOLDING
Capital.com: the Middle East's best broker (TradingView, 2025). Trading carries risk. Quick, fee-free AED deposits – USD also available. Instant Price Alerts. Tight Spreads.
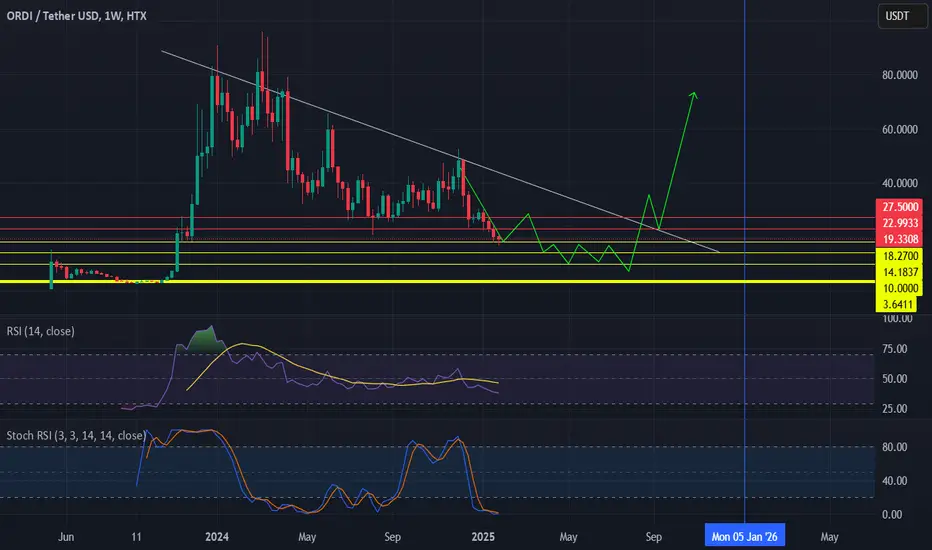
ORDIUSDT — channel, high risks, high rewards.ORDI is the first BRC-20 token based on the Ordinals protocol on Bitcoin. Since its launch in March 2023, the token quickly gained popularity and a significant market cap, being integrated into the Bitcoin blockchain. This integration is made possible through the Ordinals protocol developed by Casey Rodarmor. The protocol allows inscriptions - text, images, audio, or video - to be made directly on satoshis, the smallest unit of Bitcoin, giving Bitcoin new functionality that was not originally envisioned. You can now create NFTs and other digital assets and trade them directly on the blockchain.
____________
The token was listed at a fortunate time - late 2023 - amid overall market growth and positive sentiment. At the time, everything looked promising, but now the price has dropped by 94% from the zones where “hype was being sold.”
🔻 Structure:
The token is moving within a large descending channel. Recently, the price tested the outer support of this channel.
A local downtrend channel was also broken - its retest and a rise within the main trend are possible.
📊 Scenarios:
Retest and upward movement as part of a correction.
Consolidation in the current zone with a possible breakout to the upside.
Further decline amid overall negative market sentiment.
💥 Risks:
The token is traded on all major exchanges, including Binance. However, if it gets delisted (which has been happening more often recently), this is the main risk: loss of liquidity!
🎯 Approach:
With such tokens, it’s crucial to distribute volume wisely and accept risk in advance. I mark out interesting zones and place limit orders accordingly.
Considering the overall market and news backdrop, the token does have bounce potential, especially now that faith in the project is nearly lost.
💭 Opinion:
From my years of experience, I’ll say it again: the goal isn’t to guess where the price will go - it’s to be ready for it. Not everyone will understand that, but then again, not everyone consistently makes money in this market.
_________
📌 Not financial advice. This material reflects personal observations and a risk management approach.

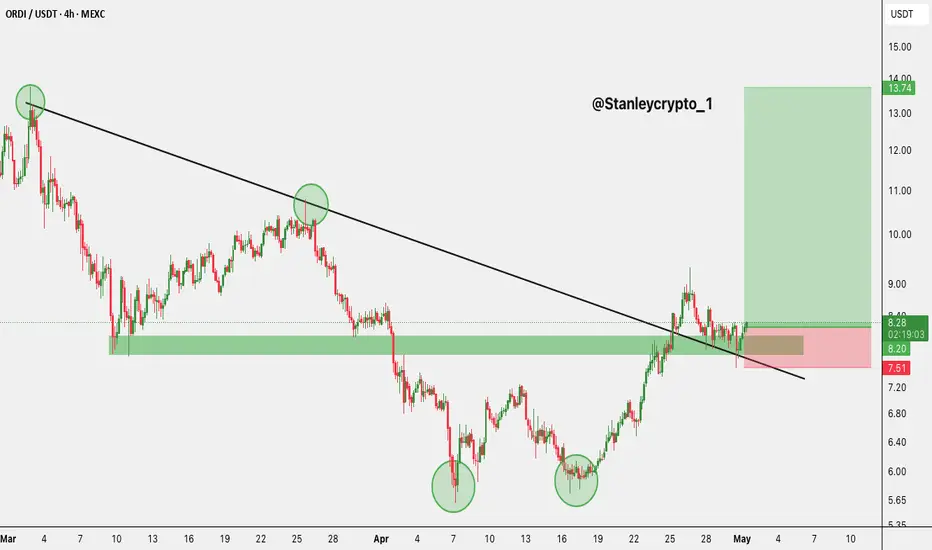
$ORDI/USDT Long setup 4h$ORDI/USDT – Long Setup (4h) 🚀
Entry: CMP
SL: $7.51
Targets: $10 / $12 / $13
- Breakout & retest of trendline
- Bullish momentum building
- Setup is valid as long as $8.10 holds
DYOR. Trade safe! 👀
ORDIUSDT 2D AnalysisORDI ~ 2D Analysis
#ORDI This trade is very high risk
This is the lowest support for now, buy gradually with a short -term target of at least 15%+.
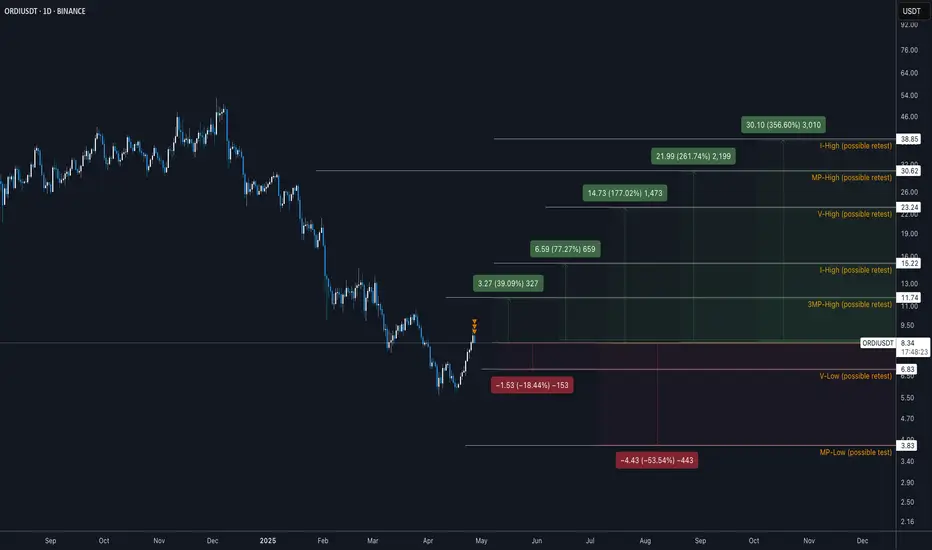
ORDI is printing a classic “dead-cat or genesis‐leg” decisionORDI is printing a classic “dead-cat or genesis‐leg” decision
🕞 60-Second Read
Trend on the 1-D chart is still structurally bearish but price (spot 8.34 USDT) just bounced +55 % off the March capitulation wick.
Hot-Zone #1 – 6.83 (V-Low): last defended demand, 18 % under spot.
Hot-Zone #2 – 11.74 (3 MP-High): first daily breaker sitting 41 % above spot.
Hot-Zone #3 – 23.24 → 30.62 (V-High ↔ MP-High): macro supply shelf where the next big void starts.
🎲 Probability Dashboard
HTF Trend & Market Structure – -2
Liquidity Map (voids above, un-retested pivots) – +1
Momentum (bull div & impulse) – +1
Derivatives Flow (funding near flat) – 0
Net Score = 0
Bear / Neutral / Bull odds ≈ 45 % / 25 % / 30 %
📈Trade Playbook
Strategy 1
1. Layered Limit Grid – Aggressive Counter-Trend Long
Entry layers (size %):
7.05 – 25 % of your allocated ORDIUSDT size
6.20 – 35 %
5.20 – 25 %
4.20 – 15 %
SL = 3.35
TP ladder:
11.74 – 25 % off-load
15.22 – 25 %
20.72 – 30 %
23.24 – 20 %
Weighted R:R ≈ 4.6
---
Strategy 2
2. Layered Limit Grid – Conservative Breakout Long
Trigger: daily close > 12.00, then place grid orders.
Entry layers (size %):
12.10 – 40 %
13.20 – 30 %
15.20 – 20 %
20.80 – 10 %
SL = 10.10
TP ladder:
23.24 – 30 %
30.62 – 30 %
37.65 – 25 %
48.25 – 15 %
Weighted R:R ≈ 4.9
Setup Logic
Price reclaimed minor breaker but sits inside a 72 % upside void to 11.74.
Three un-retested pivot highs (11.74 / 15.22 / 30.62) magnetise rallies.
Yearly BC 37.65 brackets with I-High 38.85 – high-timeframe liquidity pool.
Capitulation low left MP-Low 3.83 as invalidation reference for longs.
Risk Radar
BTC volatility spill-over could nuke thin ORDI order-books.
Macro: U.S. risk‐off headlines keep alt liquidity fragile.
Narrative: inscription / BRC-20 hype cycle cooling – watch volume.
ORDI is printing a classic “dead-cat or genesis‐leg” decision: defend 6.8 and bulls get an air-pocket run to 15 – 23; lose it and 3.8 is next. Trade the grid, not the hopium.
(Not financial advice – manage your own risk.)
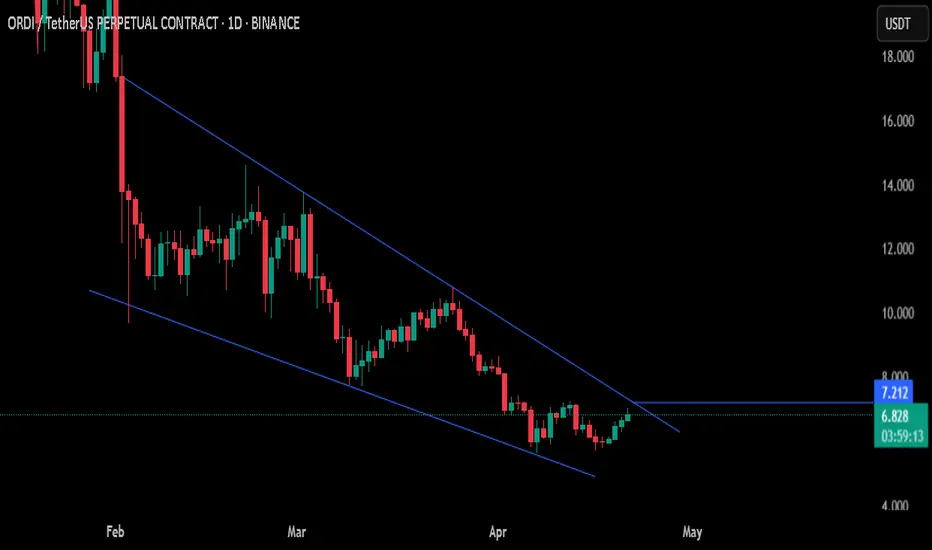
ORDI/USDT - Falling Wedge breakout attemptORDI is attempting to break out of a falling wedge pattern on the daily chart — a classic bullish reversal setup.
Price is currently pushing through resistance near $7.212, signaling possible momentum shift.
If price successfully break above the falling wedge, signals a protentional long opportunity.
Keep an eye on BTC correlation for confluence.
NFA, DYOR
ORDI: The Perseverance#Ordinals has seen a severe drop since the previous update but hasn't yet broken the invalidation level at $2.83.
Wave (2) looks close to completion, with potential reversal from the marked Fib zone.
Passing $52.84 confirms the bullish case and opens the path to a new ATH.

ORDIUSDT analysis and prediction 2025 #ORDI #ORDIUSDT #Crypto#ORDI #ORDIUSDT #CryptoAnalysis #BitcoinOrdinals #BRC20 #CryptoTrading #CryptoPrediction #TechnicalAnalysis #FundamentalAnalysis #Altcoins #CryptoMarket #Blockchain
Fundamentals: ORDI depends on Bitcoin Ordinals adoption. High potential but faces regulatory and market risks.
Technical: Bullish trend; support at $18.50-$15.00, resistance at $22-$25+. Indicators show potential upside but risk of correction.
Market Sentiment: Strong Bitcoin correlation, whale activity causes volatility, hype-driven demand.
Prediction: If Bitcoin performs well, ORDI could hit $30-$50 in 2025. If interest drops, it may fall below $15.
ORDIUSDT: trend reversal and bounce from fib level!!Join our community and start your crypto journey today for:
In-depth market analysis
Accurate trade setups
Early access to trending altcoins
Life-changing profit potential
Let's analyse ORDIUSDT technically.
FUNDAMENTAL ANALYSIS:
The Ordinals Protocol enables the creation of non-fungible tokens (NFTs) directly on the Bitcoin blockchain. By inscribing data onto individual satoshis (the smallest Bitcoin units), it allows unique digital assets to be represented and traded on Bitcoin's base layer. This approach leverages Bitcoin's security and decentralization, offering a new method for creating digital collectibles and assets. Unlike NFTs on other blockchains, Ordinals operate directly on Bitcoin, ensuring permanence and immutability. As a recent innovation, the Ordinals Protocol opens new possibilities for digital art and asset management within Bitcoin’s established framework.
TECHNICAL ANALYSIS:
After a 109-day consolidation and an 84% price decline, ORDIUSDT is breaking out of its parallel channel. The recent low of $7.7 aligns precisely with key Fibonacci retracement levels, suggesting strong support. The subsequent bounce shows significant bullish momentum, backed by increasing volume. Smaller EMAs are acting as dynamic support, reinforcing the price's upward trajectory. This breakout, combined with fib level confluence and strong volume, signals a potential trend reversal for ORDIUSDT.
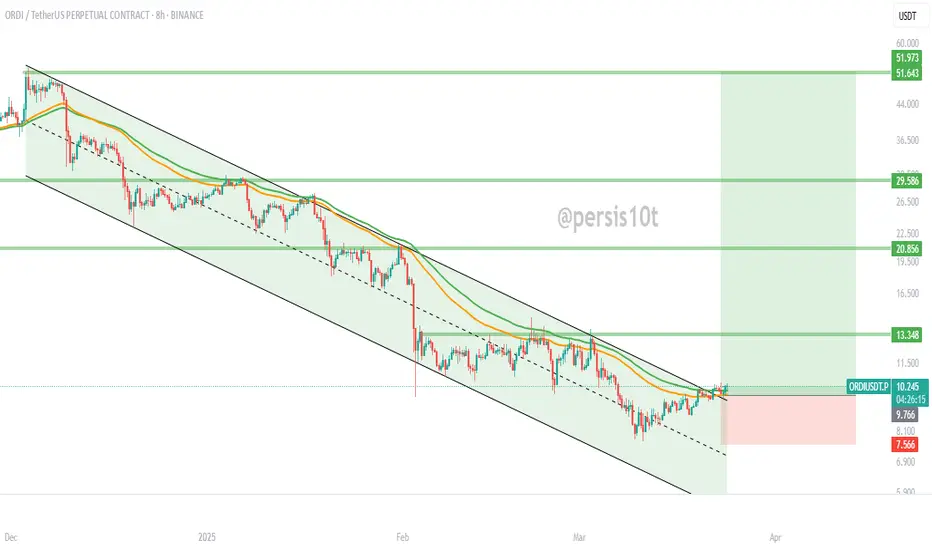
Accumulation zone:
CMP and $9
Target levels:
$13.4
$20.8
$29.5
$51.9