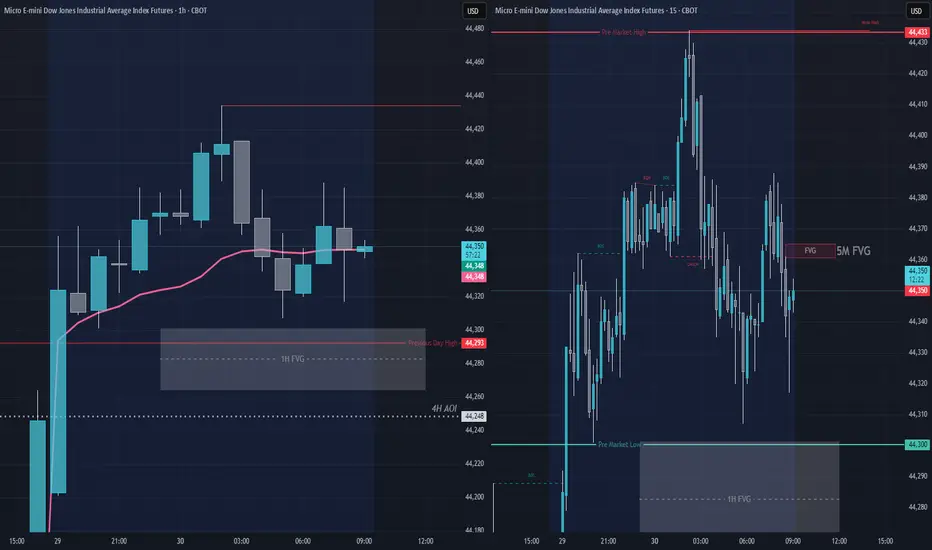
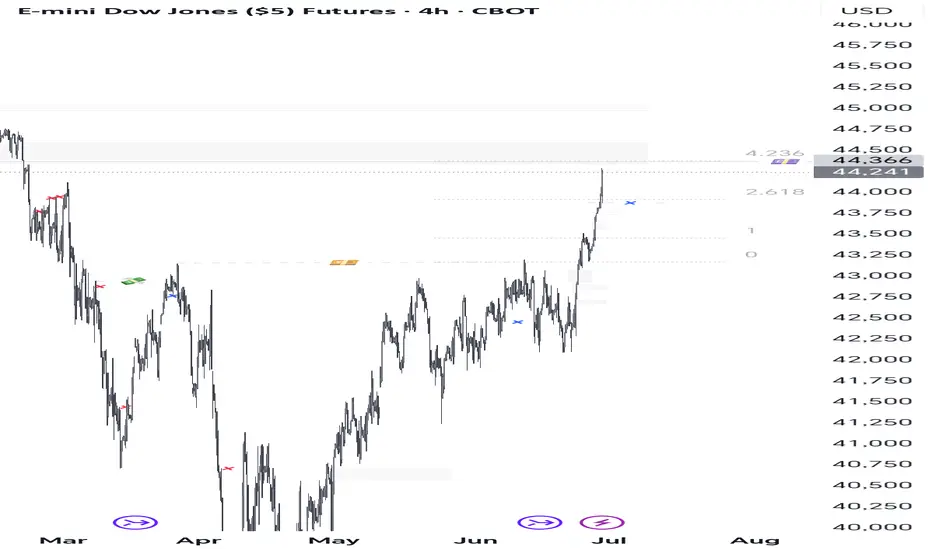
Looking for 2 scenarios to play outRight now we are a little extended on this move to some higher levels of liquidity. There was a big move that took place on the 29th that left a major imbalance from 44,301 - 44,264. I'm looking two things to happen.
1) Ill wait for a pullback into a 5M FVG in the 44,362 area for some Shorts.
2) I wait us to drop into the 1H FVG which is that major imbalance i spoke of then ill watch to see if price action and volume confirm a bounce or we break thru and continue lower.
DJIAM2026 trade ideas
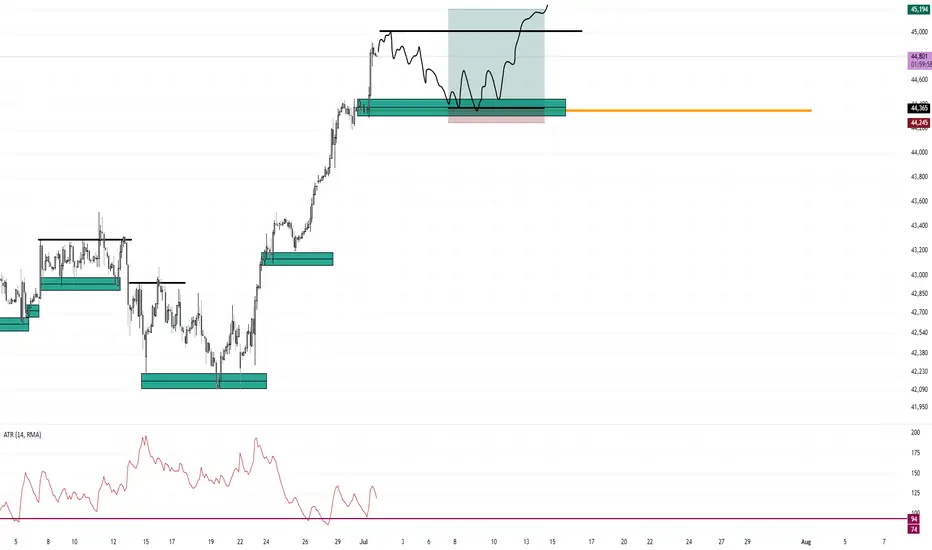
Bull Trend Buy Pullback to July Monthly OpenI am looking/waiting for a pullback to July's monthly open for a buy support trade in this strong bullish trend. Based on the close of the 3 month quarterly chart, the trend is EXTREMELY bullish.
This doji candle on the monthly chart for the SP500 is EXTREME Bullishness.
Below are examples of this setup. I jump ALL over this setup as soon as I see it.
Dow Jones: Bullish Momentum Suggests Strong Upside Potential Current Price: $44828.53
Direction: LONG
Targets:
- T1 = $45550
- T2 = $46300
Stop Levels:
- S1 = $44350
- S2 = $44000
**Wisdom of Professional Traders:**
This analysis synthesizes insights from thousands of professional traders and market experts, leveraging collective intelligence to identify high-probability trade setups. The wisdom of crowds principle suggests that aggregated market perspectives from experienced professionals often outperform individual forecasts, reducing cognitive biases and highlighting consensus opportunities in Dow Jones.
**Key Insights:**
The Dow Jones Industrial Average demonstrates bullish momentum, supported by trading above significant moving averages such as the 50-day SMA and 200-day SMA. Optimism is further fueled by signs of easing inflation and resilience in the labor market. Healthcare and technology sectors are contributing to the bullish outlook, with recent buying activity indicating opportunities for further price growth. However, traders should monitor the key support level at 42,000, as a potential break below this might trigger bearish reversals. Geopolitical risks and global macroeconomic challenges remain potential headwinds but seem subdued for now.
**Recent Performance:**
Over the past few weeks, the Dow has shown steady growth, closing in on prior resistance levels near $45000. Compared to the S&P 500 and NASDAQ, gains have been more measured, reflecting rotation into defensive sectors amid broader market consolidation. The Russell 2000's outperformance suggests increased confidence across smaller-cap stocks, hinting at overall market strength. Volatility indicators suggest low levels, supporting sustained bullish sentiment, although profit-taking risks may emerge during market consolidation phases.
**Expert Analysis:**
Market experts highlight that a continuation of the bullish trend depends on breaking above the $45000 resistance level on sustained volume. This could serve as confirmation of further upward momentum toward the stated price targets. Analysts also stress the importance of holding above the $44400 level, which is a key short-term support, as failing to maintain this level could lead to retracement scenarios. Technical patterns such as upward channels and Fibonacci levels signal further growth potential, while Elliott Wave frameworks suggest the Dow is in an impulsive bullish wave pattern.
**News Impact:**
Recent inflation data, including Core PCE readings, implies that pressures are moderating, which bolsters confidence in equities. Additionally, strong corporate earnings from major players such as Nvidia and Apple contribute to positive sentiment in the technology-heavy components of the Dow. However, ongoing concerns related to geopolitical tensions and tariff adjustments remain risks that could derail short-term bullish prospects.
**Trading Recommendation:**
Based on current momentum, professional insights, and a favorable macroeconomic backdrop, taking a LONG position on the Dow Jones at current prices presents a high-probability opportunity. Ensure rigorous risk management through predefined stop levels at $44350 and $44000, while aiming for price targets of $45550 and $46300, respectively. Close monitoring of upcoming economic reports and geopolitical developments will be crucial to navigating potential market volatility.
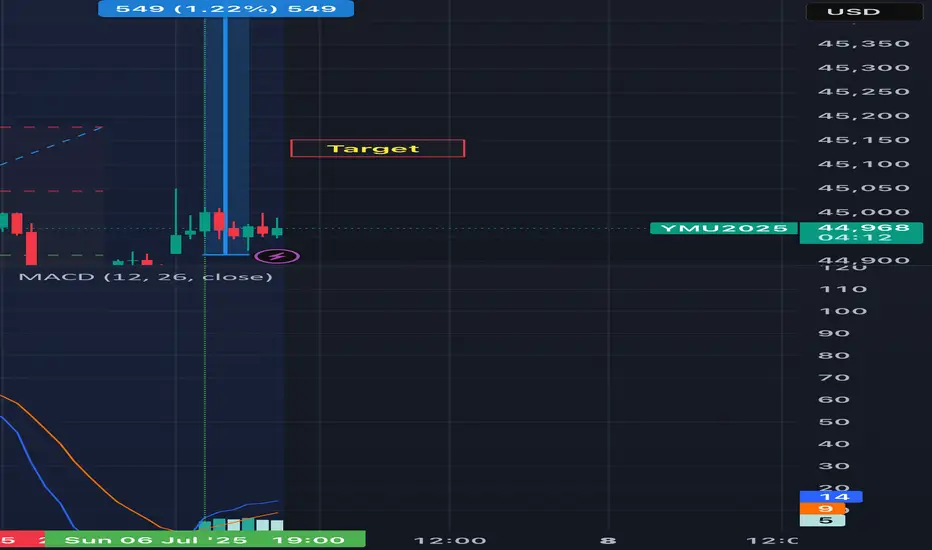
Long buddy!’n45,150 by today’s close
I have my divergence with my macd stratagy
We are in an overall uptrend.
Price action is building up for a bullish push imo
What are your thoughts?
Trade safely my friends
im wrong a bit to earlyAt last after playin around with that compression and sideway around half a month,
i can close my trade.
We are reaching at the selling zone for now and dont know how long it will goes sideway or just make one easy movement.
The sentiment with current snp ath and july fomc fed cut rate around the corner not in sync with current structure but hey resistance is still resistance.
E mini Nasdaq 100. 20.06.2025, Thursday [Day after FOMC]Clean delivery after FOMC. Massive meltdown on NQ.

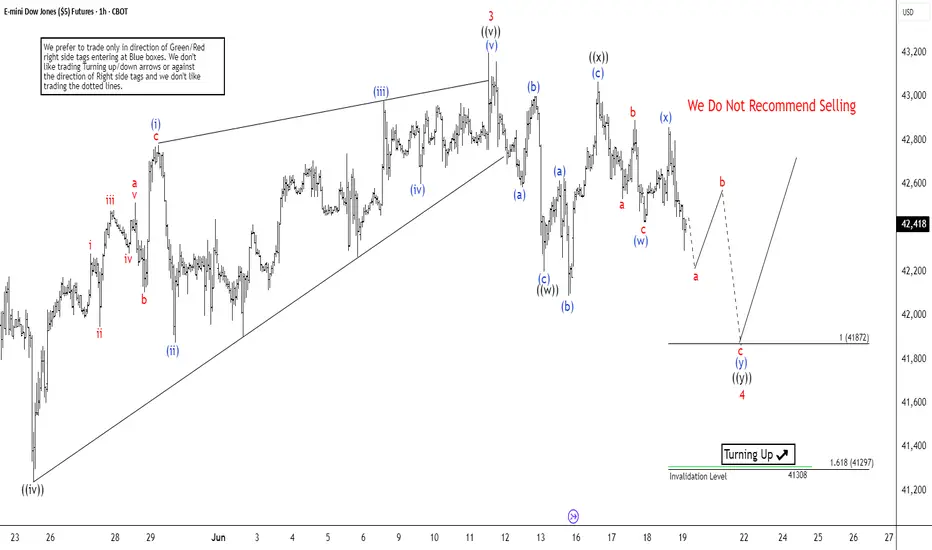
Dow Futures (YM) Elliott Wave View: Wave 4 Correction UnderwayThe rally in Dow Futures (YM) that began from the April 7, 2025 low remains intact. It is unfolding as a five-wave impulse pattern according to Elliott Wave analysis. Starting from that low, wave 1 peaked at 39,649. A corrective pullback in wave 2 followed which found support at 36,922. The Index then resumed its upward trajectory in wave 3, which itself subdivides into five smaller-degree waves. As shown on the 1-hour chart below, wave 3 reached its high at 43,316. The market is now experiencing a pullback in wave 4.
Wave 4 is taking shape as a double three structure, a corrective pattern characterized by multiple sub-waves. From the wave 3 high, wave (a) declined to 42,518, followed by a wave (b) rally that topped at 42,944. The subsequent wave (c) dropped to 42,223, completing the first leg of the double three, labeled wave ((w)). The Index then rallied in wave ((x)), peaking at 43,069. Then it turns lower in wave ((y)), which also unfolds as a double three. Within this structure, wave (w) ended at 42,424, and a corrective wave (x) rally concluded at 42,860. The Index is now expected to extend lower in wave (y) of ((y)), targeting the 41,297–41,972 range. This decline should finalize wave 4, setting the stage for a potential wave 5 rally to new highs.
DOW ON ROUTE TO Recovery?As bids recapture the huge washout on Friday due to missiles in the sky. The market was due to ignore news and hope that it was over. Now we wait for Powell and Retail sales
YM ShortLooking for a trade reversal and we didn't had that then the market retrace at the New York open highs the I was looking for a trend continuations then the market took the highs and continue the trend to the down side hitting the tp for a 1:2 RR.

ES1, NQ1 & YM1 Daily Trade SetupsIn this update we review the recent price action in the emini S&P SP500, Nasdaq & DowJones futures contracts and identify the next high-probability trading opportunities and price objectives to target. To review today's video analysis, click here!

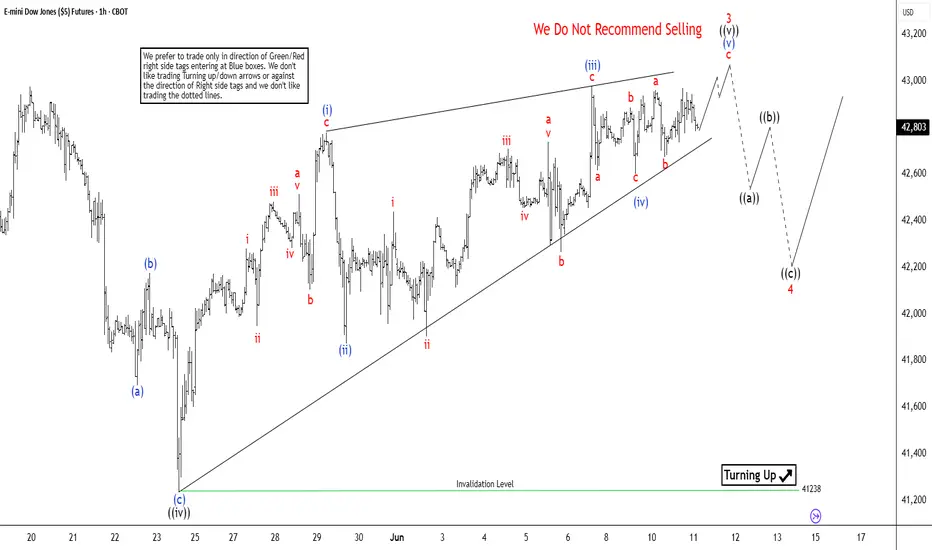
Dow Futures (YM) Set to Wrap Up Wave 3 SoonSince reaching its low on April 7, 2025, Dow Futures (YM) has shown signs of recovery. The Index has initiated a rally that requires further development to confirm whether the April 7 low will hold as a significant bottom. To establish this, the Index needs to either achieve a new all-time high or complete a clear five-wave structure from the April 7 low. Either of these developments would significantly reduce the probability of the Index undergoing a larger double correction. Currently, the rally from the April 7 low is in progress and appears to be forming an impulsive structure. An impulse is typically a strong bullish signal in technical analysis.
From the April 7 low, the rally has unfolded as follows: wave 1 peaked at 39,427. A corrective wave 2 then followed which ended at 36,882. The ongoing wave 3 is subdividing into a smaller-degree impulse, indicating continued upward momentum. Within wave 3, wave ((i)) concluded at 41,140, and the subsequent pullback in wave ((ii)) ended at 37,998. The advance in wave ((iii)) reached 42,976, with the corrective wave ((iv)) bottoming at 41,236. Currently, wave ((v)) is forming as an ending diagonal, a pattern often signaling the final stage of a move. As long as the Index remains above 41,238, expect one more push higher to complete wave ((v)), which should also finalize wave 3 in the higher degree. Following this, the Index is anticipated to experience a larger-degree wave 4 pullback, likely unfolding in a 3, 7, or 11-swing corrective pattern, before resuming its upward trajectory.
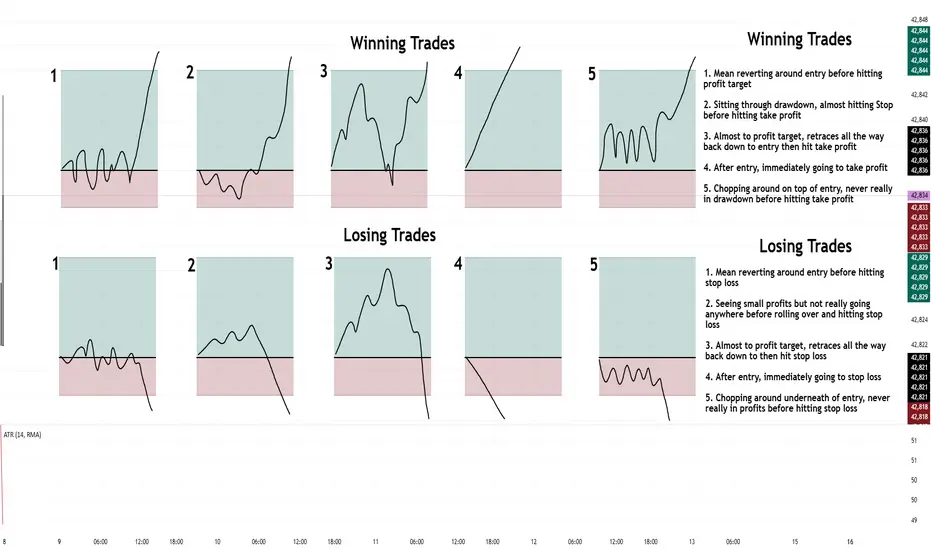
The 10 probabilistic outcomes of any given trade ideaOutlined below, I have come to the conclusion that there are 10, most probable trade outcomes of any given trade idea.
After seeing these outcomes, one can see what outcome is the most challenging for a trader to handle. Everyone is different and can tolerate different scenarios.
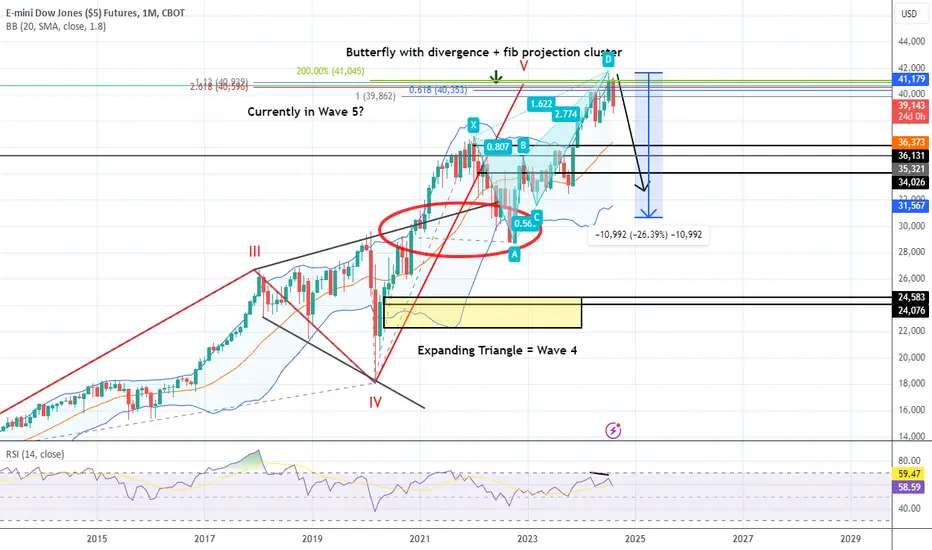
Dow Industrials Monthly ButterflyThis one is better than Nasdaq, has indicator divergence as well and is earlier
Possibility for +20% correction from here
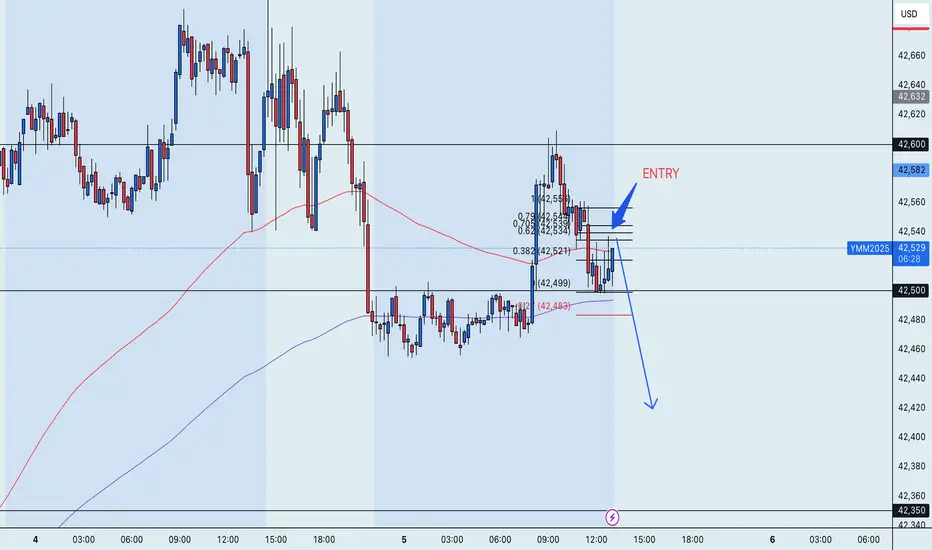
Dow Jones Short Trade Idea 8:1 1000 tick OpportunityI am currently short Dow Jones aiming for a home run trade that I have been waiting to set up for days now.
My thesis:
Rising wedge into the 80% pullback of the Daily Doji bar
Mean Reversion around March FOMC of 41,155
Break of the support zone of 42,000
If today will be the day it engulfs then I will probably hold all day short
If I am wrong, then price will find support somewhere and bounce, stopping me out. I am willing to try for this idea.
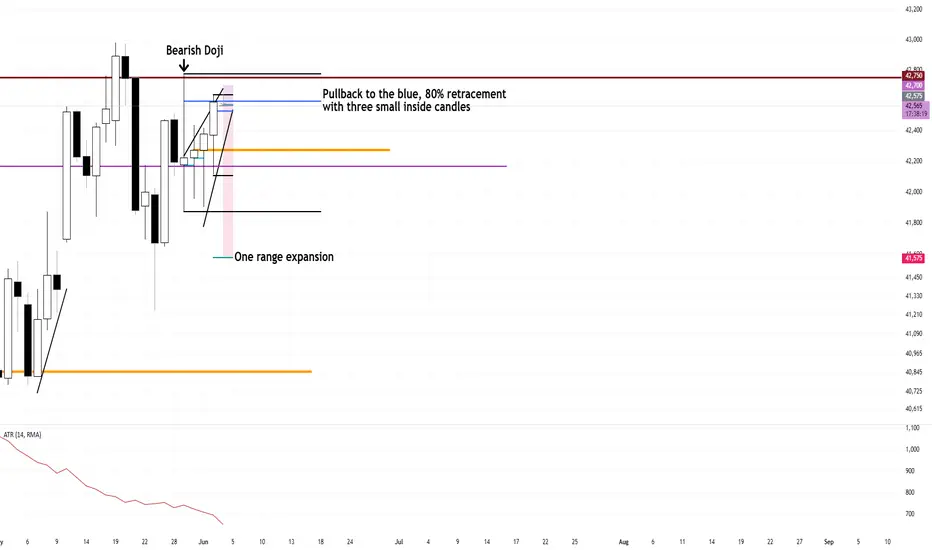
Support and resistance zone: 42278-42321
Hello, traders.
If you "Follow", you can always get new information quickly.
Have a nice day today.
-------------------------------------
(YM1! Chart)
OBV High indicator point: 42321
OBV Low indicator point: 42278
Accordingly, if it falls below 42278, it is highly likely to fall again around 42211.
If it receives support at 42321, it is likely to show an upward trend.
At this time, the resistance zone is 43263-43628.
-
If you look at the 30m chart, the HA-High indicator is located near the OBV High indicator point.
Therefore, if there is resistance near the HA-High indicator, there is a high possibility that it will fall to the HA-Low indicator.
The HA-Low indicator point is currently formed at the 42211 point.
-
Thank you for reading to the end.
I hope you have a successful trade.
--------------------------------------------------

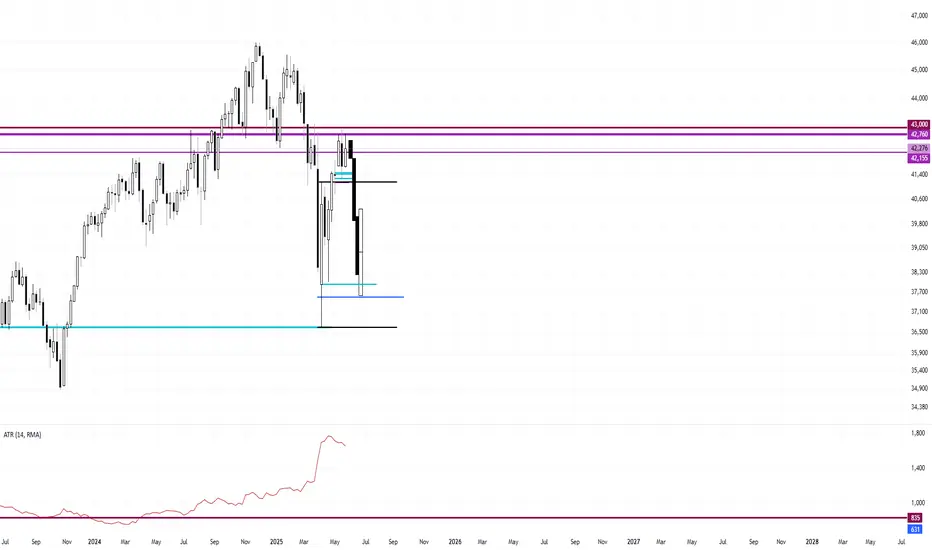
June Gameplan Rough Estimation Dow Jones Island ReversalThis is just my rough draft estimation on what I am thinking Dow Jones will do in June.
I am going to sit out the first week to gather data and let the market show its hand to me first.
I have two key levels marked using the weekly candle of April 7th.
The 80% retracement and the candle open.
I am thinking the first week of June to be a sideways candle of sorts to have four choppy weeks up high. Then two consecutive weeks of dump down into 37,500 followed by another monster bull candle to engulf forming the W pattern
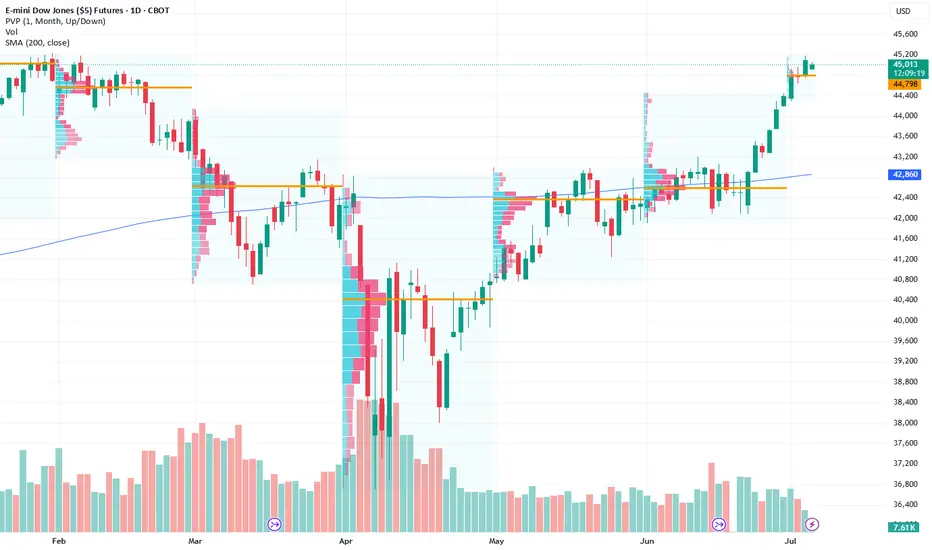
DJIA — Setting Up for Breakout and New ImpulseThe Dow Jones Index is approaching a critical resistance zone. After a deep V-shaped recovery and clear bullish structure, price is preparing for a breakout.
Chart shows a clean long entry with a stop below the recent consolidation. A break and hold above 45,000 could lead to a move toward 46,000, and if momentum holds — up to 49,300.
Partial profit-taking levels:
— Target 1: 45,225
— Target 2: 49,380
Fundamentally, US equity markets remain strong, and DJIA may play catch-up after lagging during the last correction.

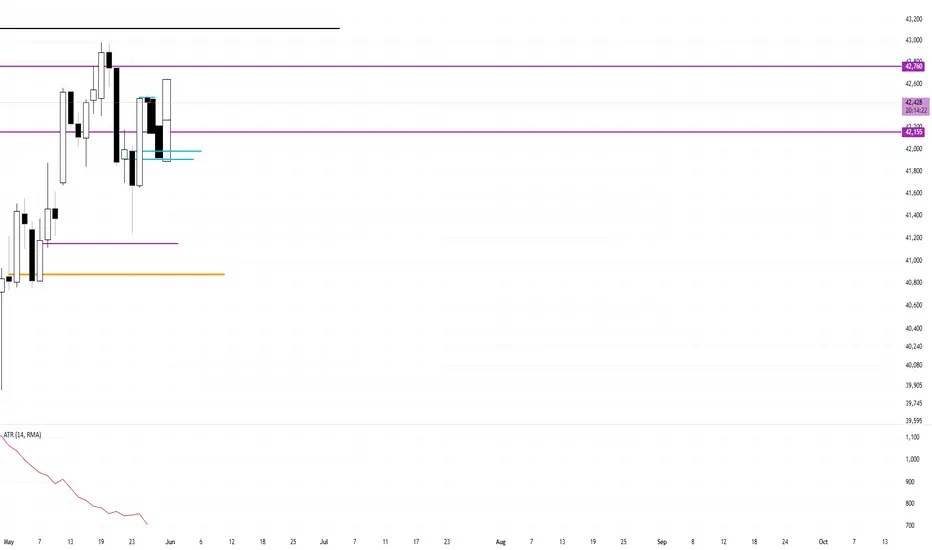
Bullish Pullback End of Month BuyAfter I thought we would see a sell continuation off of the March FOMC level of 42,155, price continued bullish.
I am using Thursday and Friday's opening price as support for a pullback. 41,912-41,968
I am expecting Wednesday and Thursday to be profit taking, pullback days in an upward trending bias.
This monthly candle is expecting to close near the highs.
The peak formation low formed confirmed higher prices.
Friday, May 30th 500-700 tick Buying Opportunity
Weekly Outlook on Nasdaq 100, S&P 500, Dow Jones 30Expecting range bound consolidations on Index triad. High Resistance. Not expecting any further monthly highs. Want Internal Liquidity which means shorts. But the daily and the weekly are opposing each other.

Next Week Still Bearish Bias Until Ramped Volume Taken OutThe ramped volume accumulation above the monthly open is the target for liquidity. I am going to be looking for a pullback to form the high of week and a continuation of the down move.
Next week is a short week due to the holiday. Therefore, should be a slow drift down.
This monthly bar is forming a market maker cycle. Instead of Wednesday being the midweek reversal, the 20th formed the mid-month reversal back down to where it started. It may even go a bit beyond.
I will be using 150 tick stops and 375 tick targets next week for 2.5R
I probably will take 2-3 trades. I am currently up 8% so far. If I lose the next three then I will close out May up 5%. I am satisfied with that number. If I can win one and lose one, then I will be closing May up 9.5%

Two potential GLOBEX trap plays.Potential GLOBEX trap Identified on the Dow Jones And Nasdaq Futures. Strong Area's of demand, Retracement would give a nice long set-up. Thoughts?
