OTHERS.D trade ideas

ALTSEASON IN COMINGhi Guys,
expect this will bounce on weekly chart
if it happen let's party with ALT

Alt season is closer than ever ! GRAB SOME ALTCOINS !I expect strong pumps for many coins in the next few days
WATCH MY PREVIOUS RELATED IDEAS BELOW

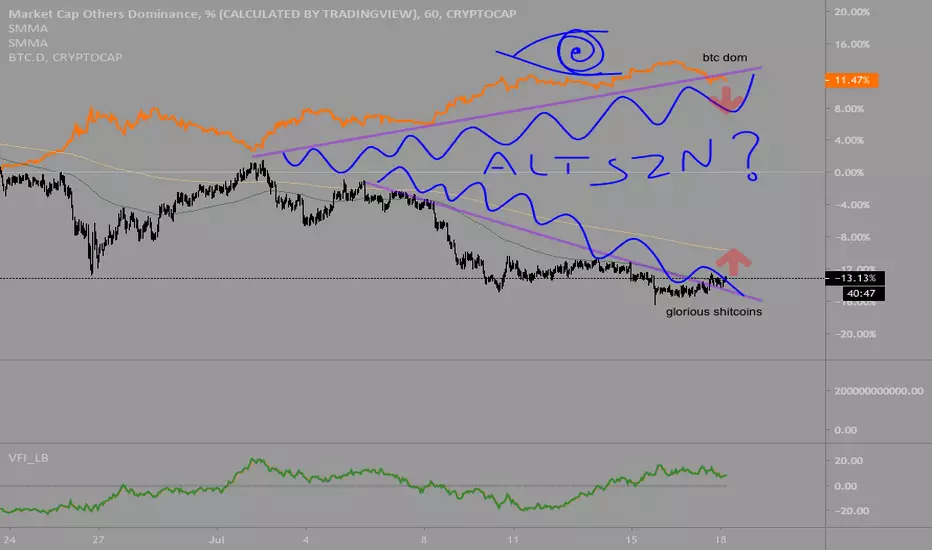
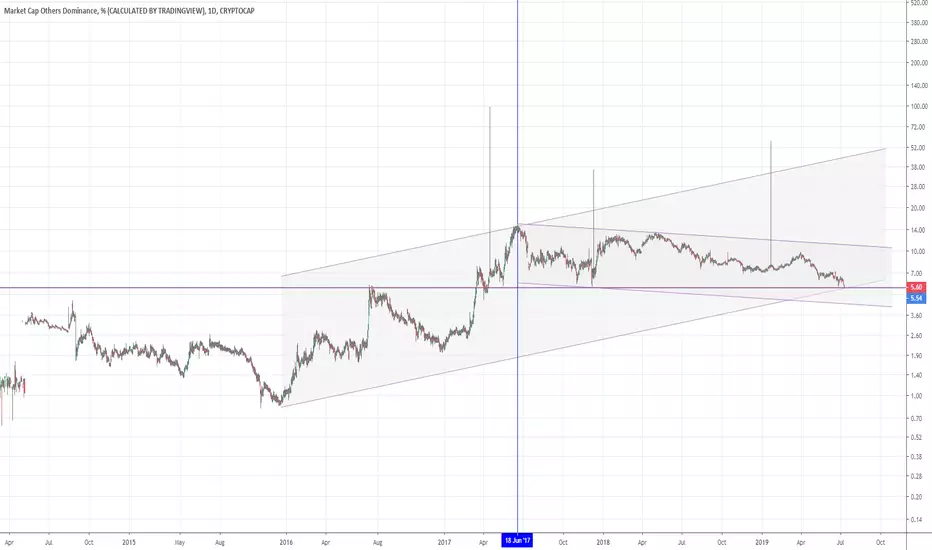
Altcoins, primed to EXPLODEJust watching the dominance charts on 'shitcoins'
A large wedge pattern has formed as altcoin dominance repeatedly tests the 5-6% level
This coincides with high in 2016, followed by a cupping action and the massive altcoin explosion in 2017.
Are we retesting the previous resistance as the new support level?
Here we see a huge RSI divergence forming - could this be a sign for reversal?
Are we primed for a huge altcoin party?
Fundamentals are quite bearish given the number of scams and failed projects, and slow adoption.
But overall technicals is printing bullish signs. You be the judge :)

Is it altcoin party time?Altcoin index has been trending down for over 2 years and has just touched a support level.

BTC D. against ALTCOINS D. ATLSEASON 2.0 COMING SOON !Blue quote - altcoin dominance, ( main chart )
Orange quote - bitcoin dominance.
Stochastic relate to the quotation of Altcoin dominance.
As you can see - technically these quotes is going to go in opposite directions to each other, which will mark the beginning of ALT-SEASON.
You can see a similar analysis technique below, with which I've identified the bottom of Bitcoin at 3500 $ this year.
PS. and remember - this is physics, like the water evaporates first, and then falls to the ground with rains,then it repeats over and over again, the same thing happens with money , so HOLD your altcoins, it's just the time to buy more!
Also you can see my previous forecast about - " Why I believe that ALTRUN will be and bitcoin will hit 100 k. "

Bitcoin Dominance, Weakening. When is altseason ?BTC.D Chart is currently demonstrating a flat top.
With 4 touches of the same resistance.
OTHERS.D has made 4 higher lows that coincide with the same 4 local tops on BTC.D
This leads me to conclude that Bitcoin Dominance could be weakening.

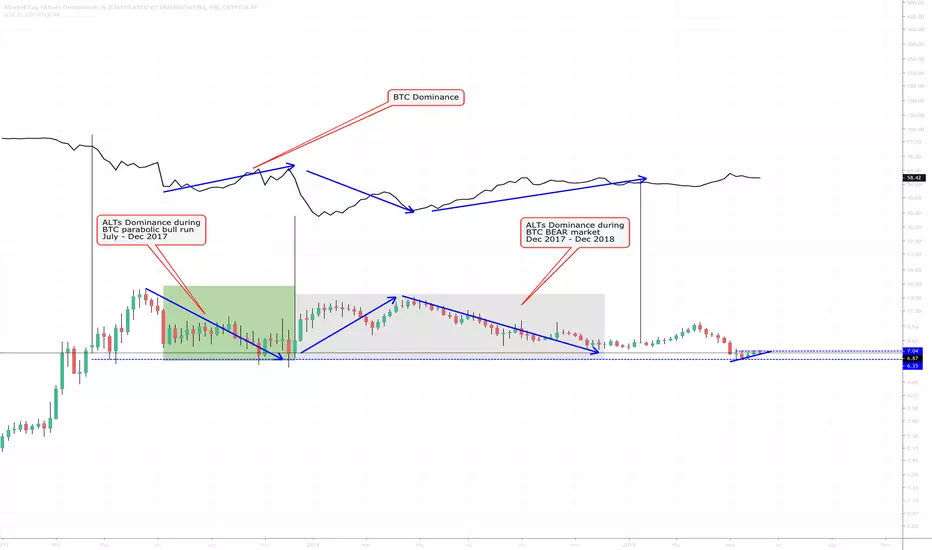
BTC vs ALT dominance in past 2 yearsI thought it would be interesting to compare what performed better in general during the BULL market of 2017 and the BEAR market of 2018.
To see if it can give us any lessons to be learned on what to favour if your going long.
Observation:
During the BULL Market, the ALTs lost significantly in terms of value against BTC.
During the BEAR Market, the ALTs gains were significant against BTC during the 1st 1/3 rd of the Bear trend and then later I suppose people abandoned the ALTs as news or progress slowed down in their projects.
As you can see, after the bottom of the market was confirmed in Jan, the ALTs gained a lot against BTC, but as soon as the BULL market was confirmed, BTC became dominant again. Backing the 2017 observations.
The chart conclusion:
BTC is still king.
ALT dominance chart, up close
Alternatively, another perspective
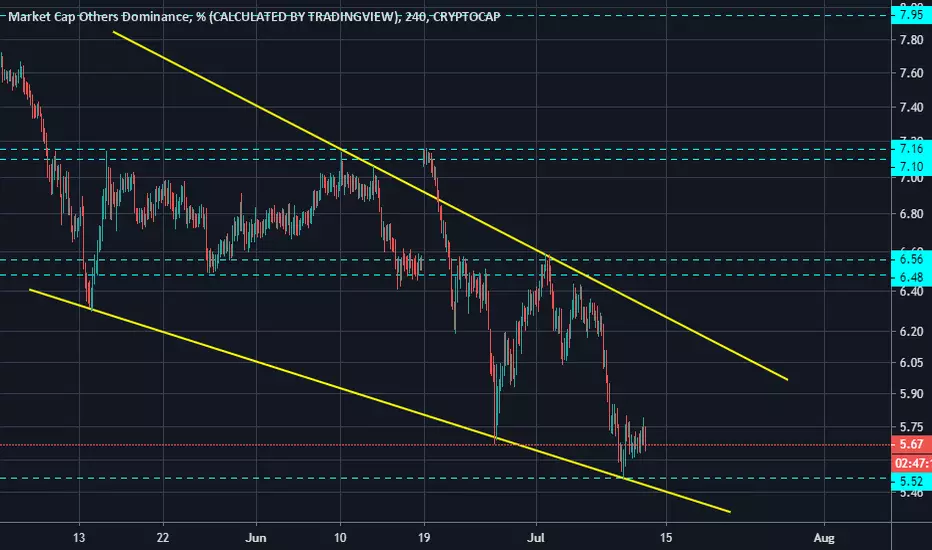
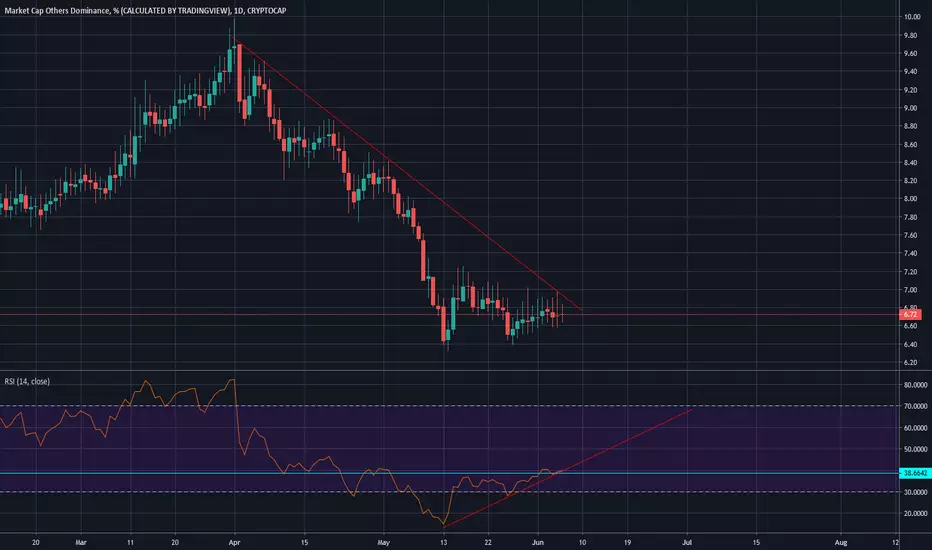
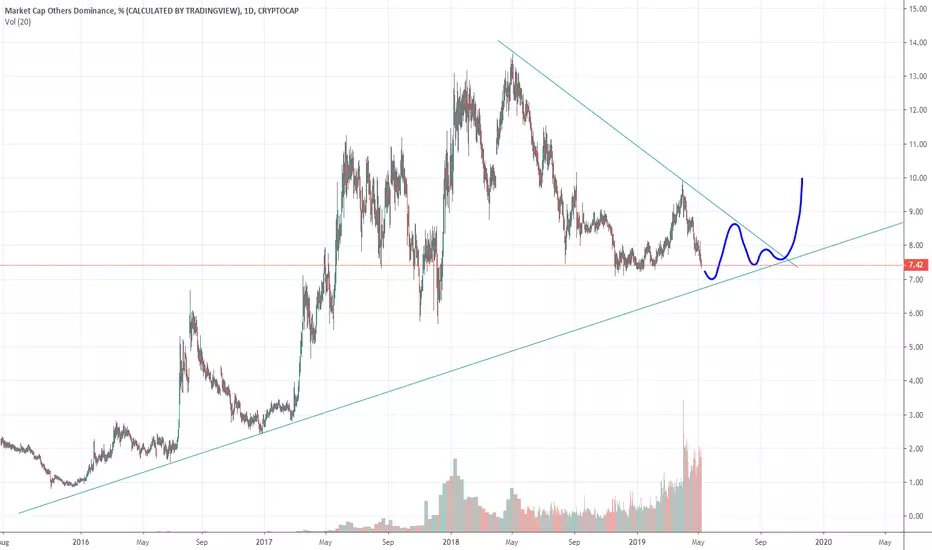
Altseason when ? Once we break this trendline, we could see a nice altseason. I recommend you to watch out the RSI too. The trend should not be broken.
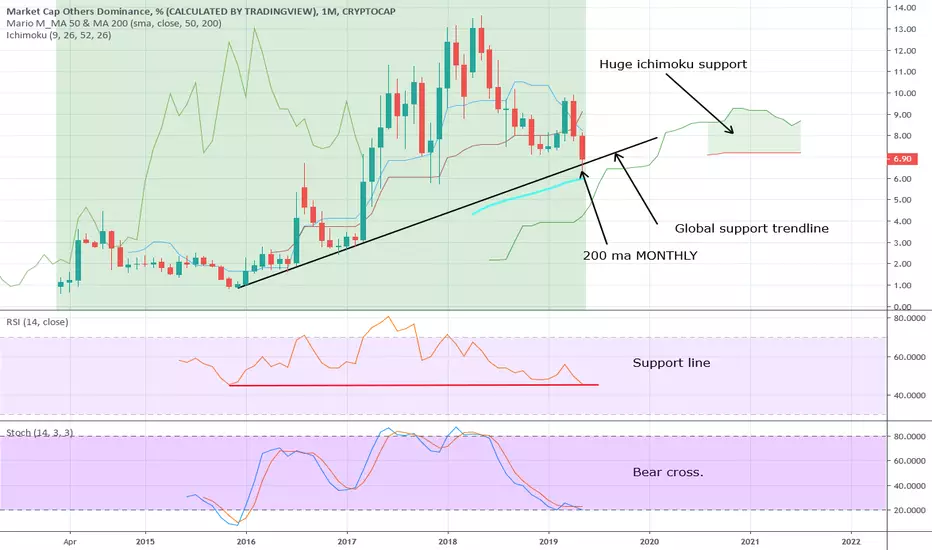
ALTCOINS REVERSAL
OTHERS.D -Altcoins dominance which are not in TOP15 is sitting in the global support trendline and below this trendline we have a huge 200ma support + support from ichimoku cloud. Those supports are extremly BIG because we are talking about MONTHLY timeframe.
At this point,can be a good reversal for altcoins vs BTC


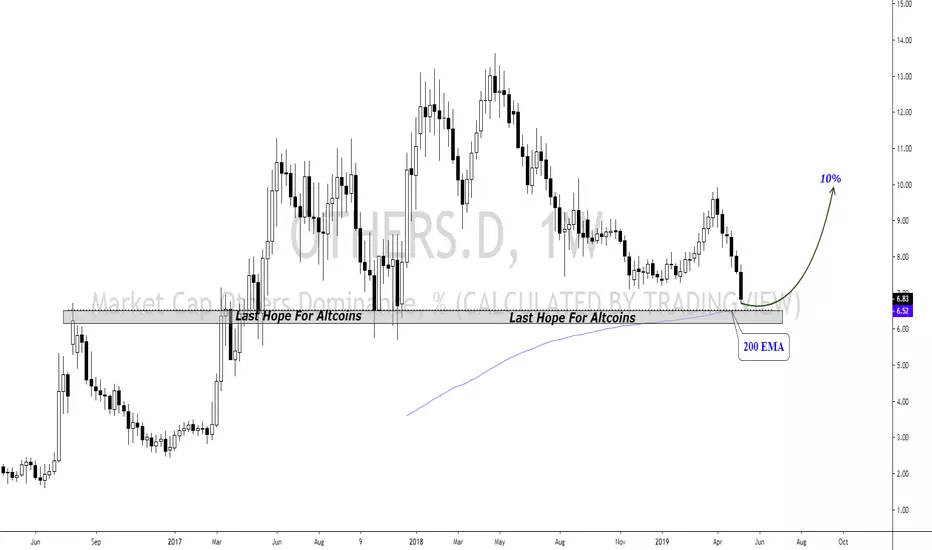
When Bullrun Sir..!!Altcoins Dominance Analysis
Last 6 Weeks Were Not Good For Altcoins because Of BTC Dominance At Peak..
June & July Will Be Good For Altcoins If Dominace Holds the 200EMA..
so keep Your Eyes On 200EMA Line
BTC Dominance Chart
Thanks For Your Time..
Altcoin Dominance nearing bottomLooks like altcoin dominance will hit lowest point this month of May, full escape maybe in Nov.
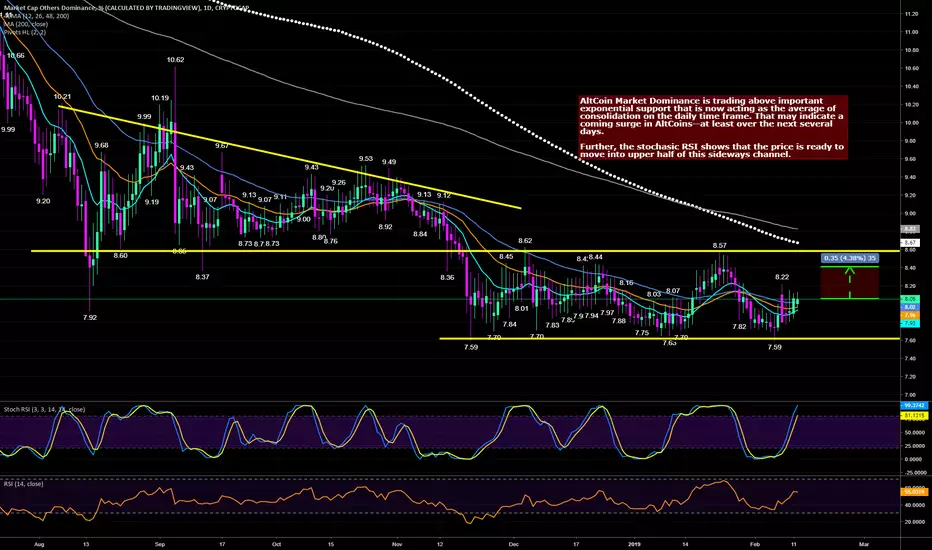
AltCoin Dominance Back-Testing EMA Support Before Next MoveAltCoin Market Dominance is trading above important exponential support that is now acting as the average of consolidation on the daily time frame. That may indicate a coming surge in AltCoins--at least over the next several days.
Further, the stochasic RSI shows that the price is ready to move into upper half of this sideways channel.
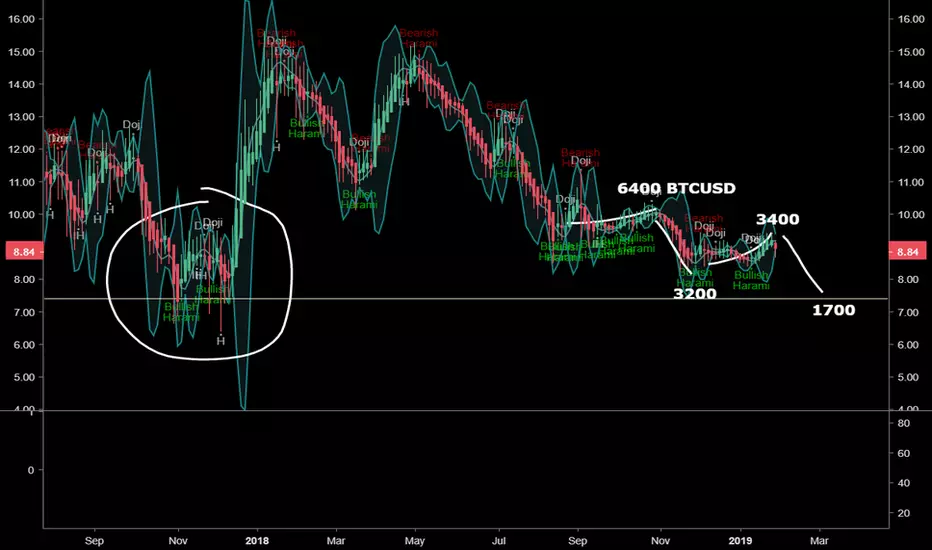
BTC could drop to 1800-1700 next weeksTicker : Others.D (OTHERS.D Market Cap Others Dominance %)
Just analyzing other cryptos, not directly BTC, as they are a proxy for crypto sentiments. A huge support on the left (November 2017) but below current levels, at a distance similar to november 2018 btc crash from 6400 to 3200 usd (50%). Just today a drop seems to point that this distance to the support zone are going to be covered. If that happen a drop in btc price to the highs 1' thousands (1700-1900) is possible.
See the pattern in my Stochastic RSI MTF study (below) is very simmilar to nov. 2018 pattern.