OTHERS.D trade ideas

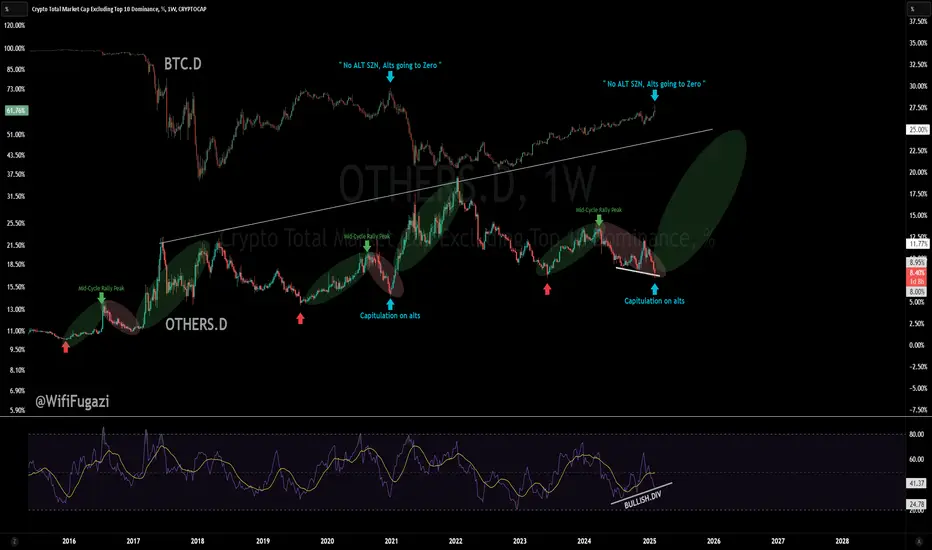
"NO ALT SEASON!!" - OTHERS.D vs BTC.D - Is this time different? "No Alt Season!!" – OTHERS.D vs BTC.D: Is This Time Different?
While no one can say for certain whether history will repeat itself, one thing remains clear: it often rhymes.
During the previous cycle, we witnessed an altcoin capitulation around the same time (cycle-wise), and the prevailing sentiment online was "No alt season" or "Alts are dead."
This period of pain in the altcoin market presents a significant opportunity for those with little to no altcoin exposure.
While I am cautious i do not think this time is different, there are notable changes in the current market dynamics tho.
Many altcoins will continue to underperform even as the eventual BTC.D breakdown (alt season) unfolds. However, it’s important to note that most altcoins will not reach new highs, with only a select few likely to lead the market. As such, it's crucial to revise your strategy, moving away from holding onto outdated or underperforming assets, even if it’s difficult given the emotional attachment many of us have to certain coins. Understand that, in this cycle, there are simply too many coins for all of them to reach their all-time highs. Act strategically, and if you find value in this post, please consider following and supporting my account and leaving a boost on this post. Thank you.
Will the price suffice here and give us a double bottom !?CRYPTOCAP:OTHERS.D
On the weekly chart, we see the price returning to the June 2023 low, and we have a noticeable rebound from the support zone.
It is still early but we may have the beginning of a double bottom formation in this zone and this will definitely not be confirmed unless the price comes out of the downtrend and the neckline .
Currencies are still very low and their prices have been pressured significantly, and Bitcoin's dominance in the market is still high, but I think that if this chart is achieved, we will have a very strong and different season from previous seasons .
We'll be back to this chart soon. ⌛️
Good luck ..

Others has completely bottomed out to December 2016 levelsIgnore the noise, what's happening is unprecedented.
You wanted an explosive altseason and Bitcoin to hit 1 million dollars?
Well, be careful what you wish for, this is not an alt season. It's the beginning of the end for the United States Dollar. It's escape velocity before a gigantic financial great reset around 2030.
Things are about to get extremely crazy for all financial assets against the dollar.
Why you may ask?
Donald Trump is performing a brexit 2.0.
He's nationalizing the US & this could collapse the dollar as a global reserve. So imagine witnessing a 1923 Weimar Republic scenario in the U.S.A as everything appreciates roaringly sky high & balloons against the dollar to trillions and trillions of dollars.
Some may call it an industrial revolution, others may call it hyperinflation.
We are probably underestimating how severe the whole tariffs war situation, the Bitcoin arms race, the AI arms race and a myriad of countries shifting from globalization to radical protectionism. What makes this scenario different is that back in 2017, the tariffs war was new. Now Trump is being radical and other countries won't follow his lead, they'll turn their backs on him as more and more countries become protectionist.
Ray Dalio has talked about this,
Kenichi Ohmae, Mike Maloney and many others too.
The dollar has peaked and everything is about to moon.
Welcome to the Roaring 20s

OTHERS.D Potential Bottom forming / Close to happening?
The OTHERS.D chart represents the total market caps of all coins excluding the top 10.
This chart can help you identify the strength of altcoins and the times to scale into altcoins.
In the past, during bull markets, we’ve seen OTHERS.D experience huge rallies, but always prior to this happening, we see "altcoin capitulation," where OTHERS.D corrects hard, causing fear and uncertainty across the board for altcoins. This is the necessary step that has to happen in order for things to "align" before the actual alt season comes — the one when real rotation money flows from Bitcoin into altcoins, something we have yet to see for the vast amount of altcoins across the board due to Bitcoin being very strong.
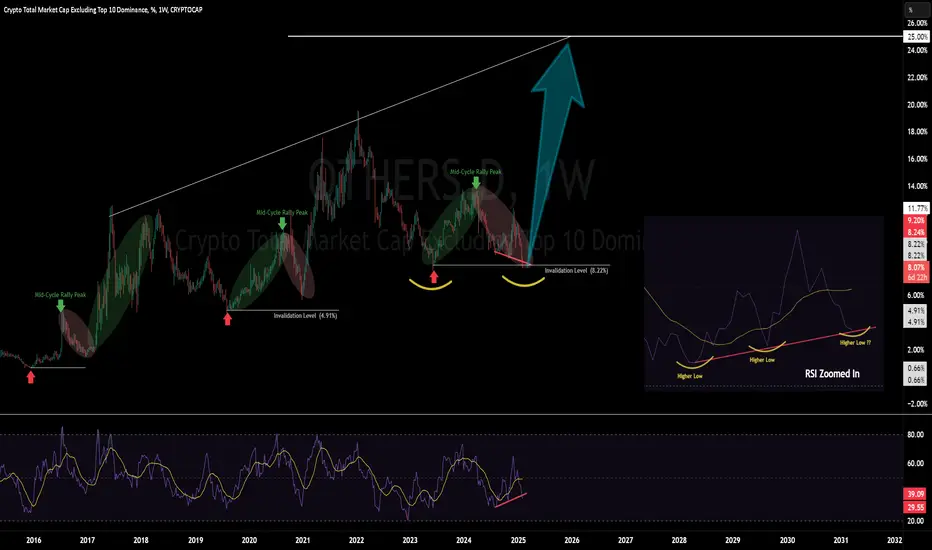
The chart here is kept as simple as I could keep it, because I tend to think we overcomplicate things.
Per cycle, there are 3 components:
1. Bottom
2. Mid-cycle rally
3. Deep and nasty correction across the board for altcoins
We either put in a double bottom for the OTHERS.D chart or we go on to have a "bear trap" / "spring" event. Both come with major altcoin capitulation across the board. These painful times serve as great opportunities for those who buy the fear and sell the greed.
Invalidation of this idea would be a weekly close below 8.22%.
It's time for low caps to catch upCould this be the start of Altseason?
it looks like a double bottom

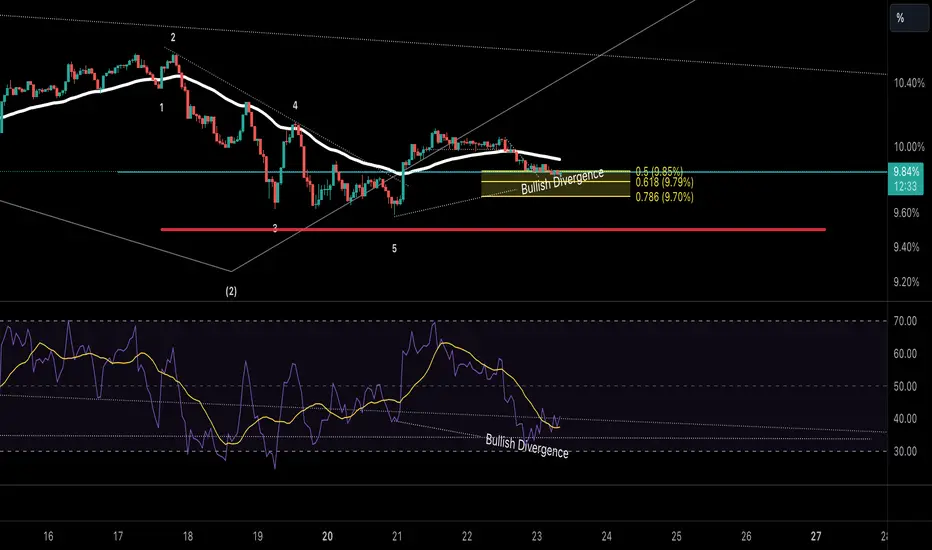
Skyrexio | If This Happens Altseason Is In DangerHello, Skyrexians!
Today we have the sad analysis for you because altseason really has the high likelihood to be cancelled. The main chart for that CRYPTOCAP:OTHERS.D is about to break the great formation for trend continuation. If this will happen altcoins will lose -80% of its price. It's not a big secret that this cycle majority of people have a lot of altcoins, that's why only Bitcoin pumps from month to month.
Let's take a look at the weekly time frame. After the previous altseason price is printing triangle shaped wave 4. This wave is about to be finished, but I feel something bad. ABCDE pattern will be broken if this triangle is going to be broken down. It can be fatal for altcoins, taking into account the fact that Bitcoin has also great probability of correction.
What can save altcoin's holders? The green dot on the Bullish/Bearish Reversal Bar Indicator will give us confidence that the wave 5(green scenario) will happen. Otherwise, the next station is hell for alts.
Best regards,
Skyrexio Team
___________________________________________________________
Please, boost this article and subscribe our page if you like analysis!

Alt season is coming!The symbol "OTHERS.D" refers to the "Crypto Total Market Cap Excluding Top 10 Dominance, %" index. This metric is used to track the performance of the cryptocurrency market, excluding the dominance of the top 10 cryptocurrencies by market capitalization. Essentially, it provides insights into how the rest of the market (i.e., cryptocurrencies beyond the top 10) is performing relative to the overall crypto marke
The Altcoin Index appears to be nearing the completion of a major bearish leg. It has reached a crucial level, and if it revisits the optimized zone, there could be a significant rejection to the downside.
For the medium term, however, this index looks bullish, showing potential for upward movement if it holds above key support levels.
Alt season is coming!
For risk management, please don't forget stop loss and capital management
Comment if you have any questions
Thank You

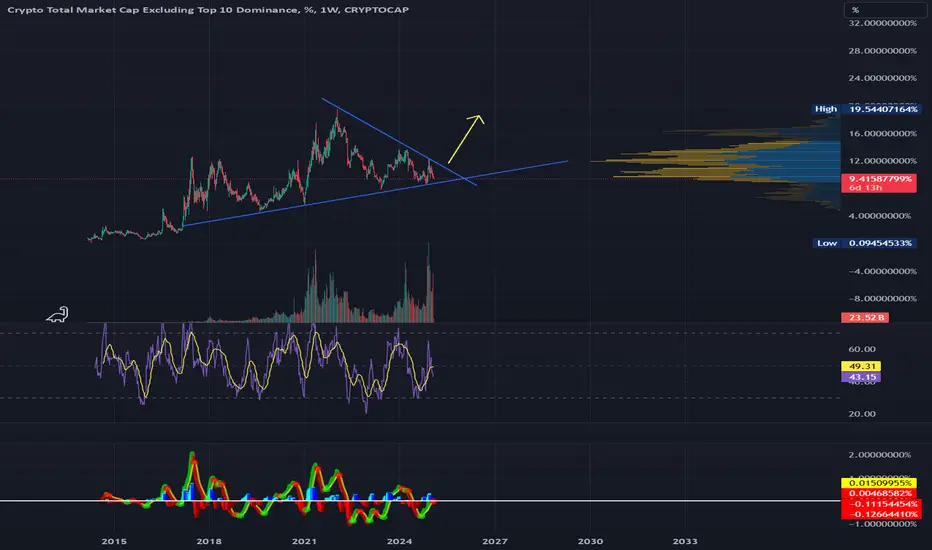
Others.D Bullish AccumulationKey Observations on the Chart:
Triangle Pattern:
A descending triangle is forming, indicating potential for a breakout.
The price is near equilibrium, meaning a strong move is imminent.
Falling Wedge Formation (Bullish Reversal Pattern):
The pattern near strong support suggests a bullish breakout is likely.
Buy and Sell Signals:
Buy Zones: Identified near support areas (blue & green zones).
Sell Zones: Located at major resistances (red zones).
The indicators confirm buy and sell entries at key levels.
Key Support and Resistance Levels:
Support at ~7.12% & 4.62% dominance (strong historical demand zone).
Resistance at ~12-14% dominance (historical rejection zones).
Indicators:
Stochastic RSI: Overbought levels indicate sell-off risks, while oversold levels confirm buy opportunities.
Momentum Indicators: Show potential trend reversal near strong support.
Precise Buy and Sell Zones for Altcoins:
🔵 Buy Zones (Accumulation Areas)
Between 8% - 9% dominance
Alts are undervalued at this level.
Look for bullish confirmations like RSI recovery and volume increase.
Strong Buy Zone: 7.12% - 4.62% dominance
Historically strong demand zone.
Best long-term accumulation for altcoins.
🔴 Sell Zones (Distribution Areas)
Short-Term Resistance at 10% - 11% dominance
If price rejects this level, take profits.
Major Resistance at 12% - 14% dominance
Historically strong selling pressure.
If altcoin dominance reaches these levels, start scaling out.
Final Target: 19.54% dominance
If altcoins pump aggressively, this is the ultimate exit zone.
Summary
Current Trend: Sideways consolidation within a triangle pattern.
Next Move: Expect a breakout (likely bullish).
Buy Areas: 7.12% - 9% dominance for long-term accumulation.
Sell Areas: 12% - 14% dominance for profit-taking.
Long-Term Target: 19.54% dominance (if altcoins rally strongly).

When Will the 2025 Altcoin Season Arrive? Clue from OTHERS.DCRYPTOCAP:OTHERS.D is copying the same script as the last two altcoin seasons.
I’ve marked points 1-8 in the structure.
Each time, it formed a triangle consolidation before breaking into a bull run.
In the last two cycles, point 8 was the final low before the rally.
Right now, it's retesting point 8, which is the lower boundary of the triangle.
Will it repeat the script and break out, or is this time different?
Could we see a new scenario, or is it possible that altcoin season won’t come at all?
If the altcoin season does happen, OTHERS could 2x from here.
What do you think?
Do you believe we’ll see a crazy 2025 altseason?
for more future script "guesses" like this!
💰 Bitget 20% Trading Fee Discount:
lihi2.com

ULTRADANGEROUS SITUATION.Within 1-2 weeks the dominance of altcoins should
push momentum upwards to prevent a death cross of
EMA 200 and EMA100. It's best not to even think about it.
Wen Alt Season? - Others.D shows the wayCRYPTOCAP:OTHERS.D is the relative market cap % of all crypto outside the top 10.
It has been in a multiyear triangle - A break above the resistance would be a strong signal of alts outperfomance with an extensive run into 2026. It appears that for this cycle, everything is taking much longer than what we're used to.
Equally, a break below, would signal the dominant currencies will be extending their dominance with alts languishing
Human Greed dictates we will have a crypto rotation from the dominant currencies to alts. Which way do you think this will break?
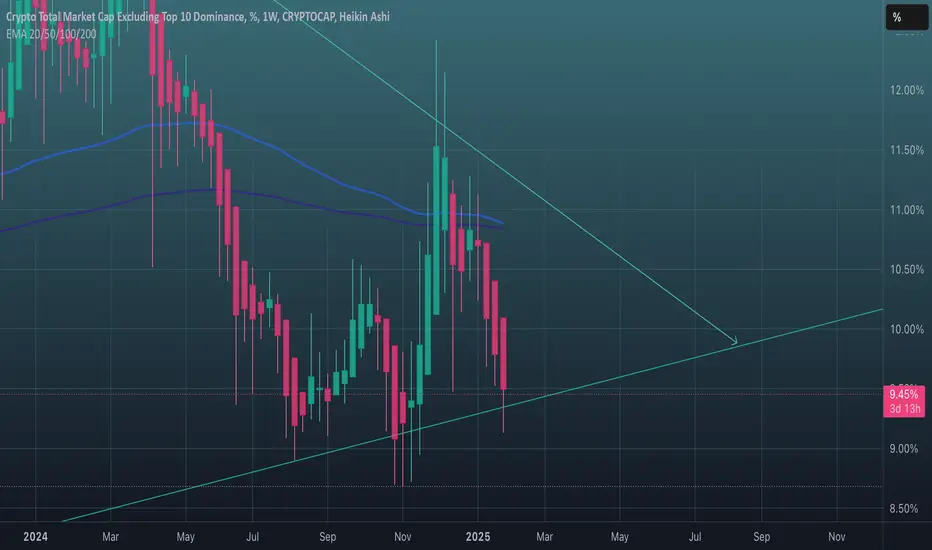
OTHERS.D Still Downtrend and RetestingOTHERS.D Still down trend and still retesting trendline
Its normal when in big timeframe 1D has a long wick
we need to refill and now still in progress.
Max pain is around 9%, but we can pump anytime IF liquidity on TRUMP end

OthersOthers are demonstrating a bullish divergence on the 1-hour time frame.
Will alt coins experience a price increase today or possibly tomorrow?
MACD and a MiracleThe Altcoins need a miracle. We unfortunately have bearish MACD (Chris Moody) cross over on the weekly chart. However, the ALTS have been in a range since August, the price is resting on a Demand level hopefully, optimistically this Demand level would hypothetically mean there will be enough support to trigger some bullish activity but traders must be careful because if the Demand level holds the ALTS are still in a range and price could swing low again. So this week and next week maybe pivotal for ALTS.

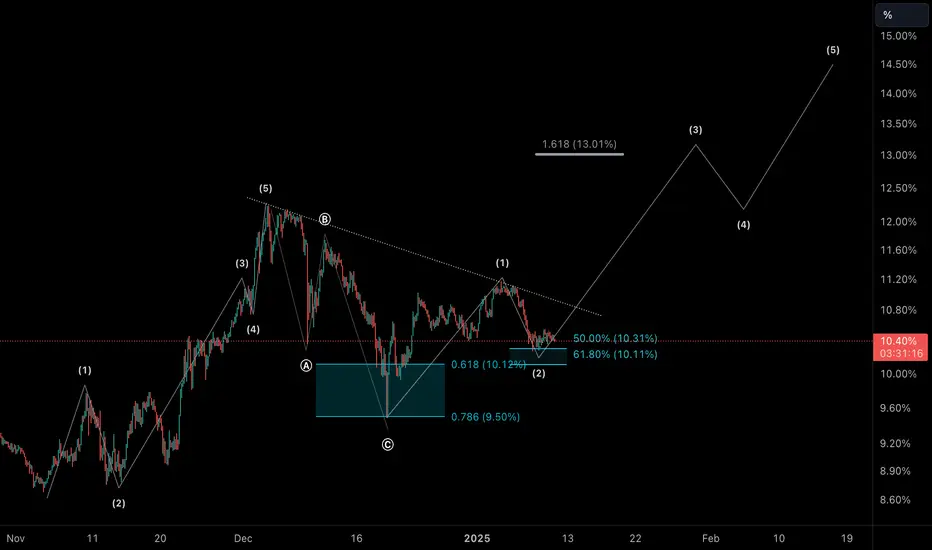
OTHERS ALTSEASON X100?This is my thesis regarding an altseason that excludes the dominance of the top 10 cryptocurrencies. I believe we still have the potential for a massive altcoin season, though the exact timing remains uncertain. However, this wave count provides valuable hints and clues, suggesting that a significant altcoin rally is on the horizon.
It’s all about finding the right timing. I anticipate that Bitcoin reserves and further crypto adoption by institutions will serve as key bullish catalysts, propelling the market into a major altcoin season.


Others.dOthers.d looks like it’s in for a world of hurt. It missed its upside target by a mile, and is looking head and shouldery. Value is flowing into those top ten or fifteen coins. So, BTC.D can pump to 95%, and while the TOTAL test $10T, and while top 9 (top 10 minus BTC), also match or most likely outperform BTC. To understand how this can happen, you need to grasp how much crap is out there. People think they are buying actual real estate, and it could not be further from real. Shitcoins will go through the woodchippers, as value flows toward quality.


OTHERSNothing changed from the previous charts. The 0.786 Fibonacci blue zone still holds. Wave III potential is against this zone.

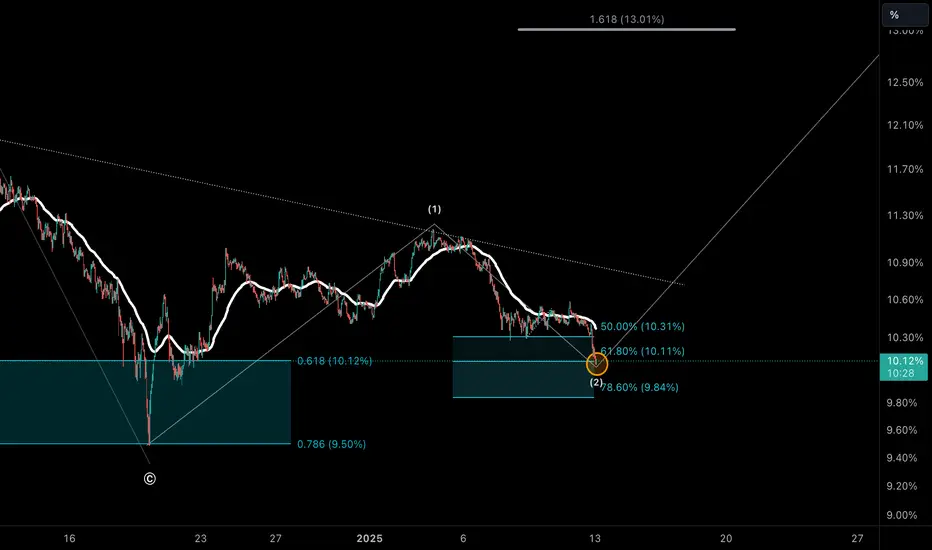
OTHERS Others will need to print this impulsively to confirm the alt season. This idea is against the blue support where the price appears to be consolidating.
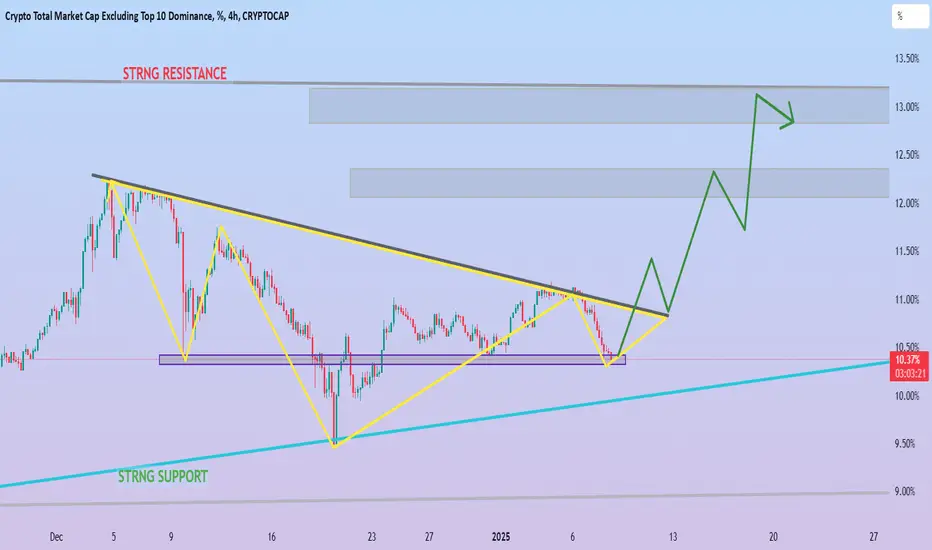
BTC.D Breakdown + ALTs Volume Profile | Key Market RotationCrypto Ex-Top10 Dominance: Bull Breakout Setup | Alt Season Indicator |
MY VIEW FOR NEXT 2-3 WEEKS
Current: 10.37% (-0.79%)
Vol: 375.29B
Pattern Setup:
- Double bottom at 10.3%
- Strong support trend holding
- Descending resistance line test
- Projected breakout to 13%
Levels:
- Strong resistance: 12%
- Current resistance: 11%
- Critical support: 10.3%
- Trend support: 9.5%
Trade Plan:
- Targets: T1: 11.5%, T2: 12%, T3: 13%
- Stop: Below 10.2%
- R:R = 1:3
Market Impact:
- Rising dominance suggests alt rotation
- Mid/low caps potential breakout
- Watch ETF impact on rotation
DYOR - Not financial advice. High volatility expected with ETF news.