Is it ALT Season soon ? A New ApproachNearly Everyone looks to BTC.D to judge when ALT season starts, and while it is obviously Not wrong to do so, I have Looked at OTHERS.D for a while. alongside BTC.D
And this is what I find.
But first, a little History lesson. Bitcoin began in 2008 and was obviously The only one.
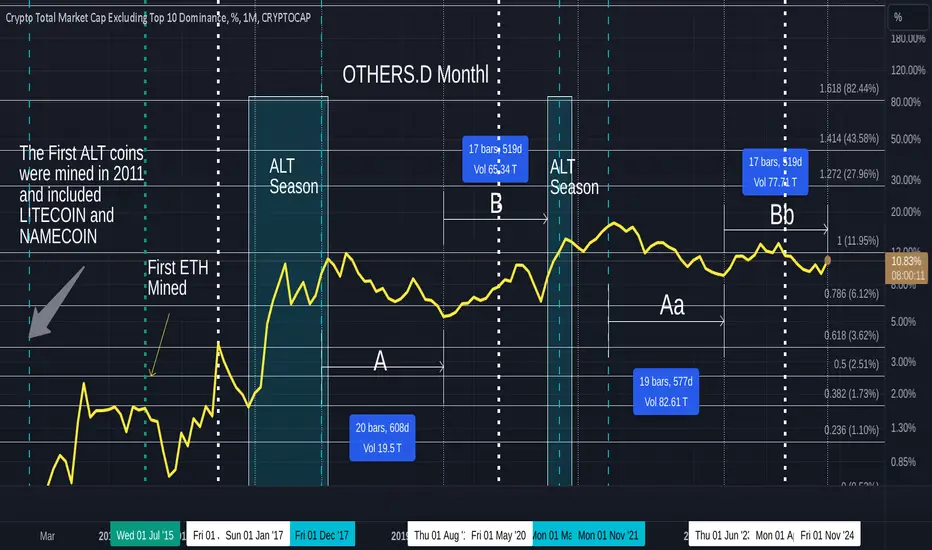
The First ALT coins were mined in 2011 and included LITECOIN and NAMECOIN.
ETHERIUM was not created until July 2015 - ETH is NOT the original ALT by a long way but it was marketed better.
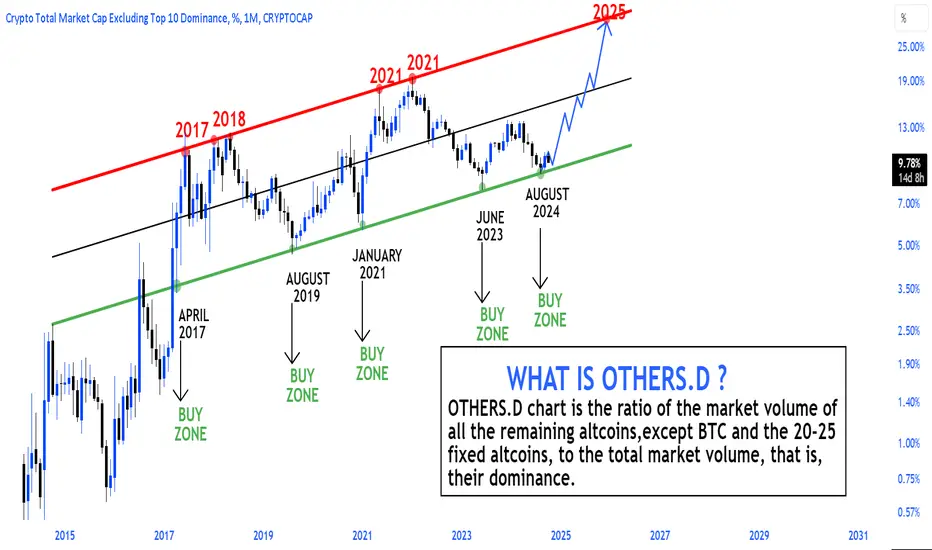
So, What is OTHERS.D
The symbol "OTHERS.D" refers to the "Crypto Total Market Cap Excluding Top 10 Dominance, %" index. This metric is used to track the performance of the cryptocurrency market, excluding the dominance of the top 10 cryptocurrencies by market capitalization.
Or the Mid to Low Cap ALTS
Previous altcoin seasons have witnessed remarkable surges in various altcoin prices, with some experiencing exponential growth within relatively short periods. Examples of notable altseasons include the bull runs of 2017-2018 and 2020-2021.
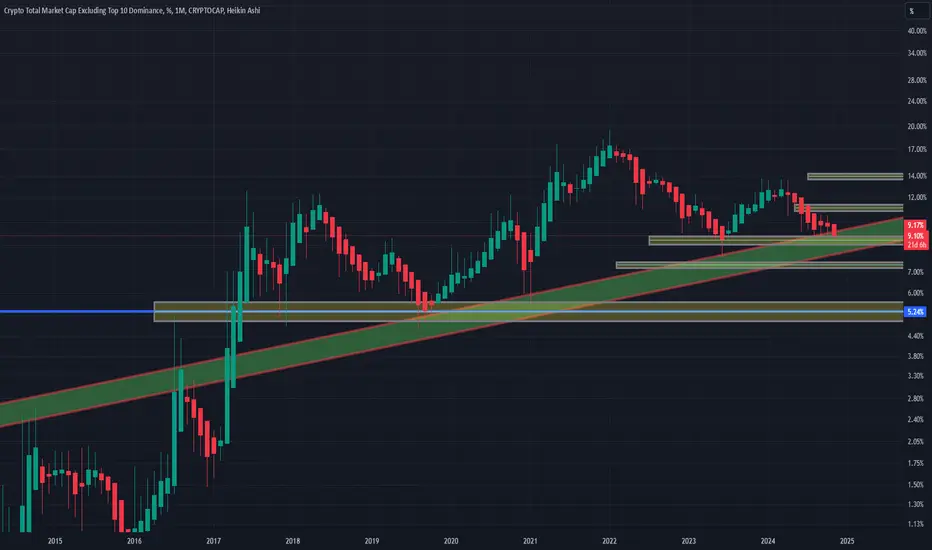
To the Chart
Vertical bold gashed lines are Bitcoin Halving dates
Vertical Green dashed lines are Bitcoin ATH dates
Green Boxes are ALT seasons that lasted more than a week.
We have had only 2 real ALT seasons previously and, if I am honest, it may remain that way.
Bitcoin has attained Mass adoption now and Corporate ownership.
But Time will tell and the ALT market is still seen as THE money maker.
But Bitcoin Dominance has to drop for ALT season to begin - OR DOES IT ?
YES - But we can also see how the Lower Caps rise, outside of the ETH based ALTS
The REAL ALTS, like LTC Run with this chart
And I wan to show you something I have noticed.
See the Day count from BTC ATH in Jan 2018 to the Low in August 2019 ( A ) of 608 days
From there to the beginning of the next ALT season was 519 days ( B )
From the ATH in Nov 2021 to the Low in Jan 2023 was 577 days ( Aa )
If we project a similar day count for Bb as we had for B, it takes us to --Drum Roll-----
NOW ( this is a monthly chart so we need an allowance of error of at least 15 days either way )
Also note how ALT season begins BEFORE BTC ATH
And with predictions of ATH in March to Dec Next year, this works out well.
BUT I WILL SAY - this is based of only 2 previous occasions and you will also note how much SMALLER the 2nd ALT season was.
As I said at the start, Bitcoin is THE Crypro. It will always be number 1
The Multitude of ALTS entering the market have not changed that.
But BTC.D just took a fall in the last 24 hours, ALTS Are running Hot right now.
ALT SEASON MAY HAVE JUST BEGUN
OTHERS.D trade ideas
alt season is about to beginIn this chart i have marked the potential demand zone from where 2025 alt season is about to begin.this is my perspective don't take trade blindly, after all you have to face the consequences of your decision. #DYOR
Expecting the Peak of Altcoin Season Starts in Q1 Hello,
Based on historical trends, I've observed that January and February are typically bullish months in the cryptocurrency market. During past bull runs, like 2021, altcoins often outperformed Bitcoin, driven by increased retail and institutional investment in smaller-cap cryptocurrencies. I anticipate that the peak of the altcoin season will likely begin in Q1 of the upcoming year.

BIGGEST MONEY PRINTING SEASON 2025 COMINGBIGGEST MONEY PRINTING SEASON 2025 COMING ??
yes , you heard it right my friend 🤝..
we are about to explode big on altcoin season soon 🔥
but how ?? and why???
then see this chart of OTHERS.D ( total crypto cap minus top 10 market cap) which is a index for all mid caps and small caps coin.
STUDY THESE THINGS 👇
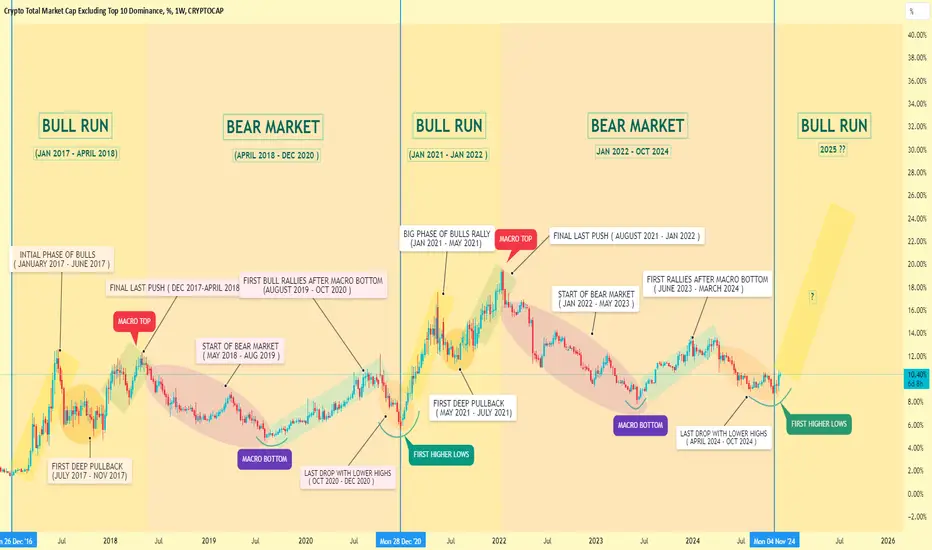
(1) STUDY 2017 BULL RUN VS 2021 BULL RUN
(2) STUDY 2018 bear market vs 2022 bear market
you will find hell lot of similarities in this chart that how every cycle altcoins pretend to follow the same pattern and same type of rallies always.
Study yellow box, yellow circle, green box, purple circle , blue box and brown circle mentioned in charts of 2017 and 2021 cycle.
everything there I have mentioned date wise 👍 and all the rallies and truly identical to each other✅. That means we can see similar type of price action in 2025 as well which is about to start soon 💥
IMPORTANT PART TO NOTICE 👇
Study alt season 2017 vs alt season 2021 ( yellow box )
In 2017 alt season others.d started the rallies in Jan 2017 and ended up till June 2017 ( roughly 6 months ) and exact same thing happened in 2021 alt season where rallies started from Jan 2021 and ended up in may 2021 ( roughly 5 months ) .
So now with that reference we can easily expect 2025 altcoin season to start soon and last at least 3 months which is not even started yet
so far there is no sign of any weekly breakout on others.d index which happened in previous cycles of 2017 and 2021 ( yellow box rallies ). that means whole game is still left
so this chart is your reminder to not sell your altcoins early and hold tight at least for next 6 months.
the money printing season is yet to begin
life changing money will be made in next few weeks.
be ready and be prepared enough to make the most out of it.
ALTSEASON 2025 IS LOADING...….
if you have read this tweet till last then my friend you are awesome and you will make big money this season for sure...
so all the best from my side 👍 and save this chart for future.
Bitcoin vs. Altcoins Dominance📊 Others.D/BTC.D: The Battle of Bitcoin vs. Altcoins 🔄
This historical 1W line chart highlights the ongoing tug-of-war between Bitcoin and altcoins' dominance.
The dominance ratio has shifted up-down-up-down within a long-term channel, with a notable fakeout below the 0.5 Fib level in Oct/Nov. This fakeout coincided with a touch of the bottom channel, signaling a potential pivot.
💡 My take:
Even with Bitcoin in an uptrend, this chart suggests that Others.D/BTC.D could also trend upward, signaling that altcoins might outperform BTC in the near term.
This chart provides valuable insights into pivot points for alt/BTC seasons, making it a great tool for timing rotations.
🚨 Caution:
I don't view this as a strong sell signal, as Bitcoin tends to hold more smart money, while altcoins attract retail. This dynamic means altcoins can maintain or even increase value during broader bear markets.
🔍 Keep an eye on the channel boundaries and Fib levels for clues on the next pivot in this dominance war.
What do you think? Will altcoins rise against Bitcoin, or is BTC dominance here to stay? 🤔
#Crypto #Bitcoin #Altcoins #TechnicalAnalysis #MarketCycles

OTHERS.D 50.00% FIB CRITICAL LEVEL **Hello dear altcoin degens, HODL-ers, and traders,**
How are you doing this Saturday? I hope you’re enjoying the weekend in your own unique way!
This is **OTHERS.D**, the index representing the market cap of altcoins outside the top 10. On the weekly time frame, there are several key points of interest that could help us analyze what might happen next. However, as always in trading, nothing should be taken for granted.
**Key Observations**
1. **Higher Lows Trendline:**
- We can clearly see a series of higher lows, starting with the bottom formed during the week of **June 5, 2023**, and another higher low during the week of **October 28, 2024**. This upward trendline is a promising signal for the altcoin market.
2. **The Role of the 21MA (Moving Average):**
- Historically, the 21MA has acted as a reliable support level before price moves higher, as seen between **July 17,2023** and **August 7, 2024** (highlighted with a green circle).
- Currently, the price is trading above this 21MA, which is an encouraging sign.
3. **The Critical 50% Fibonacci Level:**
- The 50% Fib retracement level has historically been significant. The green circle highlights how this level previously served as the launchpad for an upward move.
- At present, the price is trying to break through this level, which is acting as resistance.
**Combining Support Factors**
When we combine the **21MA** and the **50% Fibonacci level**, we get an area of strong support/resistance. For now, the price is attempting to break through this resistance zone.
**What’s Next?**
- If the weekly candle closes **above this critical area**, it’s a bullish signal and great news for those hunting the elusive **altseason**!
- Until then, we wait. The weekly close will provide more clarity, and based on the outcome, we can decide on the next course of action.
**Final Note**
Patience is key in this game. Stay safe, and let’s see how this plays out!

Dominance ALTCOIN CYCLEUnlock the Ultimate Guide to Maximizing Your Crypto Profits!
With our exclusive graph, learn to pinpoint the perfect timing to:
Buy altcoins: when their growth potential is at its peak.
Switch back to Bitcoin: to secure your gains and leverage its relative stability.
A clear and powerful tool to optimize your investment strategy in an ever-evolving market.
No words, just data. 📈
Let the numbers and cycle speak and make smarter decisions!
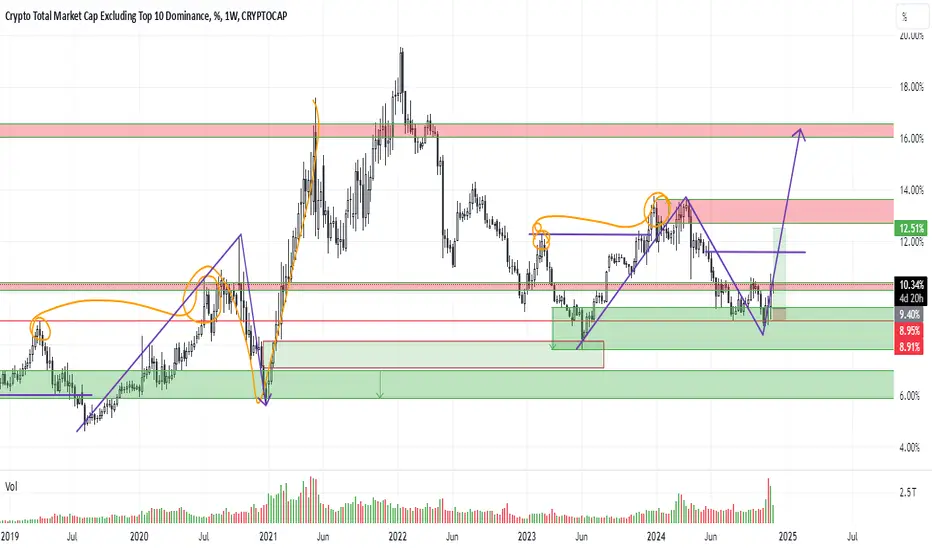
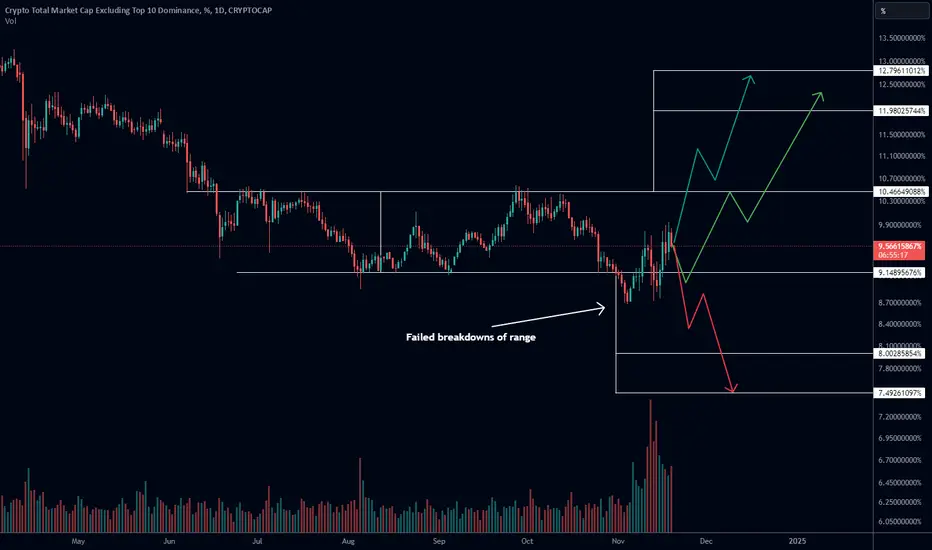
Simple Conditions for Alts to Continue Moving vs BTCVery simple chart and conditions for altcoins to gain or lose dominance vs Bitcoin in the present market:
Others dominance needs to hold above ~9.15% and break and then hold above ~10.5%. Do that and it'll keep gaining dominance towards ~12-13%
Lose 9.15% and fail to reclaim it a 3rd time and alts will continue losing market dominance vs Bitcoin, heading down towards ~7.5-8%
I like to think there is a good chance we at least test the area above 10.5% seeing as we failed to remain below 9.15 after two attempts, the 2nd with a higher low. Failed breakdowns often tend to lead towards breakouts or at least breakout attempts (and vice versa)
That said, we may still yet test 9.15 or below one more time and... if we do, we'd want to see another higher or at least a same low and then a recovery of 9.15 if lost for it to head back up towards 10.5.
Some very roughly drawn possible paths are shown on the chart.
Best of luck!
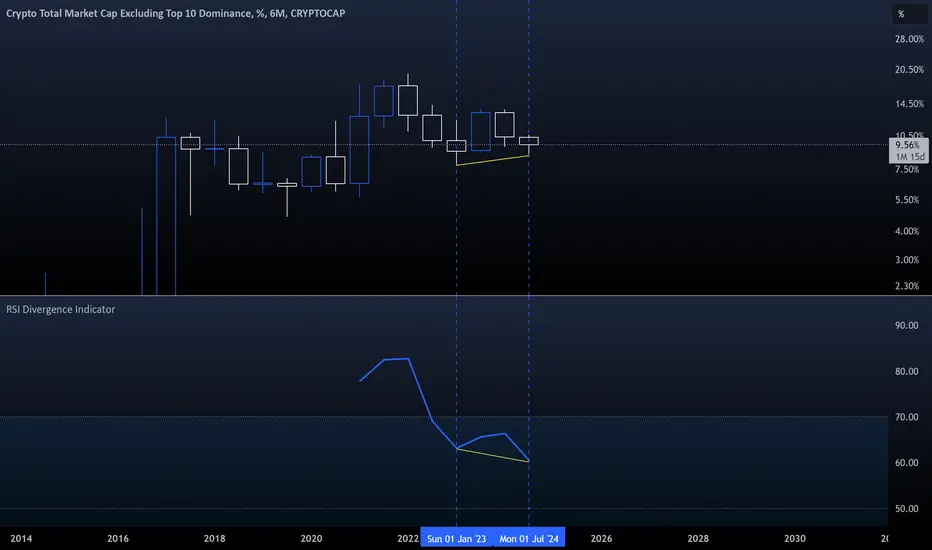
The Others Part 3- 6M Timeframe Simple Update:
- Divergences are the ultimate tool for timing entries.
- Think long-term—play the big picture.
- Keep DCA’ing into altcoins for stronger positioning.
- Exercice more patience and be ready for the rush.
- Buy before the moon move, sell at the moon.
Happy Tr4Ding !
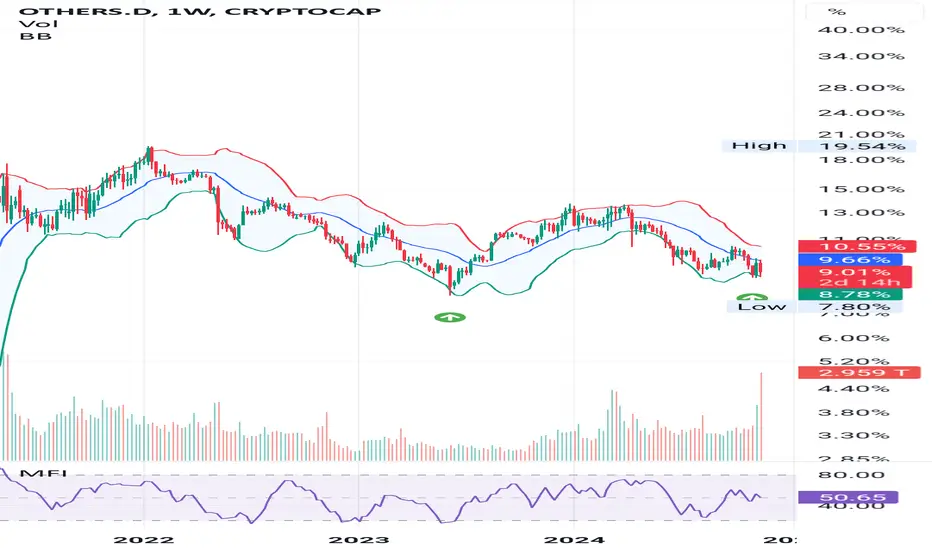
OTHERS D. HIGHER LOW @ BB SUPPORTHello, dear altcoin enthusiasts! Happy Friday!
This is OTHERS.D on the weekly chart. FYI, OTHERS.D represents the total market cap of crypto excluding the top 10 altcoins.
A higher low appears to be forming on the weekly time frame, with the Bollinger Bands holding as support. If this level holds, it could mark the starting point of the next altseason. However, we must wait for the weekly close to confirm. Patience is key.
The next update will be on Sunday. Stay safe and enjoy these wonderful days we’re living in!
You have to be ready for the Altseason 2025- In the 2013-2017 cycle, alt season started 203 days after the halving and the main growth phase lasted 175 days.
- In the 2017-2021 cycle, alt season began 231 days after the halving and the main growth phase lasted 140 days.
Given these historical trends, I can assume that in this cycle, alt season may also start around 231 days post-halving, with the primary growth period lasting about 180 days.
Make sure you have all the tools and knowledge to maximize your profit this alt season 😉

Altcoin Investigating the trend of altcoins and support and resistance. If the main support is lost, we have a 2-fold drop
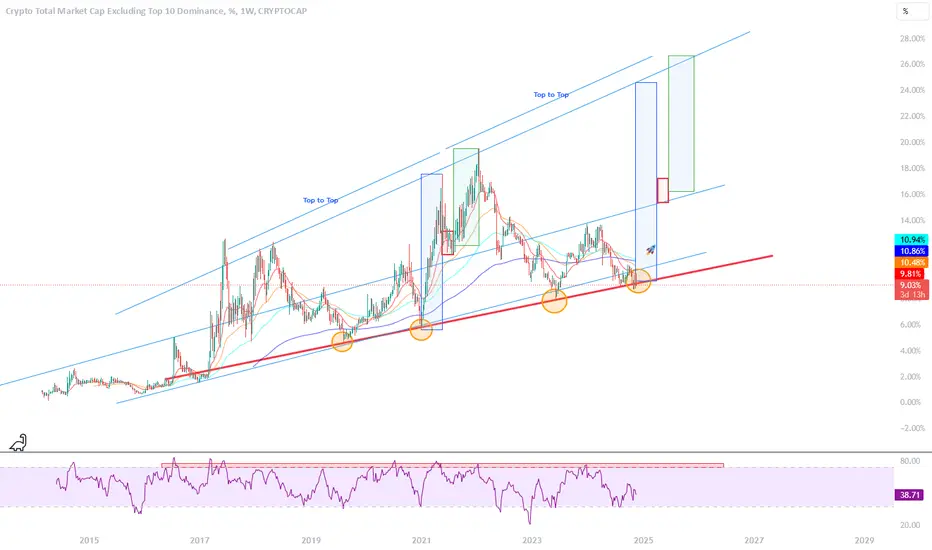
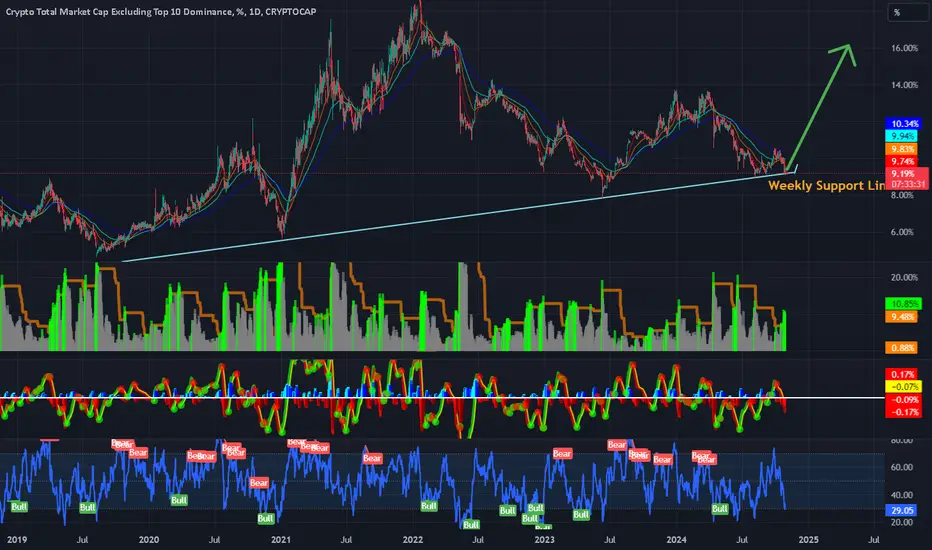
Altseason 2025 is about to start.The crypto total market cap excluding the top 10 dominance just entered the bottom zone of the 7 year Channel Up.
After a symmetric -60% correction during the 2022 bear cycle, similar to 2018, this is now the time for the last 1 year rally.
This will be the Altseason of 2025, stronger than the one in 2024.
We expect the price to reach as high as the 1.5 Fibonacci extension.
Follow us, like the idea and leave a comment below!!

#Alts run is inevitable! #Altcoins successfully retests monthly downtrend ahead of parabolic movements!
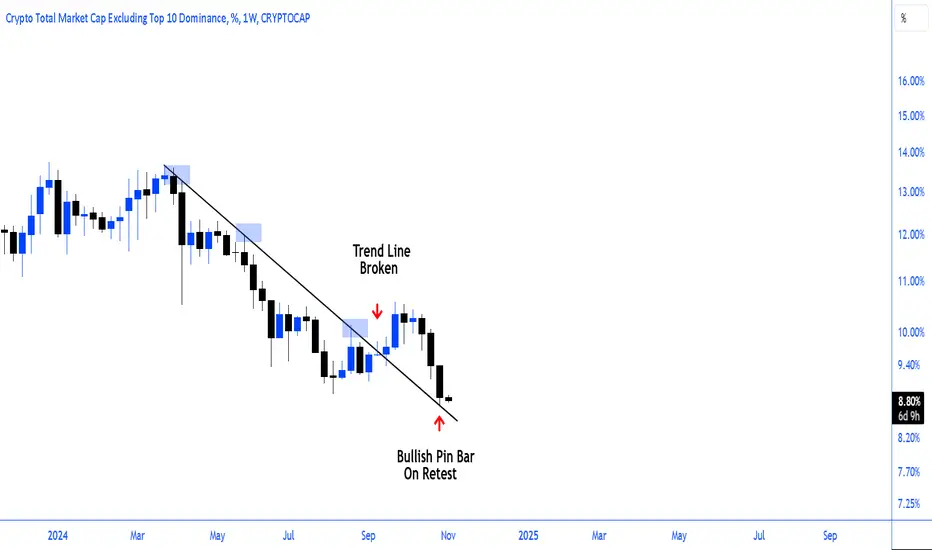
Altseason is not cancelledAltcoins are positioned to increase their dominance in case BTC initiates price discovery.

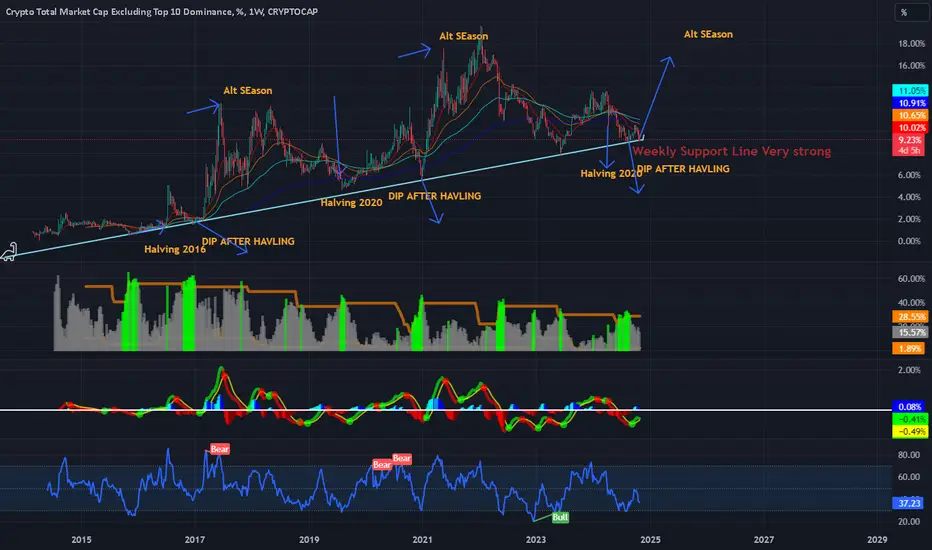
ALT SEASON ? Read thisAlt's Dominance last two halving Was in uptrend
After halving it went to visit weekly support
After Then it go to create New ATH
(Alt Season)
we now finished first two areas
Alt's Should fly from that point or maybe 2 weeks after
The Alt season occurs for 140-120 Day As previous cycles
So you will have good time to buy
i got some opinion for that cycle
it's not gonna be sharp because most investors Are ETF's + Gov + Big compaines
they will not leave BTC to go invest on some shit coin which can't afford their investments
Chart is very good and got alot of info But need to study it more and more
Be ready
bad news will end all of that .. or elections maybe or black swan
Meme coin dominanceHey all.
Just coded a meme coin dominance indicator. Please DM me if you see any issue with it.
Thoughts: If this is the meme coin super cycle (which I subscribe to), I'm thinking we go to near or over 10% MEME.D. My prediction is that once Tradingview creates the symbol for MEME.D, it will be the top :)
The chart has the MEME.D indicator, BTC.D, and OTHERS.D for comparison.
Enjoy.
Da_Prof

OTher's Dominance UpdateNow we are at the Weekly Support
it's Working nice since 2014 so no worries at all
Other's Dominance will move up soon
But that's does not mean alt's will go up becuase that require BTC to go up first
but means Alt's could be steedy while BTC down or increase a little bit
But now or Latter it will Go UP
NOTE : Breaking Weekly Support will lead Alts to Death !
Two altcoin cycles in 1 BTC cycle.Two altcoin cycles in 1 BTC cycle.
Read the chart in log scale
1. The bottom on btc precedes the bottom on altcoins.
2. The top of the first cycle can be determined by external measurement of 127 and 161 of the downward swing.
3. A LARGE CORRECTION ON ALCOINS ALWAYS ENDS AT 78.6 FIBO OF THE UPWARDS SWING in linear scale!!!
4. In the last 5 years, we have been held by a trend line on the log scale - it works great even on a 1-day chart.
5. Around the breakout of ATH on BTC, we have the 2nd cycle of altcoins, which ends at 161.8 fibo. Level 127 means a large correction on the entire crypto!!!
Will my chart work this time? Nobody knows.

It's still too early for #altcoinsAny pullback is a great buying opportunity for #alts
Imagine fading your altcoins before the mega bull!
Global Liquidity Cycle vs ALTS vs Business CycleA chart depicting the Global (Macro) Liquidity Cycle vs ALTS vs Business Cycle (Normalized).
This chart shows a trend and tight correlation between alt coins and the underlying liquidity cycle as well as business cycle.

Bear ScenarioPosted a bullish scenario for Others.D recently. Here's a super bearish one.
Head and shoulders formation, not yet confirmed, confirm by crossing the neckline and remaining below it on re-tests.
Targets = 3.1% and then 1.83% approx

Global Liqudity vs ALTSThis chart depicts Global Liquidity (M2) against a backdrop of Altcoin dominance (top 10) to show show liquidity flow impacts bull / bear trends of altcoins.
