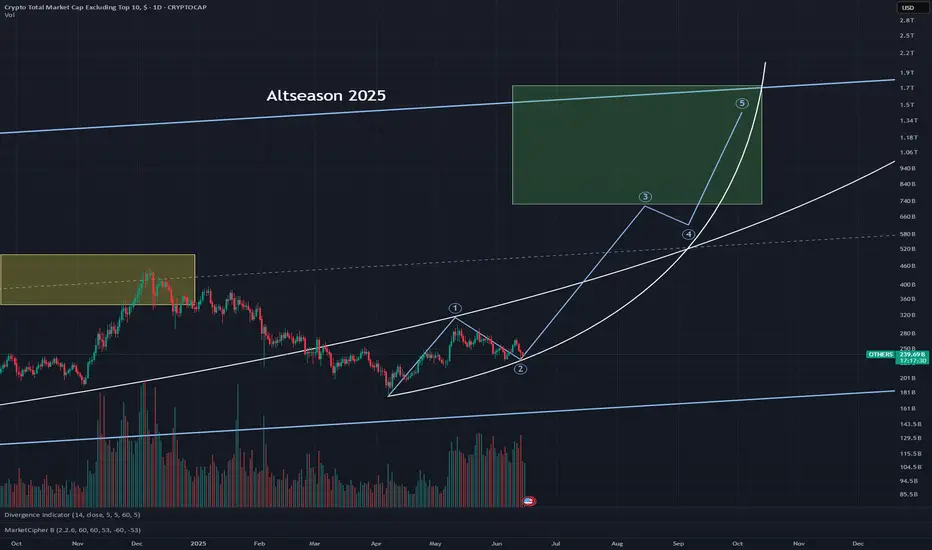
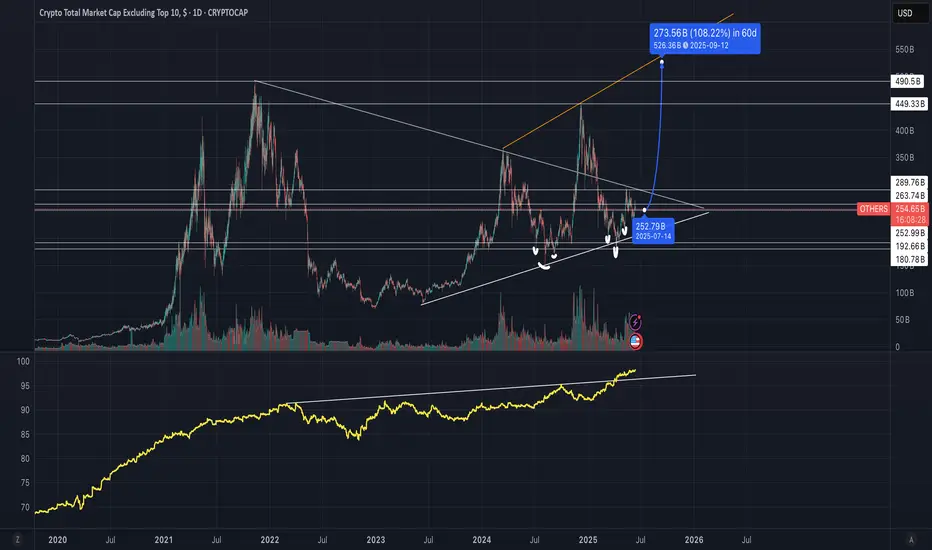
Altseason 2025 – Wave 3 in playIn this Elliott Wave setup, Wave 2 appears to be bottoming out now. As Bitcoin dominance shows signs of declining, capital rotation into altcoins could ignite the powerful Wave 3. Historically, Wave 3 is the most explosive phase, often driving sharp, sustained gains across the altcoin market.
OTHERS trade ideas
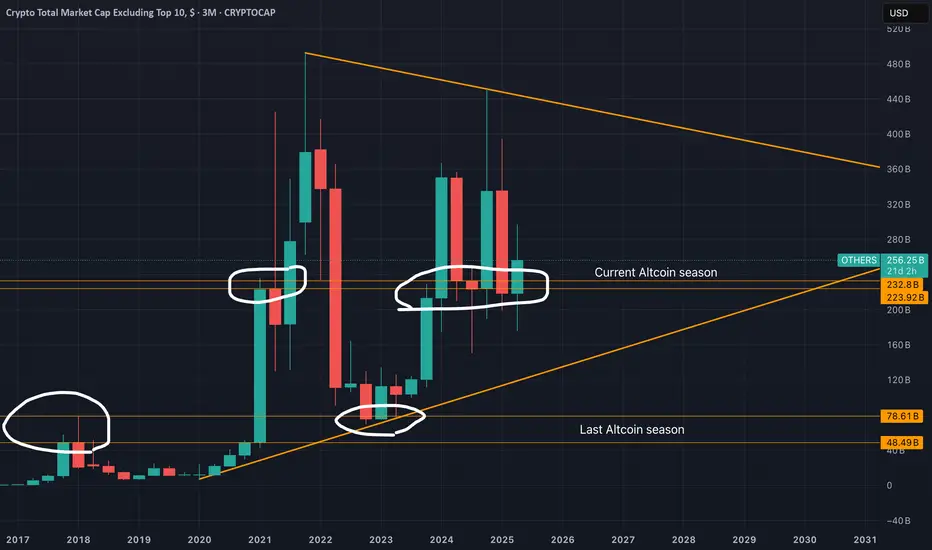
Altcoins: Warning. Check this chart!On the weekly timeframe, I’ve noticed a striking similarity between the 2021 cycle and the current one.
Take a close look at the chart—once you see it, you can’t unsee it.
Are we at the same point we were in March 2022?
The MACD is nearly identical
The RSI mirrors the same pattern
The Vortex Indicator stands at a critical crossroad
The only difference: trading volume is significantly higher
This setup resembles a potential triple top formation. If it confirms, it could completely contradict the bullish forecast I’ve held for months—or it might just be a fakeout.
We're at a decision point for altcoins: either the altseason kicks off in September and invalidates this bearish pattern, or we're headed toward a dot-com-style crash for most altcoins—excluding the top 10.
Keep a close watch on $OTHERS. History tends to repeat—let’s hope not this time.
DYOR
#Crypto #Altseason #BTC #CryptoAnalysis #MACD #RSI #BitcoinDominance #Altcoins #TradingView #TripleTop #CryptoCrash #Blockchain #CryptoCycle #MarketAnalysis

Is Alt season dead? - June 2025Let me start by saying, Youtube influencers are lying to you. The collective narrative (from those links shared with me) talk almost exclusively about the same set of narratives for triggering “alt season”:
M2 money supply. The printer will be turned on any minute.
The FED is going to cut rates, the market will then explode.
Institutions are buying the dip! “Blackrock fills Ethereum long positions” etc
A dollar collapse.
The real season begins in 2026, stack now!
It is the same rubbish time and time again. Rarely will one of those influencers << Look left << to tell you the News as it is written on the chart.
Let me tell you the News…
The highly anticipated "alt season," where alternative cryptocurrencies (alt coins) significantly outperform Bitcoin, faces considerable challenges to deliver the much awaited “alt season” where everything blows up. However I’ve long argued those days are behind us, we’re not going to see an “alt season” again, at least not in the sense many understand the term "alt season".
Alt season refers mainly to those tokens that reside outside the top ten crypto tokens. The total market cap of this cohort outside the top 10 is referred to as INDEX:OTHERS total, as is shown in the main chart. Now I’ve long argued corrections for Ethereum to $700 and below, Litecoin to $20 and lower, generally legacy tokens should perform the worst during this bull market, that outlook does not change.
Why so pessimistic?
Headline 1 - Support and resistance
It is that simple. look left. Each alt season closed a monthly candle above the monthly 7 SMA and monthly 10 SMA (Green areas) before getting underway. Not only has this not happened during this bull market, support from the rising channel has failed and if the current monthly candle closes as it (in 7 days), then past support shall confirm as resistance. This would mean a collapse back to the 2017 market top of circa $50 billion.
Headline 2 - Bitcoin halving
The truth is “alt season” began in May 2024, that is if you’re a believer in the halving cycles. If you’re a believer then you must accept this bull market comes to an end in 90 days.
The orange vertical lines represent each Bitcoin halving, occurring in August 2016, June 2020, and lately May 2024. The so called “alt season” would follow the halving for a 518 day period. There is only 90 days left for alt tokens to do their stuff before this cycle comes to an end. However, influencers only seem to talk about how great 2026 is going to be and how now is the time to start stacking. Instead 2025 is really going to create a whole new number of bag holders of dead projects.
Headline 3 - The number of circulating tokens
In January 2017 there was 8885 tokens, the good ole days.
June 2020, still only 19,500 tokens
Fast forward to June 2025 and we have 17.45 million tokens. Utterly ridiculous.
The sheer proliferation of alt coins, now numbering in the millions, creates an overwhelming supply that far outstrips demand. This fragmentation of liquidity means that even when some tokens see brief pumps, it's often selective with only a handful of projects having strong narratives or specific utility that truly thrive.
The simple truth is the market must kill off millions of those dud projects to free liquidity to the few that matter. If you really must know where the money is going to come from that causes growth in the remaining winners, it is from the realisation that a number of those projects are dead. That includes projects such as Ethereum and Litecoin. Both those charts share an important distinction no one wants to talk or hear about.
There are projects out there that’ll buck the trend, do you know which ones they are?
Not everything will collapse to zero.
Ww

Simpel illustration of altcoin potential (30x)Connected some dots and we don't have to make it harder, the altcoin markets is picking up use cases and wit mature faster then we think, next FOMO will not only pull in corporate but the amount of people in crypto increases daily. I don't think anybody is ready for the next explosion.

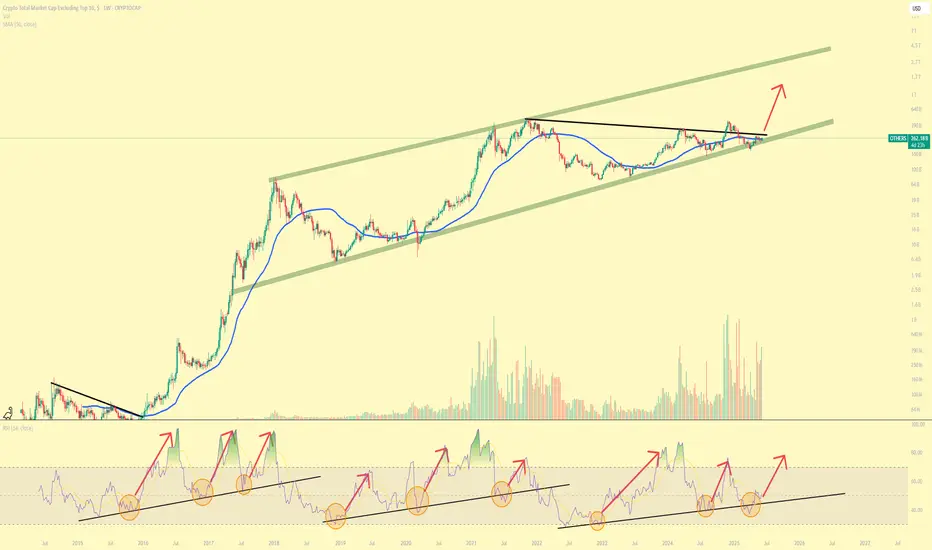
You can't unsee itThere is something to be said for the simplicity.
The historical price action is clear.
The RSI trend/cycles are just as clear.
There is not much space left for compression.
A BIG MOVE IS COMING.
The only question is, are you ready?
$other are about to flyOthers are about to fly. They’re literally gonna melt faces if this charter is correct.

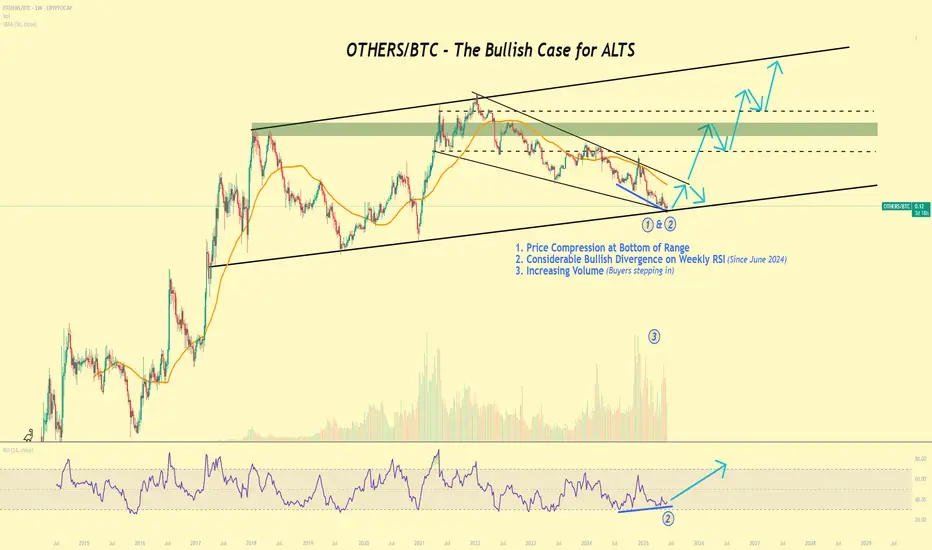
The Charts Never Lie [Well, almost never]So many reasons to be Bullish on Alts right now.
Historically, BTC will peak first, and then ALTS will have their turn. It looks like they are prime for a run at least to the middle of the range, although why stop there?
>10 Altcoins Movement With the reduction in interest rates, we will have the start of the trend of altcoins and the start of the bull market.
Wishing you success.

Altcoin Cycle - Cycle bottoms spottedAs I demonstrated on this picture. I believe I identified the cycle bottoms and marking a new cycle low. With the BITSTAMP:BTCUSD price rising now and CRYPTOCAP:BTC.D about to meet hard resistance levels, I believe this will increase the propability of a start of the altcoin cycle. Also known as the Altcoin season.
CRYPTOCAP:OTHERS
CRYPTOCAP:OTHERS.D
COINBASE:ETHUSD
BINANCE:SOLUSD
INDEX:BTCUSD
BINANCE:BTCUSD
others - altcoins It looks like the altcoin season is about to begin and we will witness an alt party or alt season.

OTHERS | USIt held at 241B and will try to break 247B. If a 1-day candle closes above 247B, we can say that we are back. Our direction will be level 255B.
For this, volume needs to come from the US side and Asian stock markets need to support us in the coming days.

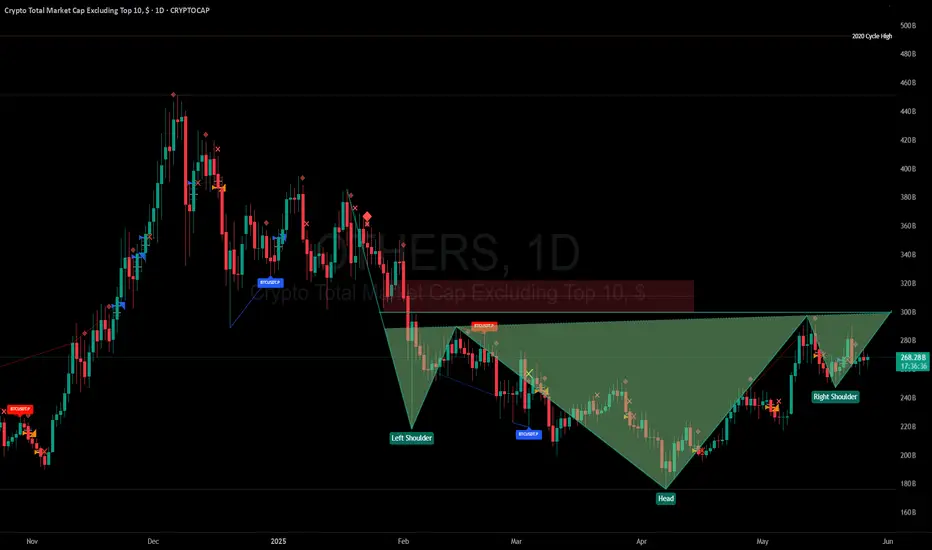
Altcoins (Market Cap) - Excluding Top 10 Coins - Inverted H&SBullish setup on the daily chart. CRYPTOCAP:OTHERS have once again made a inverted head & shoulders pattern which is a bullish reversal pattern. With the yellow chart below showing the Global M2 Liquidity index breaking out aswell. With more money in circulation, the propabilty is that more money will enter the market over time. Although, there can be latency.
For now I will trust the patterns in the chart of Others and follow it to see IF we can confirm the Inverse H&S. We have to break the neckline which should be around 310-325 B for June and July. But still, after that we need a pullback to confirm that neckline and make it support for continueation.
It´s a very interesting world right now. And much can happen. But IF this break out. It would probably be one of the most explosive bull markets to remember for a long time.. I myself are holding quality coins and tokens. Im not in memecoins, whats so ever. With the adoption happening right now in crypto I don´t believe that is the right market to be in right now.
Nothing on this profile should be interpreted as financial advice. Always do your own research and investment decisions. Im only expressing my thoughts and beliefs. Nothing else. Crypto is a risky business but It also has a lot of reward If being right. I can´t find equal yield in any other markets for now. If you know any, plz comment below =)
BINANCE:BTCUSD
CRYPTOCAP:OTHERS
CRYPTOCAP:TOTAL
MARKETSCOM:ETHEREUM
BINANCE:SOLUSD
BINANCE:SUIUSD
ICEUS:DXY
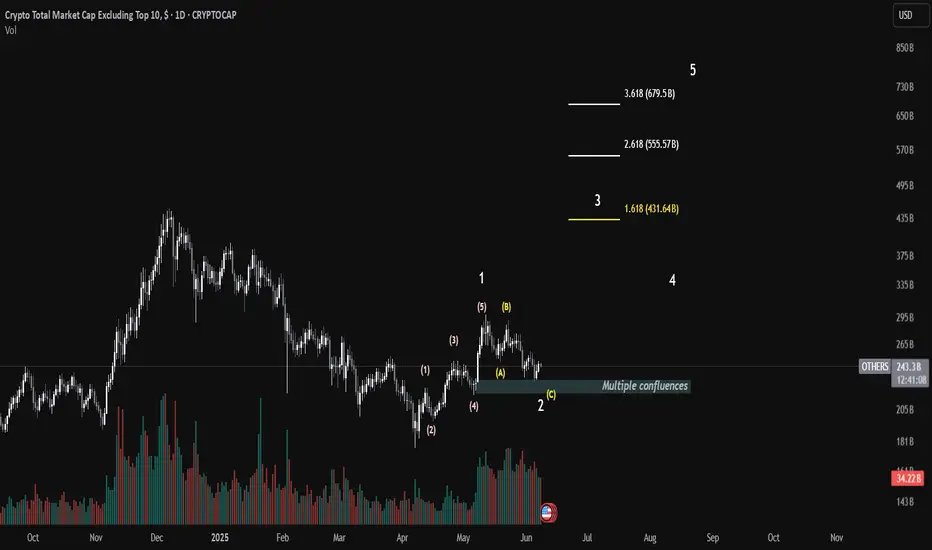
altcoins update The others chart have been very bullish since April The wave from the lows have formed perfect wave 1 completing 5 waves to the upside now the wave 2 which is typically 3 wave corrective is reaching it's end We can expect for the wave 3 in the coming days so alts will perform better
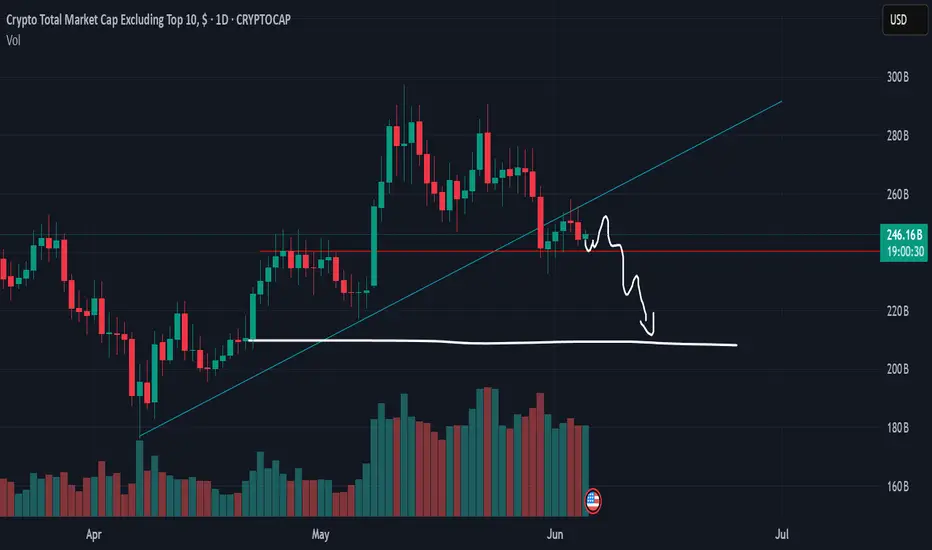
OTHERS Failed to break trendlineOTHERS failed to break trendline, seems like retesting before another dump ?
$TOTAL3 & $OTHERS - Bounce incoming within the next days/weekWe’ve now reached the full correction level on OTHERS and are getting ready for a U-turn.
Some downside is still possible, since TOTAL3 hasn’t yet tapped its trend reversal zone or target region — but that should play out in the coming days.
Scaling into my long swing position on many altcoins — ready to ride the next wave up!

Draw on liquidity on altsSimple analysis really, we measure previous range and identify areas below premium that will attract price

Alt season ahead?Everyone shares their ideas, and here’s mine.
I’m not a very talkative person, but to summarize, I believe we have a potential alt season ahead. A strong cup and handle pattern is forming, and the candle has broken out of the handle, currently in its pullback phase. I think this might be the last good entry opportunity unless the trendline gets broken.
P.S. Just my personal observation, not financial advice.

OTHERS: Inverse H&S Forming?Posted here are my thoughts on the prospects of an ALT Season for cryptocurrency markets, which, like all risk on equities have been hammered by rejection by 'smart money' of President Trump's economic agenda since the latter's inauguration.
Unexpected by most acolytes of the Four Year Halving Cycle, OTHERS (an index of ALT coins outside of the 'Top Ten') retraced massively in Q1 of 2025, erasing more than 60% of the gains made by these markets since the Yen Carry Trade debacle on 8/5/24 and causing liquidations of record-breaking proportions. Granted, not all of these owed to Trumpian provenance (the Bybit 'Hack' of 2025--reminiscent of the Terra Luna and FTX implosions of 2022--had something to do with the dip), but The Donald's brinksmanship, nay flirtation with insider trading, has framed the story of this Post-Halving Year thus far...
tradingview.sweetlogin.com
Yet, in all of this--Trumpian Turmoil, hacks, and malfeasance--something remarkable may have been taking shape. With a curious rebound of the SPX and Trump's seemingly prudent respect of the Bond Market's 'freak' at his tactics, volume has returned to the crypto space and--all of a sudden--we are seeing charts like this...
tradingview.sweetlogin.com
April may have been rather a cruel month, but here's a potential Inverse H&S brewing in May--a point at which I, with a lot of investors, have been anticipating the taking of profits.
Supporting the case for IH&S is, for one, Money Flow . (I use Lux Algo's indicator here, pick whichever suits your taste.)
tradingview.sweetlogin.com
But so is OBV, On Balance Volume, one of my favorite means of Trend Confirmation...
tradingview.sweetlogin.com
Where I am TOTALLY with those who would tell investors in crypto to beware of the Macro--read: to not repeat the mistake of those who counted on a 'Moonvember' in a month, November of 2021, in which the Fed's transition to QT was bound to wreck that cycle's 'blow off top--I am obliged to suggest that OTHERS might not be dead yet.
All of this is, of course, not financial advice, and the author cautions that Donald's penis--or lack thereof--may tend to skew results!
OTHERSKeep in watchlist
After success created impulse wave, now double top confirmed, but we still not break support
if we break support, soft rug in altcoin incoming again

OTHERS 200MA – Next Attempt: If and When?
On the Others daily chart, there’s a formed inverse head and shoulders. The base of the formation acted as support during the last drop after rejection from the 200MA.
Now, price is attempting to push through the BB center, with SMA and MLR helping from underneath. Additionally, there’s a clear ascending trendline that continues to act as dynamic support.
Only price action will confirm the next move toward the 200MA.
Posts come from time to time—interactions help with visibility.
Manage risk—it’s the only constant

24th May 2025Bitcoin just made its ATH in the last week, 112.000 creating a change of character, also the candle in th Daily timeframe closed positive (above previous ATH 109k) Waiting for the close on the weekly.
OTHERS is at 268.47B market cap, my expectation is OTHERS to increase more to catch up with BTC rally.
Bearish Case:
-War between Ukraine and Russia intensifies. (Increasing)
-Mayor war conflict.
-Japan bond market.
-Stock market crash.
-QT (High Interest rates).
Bullish Case:
-Lowering Interest rates.
-Increasing M2 global money supply.
-Bond market ???
- No recession fears.

Altcoin 4-Year Cycle You are standing where legends entered in 2017 and 2021.
History says altseason is loading.
We bottom. We breakout. Altcoins melt faces.
Are you positioned… or sidelined again?
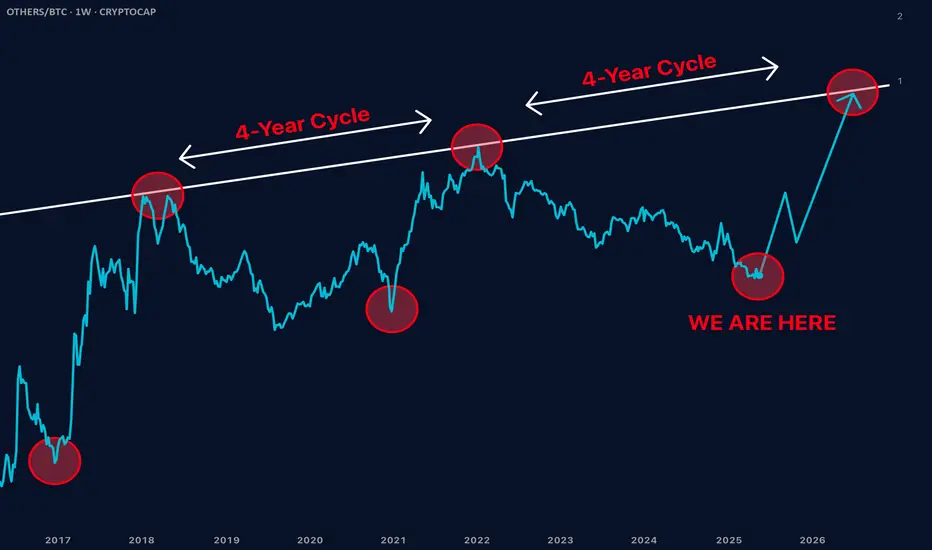
Altcoin Season Brewing?Hi,
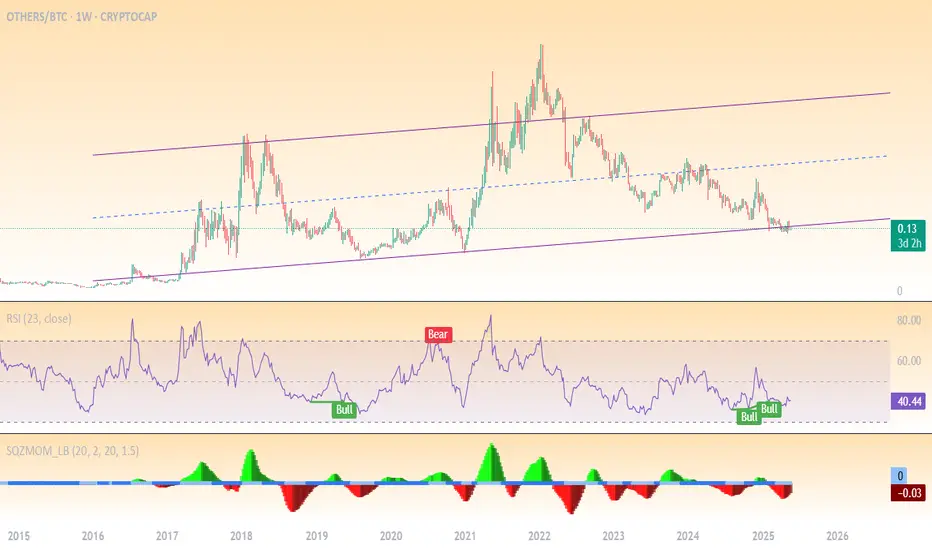
The OTHERS/BTC pair represents the collective market capitalization of altcoins relative to Bitcoin. This ratio is a critical indicator of altcoin strength or weakness against Bitcoin. The weekly chart reveals a prolonged bearish phase for altcoins, with Bitcoin dominance persisting. However, recent data suggests potential inflection points worth monitoring.
Key Technical Elements:
- Ascending Channel: The pair is moving within a well-defined macro upward channel. It is currently sitting at the bottom boundary, suggesting a potential reversal point.
- Support Zone: The lower boundary of the channel (purple line) aligns with previous bounce points (2019, 2020, mid-2023), reinforcing its validity.
- RSI Indicator: The RSI has shown bullish divergence with price making lower lows while RSI forms higher lows.
My Opinion:
This chart suggests we are near the bottom for altcoins vs BTC, and the risk/reward is heavily tilted in favor of a bounce, especially going into a potential Q3-Q4 altseason. It’s a classic accumulation zone where smart money tends to position.
And what to do?
- scale into altcoin positions cautiously.
- Use the channel low as a stop-loss zone.
- Look for confirmation over the next 1–2 weeks with bullish candles or increased volume.
Happy Trading,