ALTS - Altcoins you MUST WATCH for ALTSEASON1) ONDO | BYBIT:ONDOUSDT
After some consistent higher lows, ONDO is likely on its way back towards it's previous ATH:
2) ATOM | BINANCE:ATOMUSDT
Cosmos is one of my favorites, and I'm patiently waiting for the parabolic run on this one:
3) SONIC | BYBIT:SONICUSDT
SONIC / previously FTM is trading nearly 290% away from its previous ATH, with great upside potential.
4) AAVE | BINANCE:AAVEUSDT
AAVE still has a bit to gain before reaching its previous ATH, and the parabolic run has actually already started:
5) ENA | BINANCE:ENAUSDT
IF ENA can hold it's current support, there's a huge upside awaiting this alt:
😊🧡 Please like and follow !!
OTHERS trade ideas
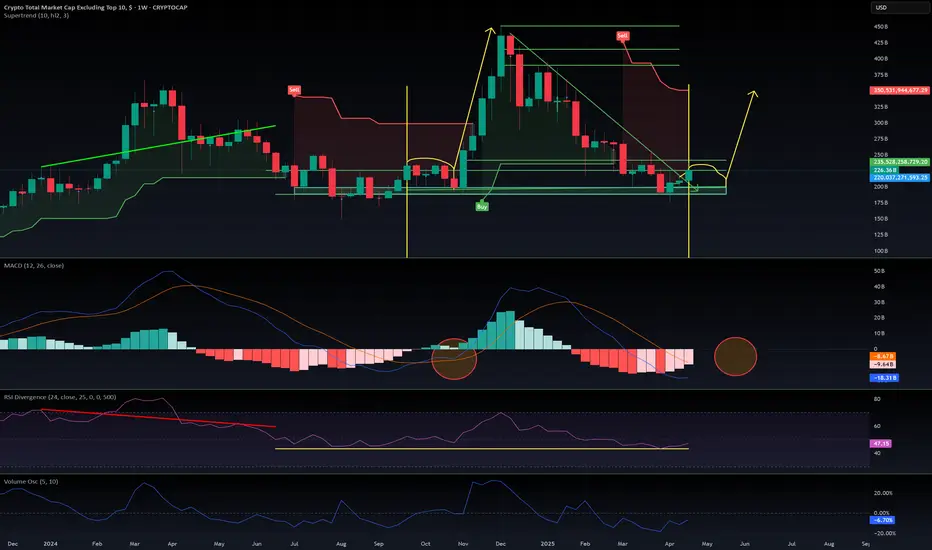
175B.Hello.
This is an indicator I don't use too often.
It catches whale buying and selling.
Whalemap.
But in this case, I found something interesting.
Big altcoin buy level at about ~175B with a retest.
And a bounce.
The boldness of the green line and the magnitude of the dot
radius show that this is a very large volume.
I think that's a pretty strong argument that the alts have passed
the bottom of the market.
They may not necessarily rise rapidly right away.
But they've already pushed off and consolidated.
The market bottom has been there.
However, there are a lot of other faithers like bitcoin dominance,
USDT dominance. And the Fed's base rate.
Follow the volume.

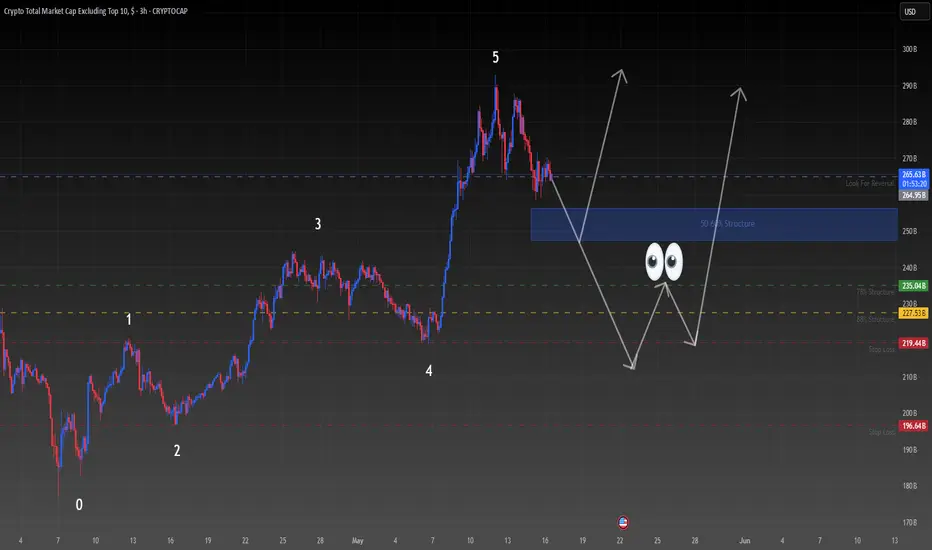
Others: Never forgetting the alternativeWhen we are looking at something like the Others chart we have to take into consideration what happened to markets last year end of Q4. The volatility of the ALT coin market is completely contingent upon what happens with much of the large cap cryptos and market sentiment and right now things are looking like they could get bearish before they get bullish. These markets are designed to keep the average retail trader sidelined and at bay giving them little to no significant entries by playing on the emotions of the traders.
Right now things are playing out exactly ho they should. After these big pushes in the market either to the up or downside (particularly in Elliot wave patterns) is followed by a major correction either to mitigate from a order zone, fill imbalance or to liquidate traders to building momentum to swing things back the other way (no pun intended).
In this instance I believe it's all of the above. There are instances where markets have slightly smaller or larger mitigation points but in this example of price action I believe we are not only priming for a big move to the upside but the dumb money (retail) should use caution and know they could be targeted going into the coming weeks. Others could drop another 10-20% and depending on what ALT it is you are trading and the parameters behind the circulating supply and it's market cap could influence things significantly.
**USE PROPER RISK MANAGEMENT**
Next goalFrom a general view of the chart, we find, according to the analysis, that this rise is not a motive, but rather a correction, and this indicates that there is another strong decline coming soon unless it breaks the analysis failure area specified above.
*In principle, I am not a supporter of any direction, but I am only giving my point of view, which may be right or wrong. If the analysis helps you, then this is for you. If you do not like this analysis, there is no problem. Just ignore it. My goal is to spread the benefit. I am not one of the founders of the currency.

The Next Wave Is The Altseason!Hello, Skyrexians!
Yesterday I found the CRYPTOCAP:OTHERS chart which gave me the hope that my idea with the incoming altseason is valid.
Let's take a look at the weekly chart. Awesome Oscillator shows that the wave 1 has been finished in December 2024. Now this chart is in wave 2. The target area 0.61 Fibonacci has been reached, but here I have 2 possible scenarios. The first one price will grow a little bit and retest recent low and the second one is that wave 2 is finished already and we are in global wave 3. Both these scenarios are about some kind of wave 2 and the growth in wave 3 to 800B is imminent anyway.
Best regards,
Ivan Skyrexio
___________________________________________________________
Please, boost this article and subscribe our page if you like analysis!

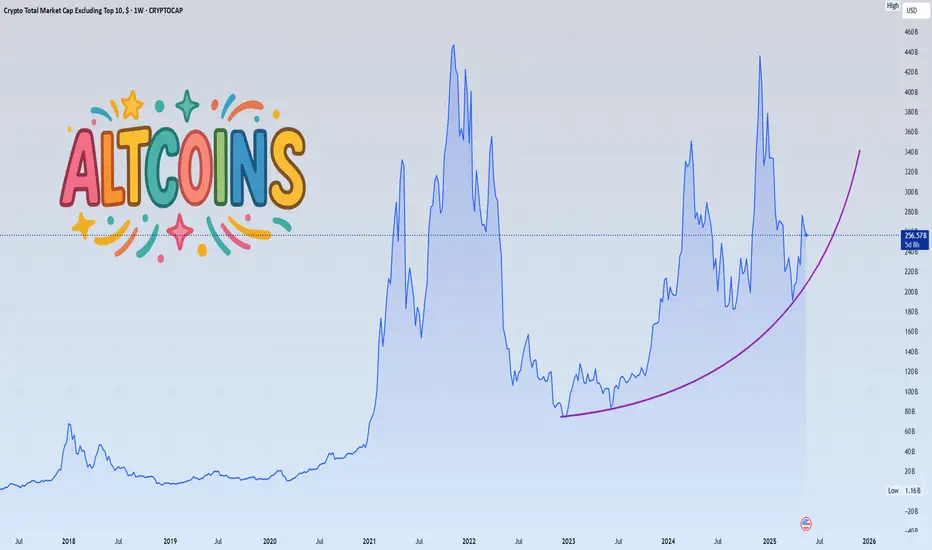
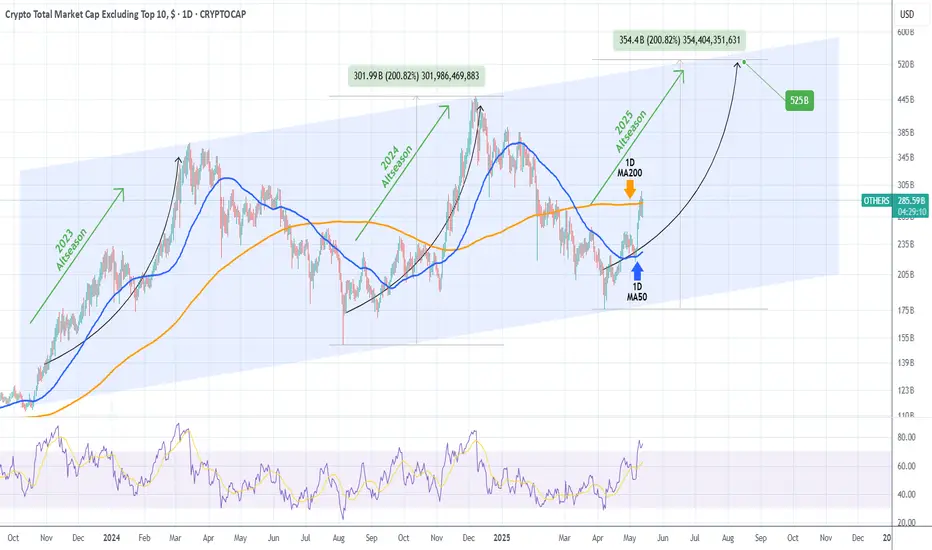
ALTSEASON is here!The Crypto Total Market Cap (excluding the Top 10 coins) broke above the 1D MA200 (orange trend-line) and is consolidating on an overbought 1D RSI (>70.00).
Since October 2023 when this set of conditions emerge, the long-term Channel Up starts a rally (technically its Bullish Leg). This is what in the crypto world is known as 'Altseason',which is when the lower cap coins see enormous gains relative to the top 10.
The last Bullish Leg (2024) rose by +200%. The previous one, even more. If it 'just' repeats the +200% Leg, we are looking at a market cap of $525 Billion.
The time to invest in alts is now!
-------------------------------------------------------------------------------
** Please LIKE 👍, FOLLOW ✅, SHARE 🙌 and COMMENT ✍ if you enjoy this idea! Also share your ideas and charts in the comments section below! This is best way to keep it relevant, support us, keep the content here free and allow the idea to reach as many people as possible. **
-------------------------------------------------------------------------------
💸💸💸💸💸💸
👇 👇 👇 👇 👇 👇
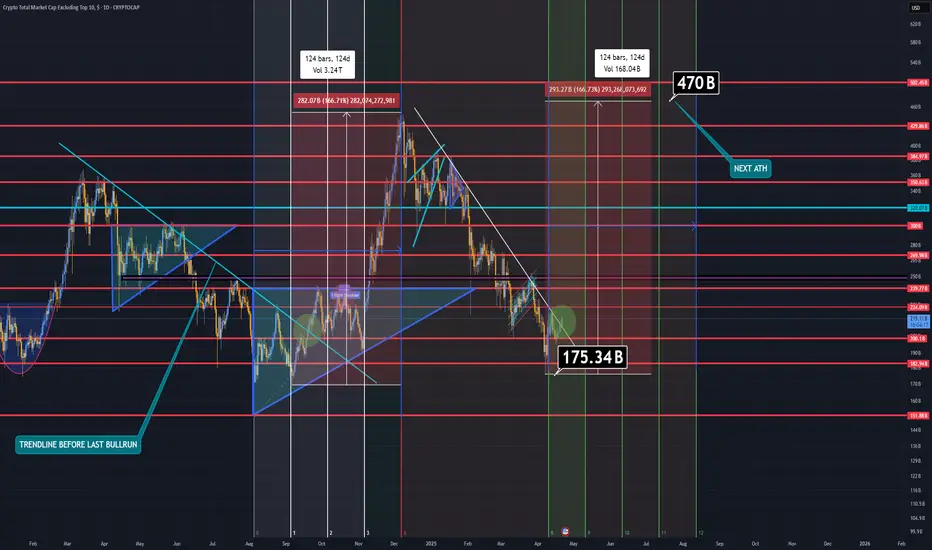
Altcoin Market (OTHERS) Cycle Analysis: To the Moon !Let’s take a closer look at the previous bull cycle of the Others (Altcoin Market Cap excluding BTC & ETH) chart.
Before the major upward move, the market declined for months, eventually finding strong support around the $170B level.
After forming a higher low and a clear change of character (CHOCH), the market entered a sustained bullish phase. For 124 consecutive days, we witnessed a strong altcoin rally.
As of now, price action appears to be mirroring that same structure — but with a potential to push even higher than the previous ATH.
In this scenario, the target stands around the $470B level. As long as OTHERS holds above the $170B support, the altcoin market remains in recovery mode, and further upside is very much on the table.
— Thanks for reading.
Crucial CandlesRSI and Stochastic RSI are gearing up for possible bullish activity. The alt coin market cap may break out of the Supply/Value zone and the 21 EMA(in yellow). Please be careful the next few days, next week may determine if we are safely out of the Supply/Value zone.

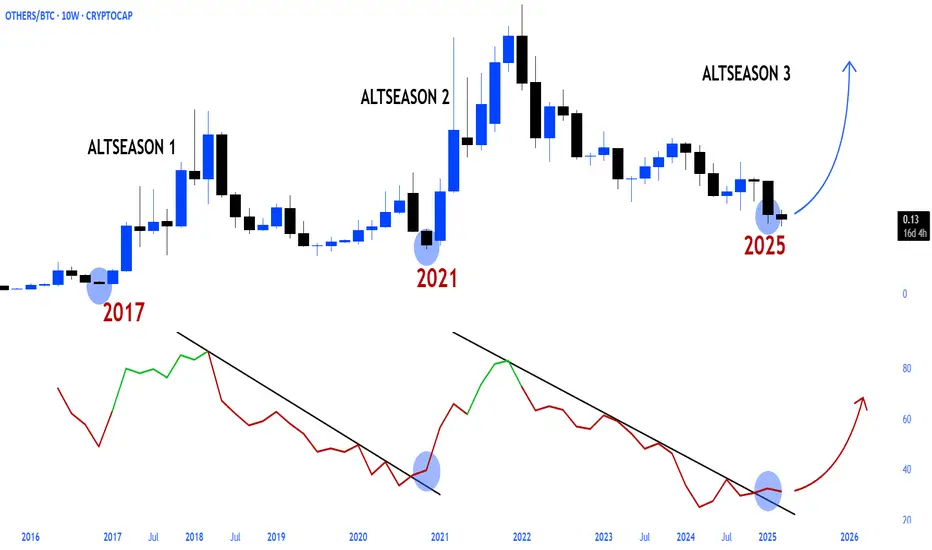
OTHERS - BTCOTHERS / BTC 🌊
2017 ALTSEASON 1
2021 ALTSEASON 2
2025 ALTSEASON 3
altcoins run will be there sooner or later
Best crypto performers from May 9, 2024 until todayIn the chart presented, I showcase the best-performing cryptocurrencies since May 9, 2024. The data highlights one crucial point: it is virtually impossible to predict which coin will outperform others over time.
Despite various analyses and predictions, the crypto market remains inherently chaotic . Factors ranging from market sentiment to sudden regulatory changes continuously shape the landscape, making it unpredictable. As a result, investors often find themselves unable to draw a structured plan or consistently forecast the next top performer.
This volatility underscores the complexity of crypto investments, where even the most informed strategies can fall short. The chart serves as a visual reminder that, in this rapidly evolving environment, embracing uncertainty is a key aspect of navigating the crypto world.
MEXC:VIRTUALUSDT KUCOIN:XMRUSDT BINANCE:TURBOUSDT BITGET:BGBUSDT BINANCE:XLMUSDT BINANCE:AAVEUSDT

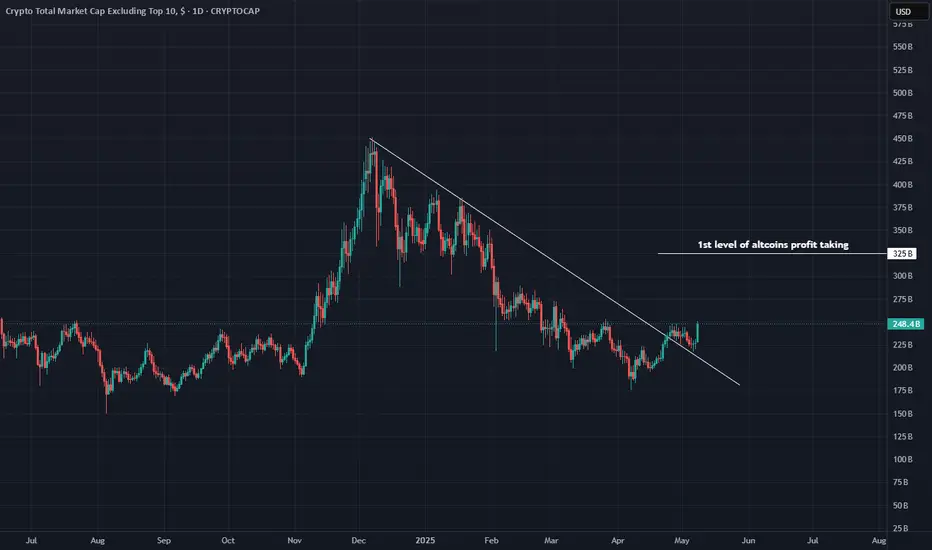
When to Take Profit on Altcoins ?Right now, all eyes should be on the CRYPTOCAP:OTHERS chart, which is aiming for $325 billion.
The best answer? Take profits steadily throughout this upward trend .
By taking profits gradually as the alts market cap moves closer to that $325 billion mark, you can still ride the wave up while protecting yourself from a sudden downturn. It’s about finding a balance—locking in gains without fully stepping out of the potential rally.
Don’t get caught up trying to predict the exact peak. Instead, take some profits along the way. It’s a practical, less stressful strategy that helps you stay in the game without risking it all if things take a turn.
BINANCE:SUIUSDT BINANCE:ETHUSDT BINANCE:SOLUSDT BINANCE:XRPUSDT
SHITCOIN index to 11X - No crying in the CASINO!I see grown men on my timeline expressing despair, claiming that altcoins are finished!
Come on, get a grip!
Volatility is simply the cost of chasing the highest potential returns in the most speculative market the world has ever seen.
Yet, many are unwilling to wait just one more year.
They’re turning into Bitcoin maximalists, hesitant to promote their favourite coins and reluctant to introduce friends and family to their preferred ecosystems.
This is just ridiculous.
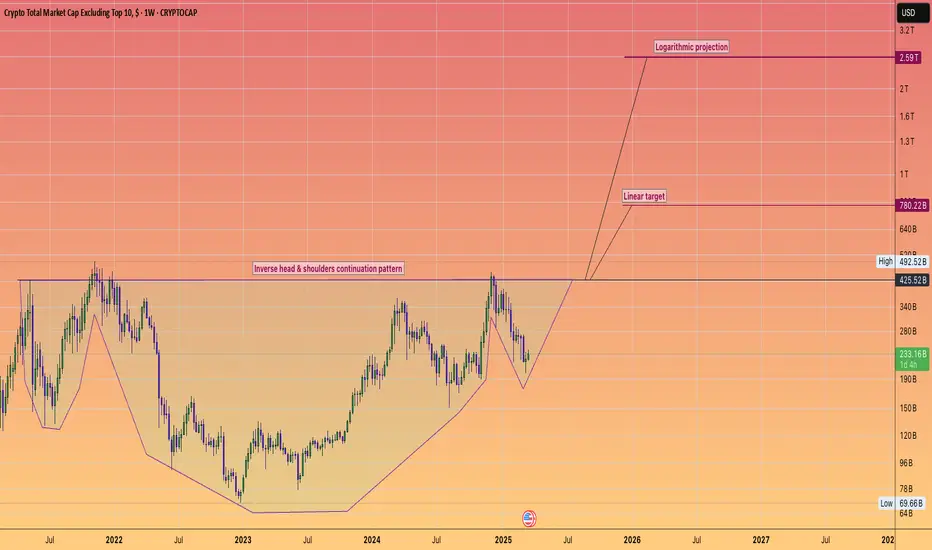
Take a look at that chart.
I mean really study it.
It shows a stunning continuation pattern of an inverse head and shoulder.
Is that bearish or bullish?
You decide.
Embrace the cost of those future returns.
The Others index going to Trillions of dollars.
Means many millionaires will be freshly minted.
From memes to mansions.
$OTHERS appears to have found its bottom — a breakout could be n🚀 CRYPTOCAP:OTHERS (altcoins excluding the top 10) may have bottomed out — and could be ready for takeoff!
I’ve been closely tracking CRYPTOCAP:OTHERS , and the chart clearly shows a consistent downtrend since the mini altseason back in December 2024.
Now, it looks like the downtrend has fully played out, with a potential bottom forming around April 7th (see the yellow arrow on the chart).
This setup mirrors what we saw before CRYPTOCAP:OTHERS when we got a pump in dec 2024. With price action now bouncing from a key support zone, it’s possible we’re on the edge of another mini altseason.
The green lines are showing the area of support and resistance. A large support is at the current level likely to offer a bounce in the short term.
📈 Key Signs:
Fully retraced move since the last rally
Support holding firmly
Resistance retest incoming
This could be the early signal many are waiting for.
🧠 DYOR — as always, nothing is guaranteed, but the signs are promising.

Altseason coming very soon...Alt seasone is coming very quickly. Never know when it hits.... Just wait and do Nothing :)
The Worst Is Over – Bullish May and June AheadAfter months of uncertainty, volatility, and fear-driven sell-offs, the altcoin market is finally showing signs that the bottom may be in.
The Market Cipher indicator are flashing early bullish signals, with trigger waves beginning to play out. While we still have key resistance levels to clear, particularly the 200-day and 200-week SMAs. All signs point to a market that’s gearing up for a strong move to the upside.
Now, if Trump could just chill with the tariff war talk, we might even get some macro tailwinds to support the rally.

others alts#Altcoins Index OTHERS is exposed to healthy corrections but ready for the next bullish leg from MA25 support!

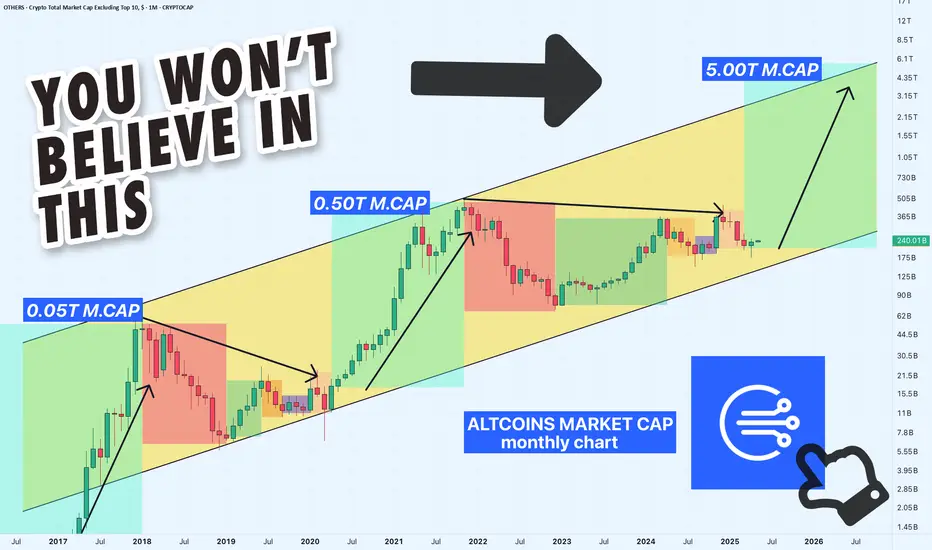
Altcoins Market Cap: We on the Verge of a 5T Exposion!Hey crypto traders! Let’s dive into this monthly chart of the Altcoins Market Cap. You won’t believe what’s brewing!
We’re currently approaching a critical channel support at 200B, a level that might act as a springboard for massive rally — check out the jumps from channel support in 2019 and 2023! Each time the market cap hit this support, it skyrocketed, and now we’re at that pivotal moment again.
The chart projects a jaw-dropping target of $5T within the next 24 months if history repeats itself!
The price action shows we’re testing the lower boundary of this ascending channel, with the market cap sitting around 239.65B. A bounce here could send altcoins on a parabolic run, potentially hitting 5T by mid-2026. But if support fails, we might see a dip toward 100B — let’s keep an eye out!
Key Levels to Watch:
Support: 175B (channel support)
Resistance: 1.55T, 5T (projected target)
Breakdown Risk: 100B
Are altcoins about to explode to 5T, or will we see a deeper correction? Drop your thoughts below!
PS take a look at others vs. btc price action here:
Alt season won't be too far!Based on common indicators, "Others" chart shows an obvious trend and pattern which, overall, confirms the high possibility of a new Alt season.

Others long term.The most likely scenario in my opinion.
* The purpose of my graphic drawings is purely educational.
* What i write here is not an investment advice. Please do your own research before investing in any asset.
* Never take my personal opinions as investment advice, you may lose your money.

A new correction is possible.I think the up and down waves are pretty clear.
* The purpose of my graphic drawings is purely educational.
* What i write here is not an investment advice. Please do your own research before investing in any asset.
* Never take my personal opinions as investment advice, you may lose your money.

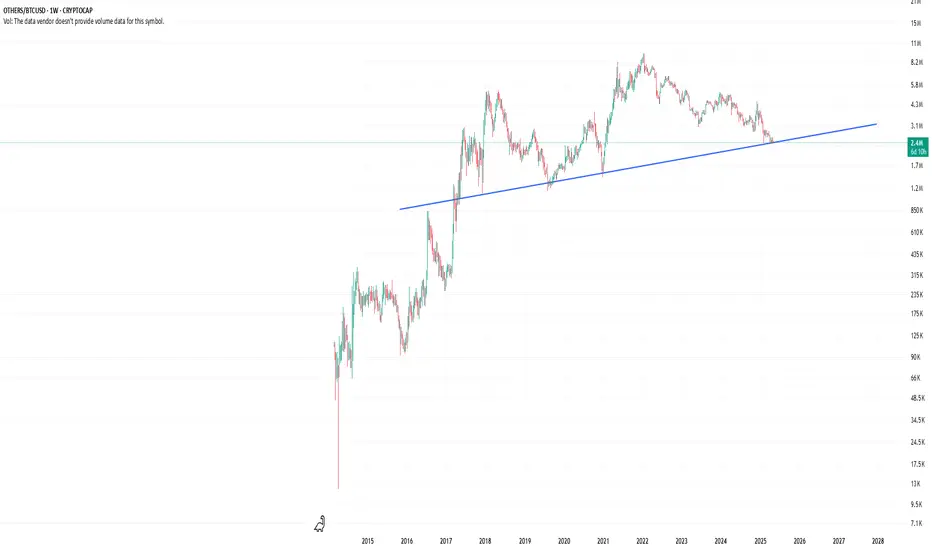
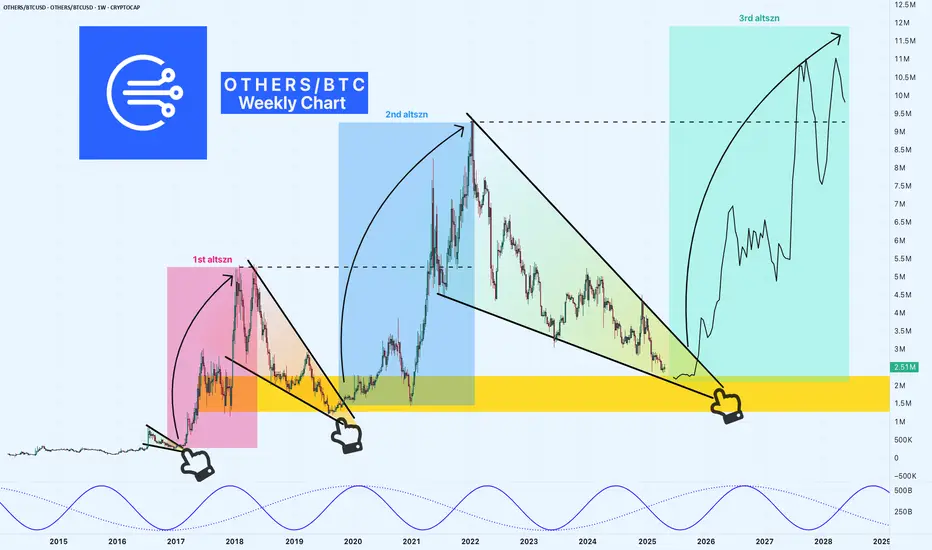
OTHERS/BTCUSD: The Ultimate Indicator for Altcoin SeasonsHey TradingView community! I’ve been analyzing the OTHERS/BTCUSD metric, and it’s painting an exciting picture for altcoin traders. This chart might just be the key to timing the next big altcoin rally — let’s break it down!
What is OTHERS/BTCUSD?
This metric calculates the total altcoin market cap (excluding Bitcoin) divided by BTC/USD. It shows how altcoins perform relative to Bitcoin.
High Metric : Altcoins are outperforming Bitcoin — think altcoin season!
Low Metric : Bitcoin dominance takes over, and altcoins take a backseat.
Historical Patterns: Falling Wedges Stealing the Show
The OTHERS/BTC Weekly chart reveals three Falling Wedge patterns, a bullish setup that’s historically preceded massive altcoin bull runs:
1st Altseason (2017-2018) : A Falling Wedge formed in 2016 (prior pink zone). The breakout unleashed a legendary altcoin rally — remember Ethereum and Ripple going parabolic?!
2nd Altseason (2020-2022) : Another wedge in 2018-2019 (blue zone) led to the 2021 altcoin boom, with projects like Solana and DeFi tokens soaring as the metric hit 10M.
3rd Falling Wedge (2022-Now) : Since 2022, a new wedge is forming (green zone), resurfacing the setups that sparked the last two altseasons.
Current Setup: A Critical Support Zone
As of April 27, 2025, the metric is approaching a key support zone of 2M-1.5M (where the altcoin market cap equals 1.5M to 2M Bitcoins).
Historical Significance : This level has been a launchpad in the past — both in 2016 and 2019, it marked the bottom before altcoins reversed and surged.
What’s Next : If this wedge breaks out, the metric could climb to 7M, 9M, or even 11.5M by 2025-2027. That could mean 5-10x gains from bottom for altcoins, depending on the pair!
A sinusoidal wave at the bottom of the chart — it reflect market sentiment cycles, with troughs (like now) often preceding altcoin season greed phases.
Why This Metric Matters
OTHERS/BTCUSD captures the flow of capital in crypto:
Bitcoin often leads bull cycles, pulling in capital first (metric drops).
When BTC’s rally cools, investors chase higher returns in altcoins (metric rises).
The Falling Wedges highlight this cycle — consolidation during Bitcoin dominance, followed by breakouts when altcoins take the spotlight.
Trading Takeaway
Monitor the 2M-1.5M Zone : A breakout here could be your green light to stack altcoins.
Cross-Check Bitcoin Dominance : A drop in BTC.D (Bitcoin Dominance) would confirm capital flowing into altcoins.
Pick Strong Projects : Look for altcoins with solid fundamentals — layer-1s, DeFi, or AI tokens could lead the charge.
What’s your take, TradingView fam? Are you gearing up for the next altseason?
Drop your favorite altcoin picks or charts in the comments — I’d love to hear your thoughts!
Altseason? Not yet — but the real move is coming... soon.As shown in the chart, the weekly MACD reset isn’t complete yet. A similar setup happened in September 2024 — we got a fake pump that fooled many, while the real breakout started in December 2024.
🔍 Why does this happen?
Impatient whales — often close to the “crypto president” — start buying early. Using influencers and media hype, they push the "New ATH" narrative and lure in retail. But this early FOMO creates a massive bearish divergence — the RSI hasn’t reset yet, and the market isn't ready.
📉 The result?
A painful 6-month correction that punishes impatience. The market always reverts to math — and math doesn’t lie.
You can’t fake momentum forever — no matter how much money you throw at it.
💡 My forecast remains unchanged:
Once the MACD weekly crossover happens, the real pump begins — no ETF, no Saylor needed. The market moves on its own, as it always has.
📊 Check the chart. Read the signals. Trust the data.
#Bitcoin #BTC #CryptoTrading #CryptoWhales #MACD #TechnicalAnalysis #BearishDivergence #Altseason #DYOR
$OTHERSAccumulation is looking good. I am looking for a capitulation event before the massive run. I don't think the fear is over, we had too much greed way too fast on every bounce since the tariff news dropped. People are desperate for the bullrun. Last shakeout.
Buy your favorite Alt when CRYPTOCAP:OTHERS total MC is 150B and under.
