PENGU/USDT: The Penguin's Journey to Recovery!📊 CURRENT SITUATION 🔔
🎯 THE BIG PICTURE: "Penguin Waddle Pattern"
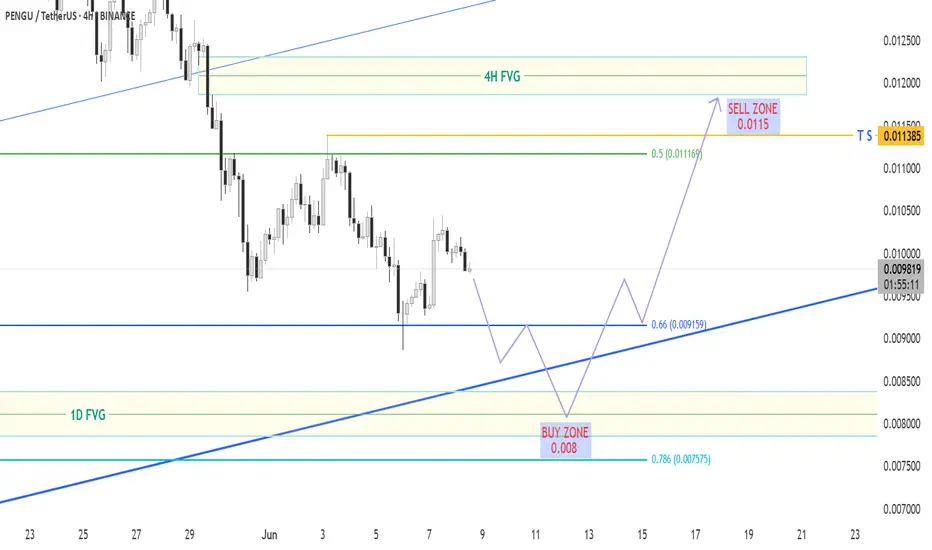
PENGU is currently executing what I call the "Antarctic Slide Recovery" - a classic bounce pattern after a significant correction from the 4H Fair Value Gap (FVG).
🟢 BUY ZONE (Support Cluster)
* Primary Support: 0.008
* Fibonacci
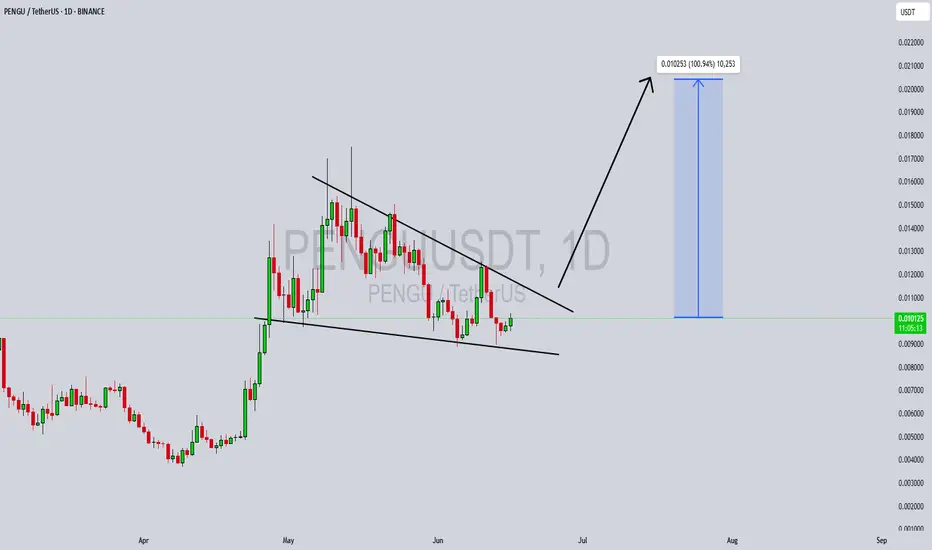
PENGUUSDT Forming Falling WedgePENGUUSDT is currently showing a textbook falling wedge pattern on the daily chart, which is a bullish technical setup often signaling a trend reversal. The price has been compressing within downward-sloping resistance and support lines, and with the wedge tightening, a breakout is becoming more lik
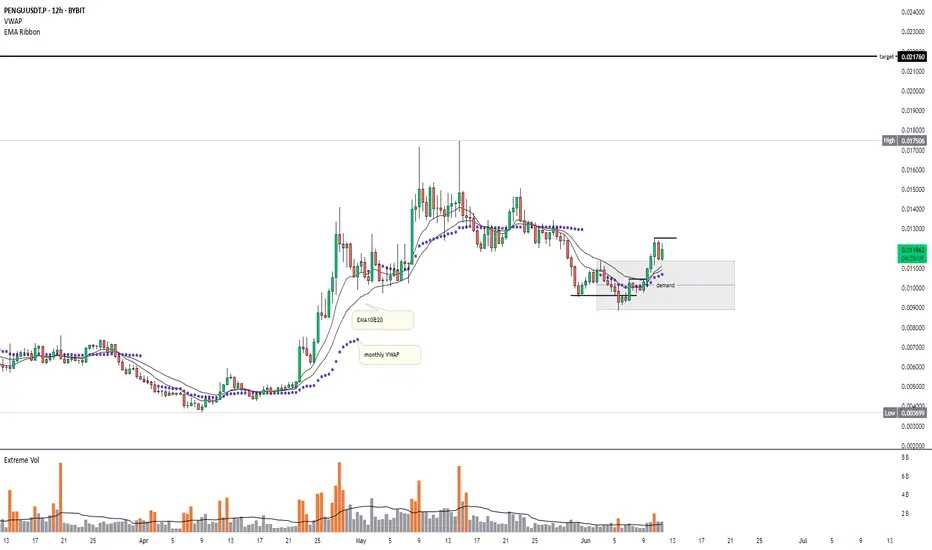
Pengu to Propel Upside to $0.02BYBIT:PENGUUSDT.P
A demand block has formed around $0.01.
Price is now attempting to push above this level.
There may be some pullbacks into the block, but I still expect the uptrend to continue.
The next price target is $0.02.
PENGU: Bullish Falling Wedge Formation.Hello Traders,
Today, let’s analyze PENGU on the daily timeframe.
PENGU is currently forming a falling wedge pattern, which is typically a bullish setup. However, this will only be confirmed if we see a breakout above both the 50 EMA and the resistance trendline. PENGU has proven to be a profitabl

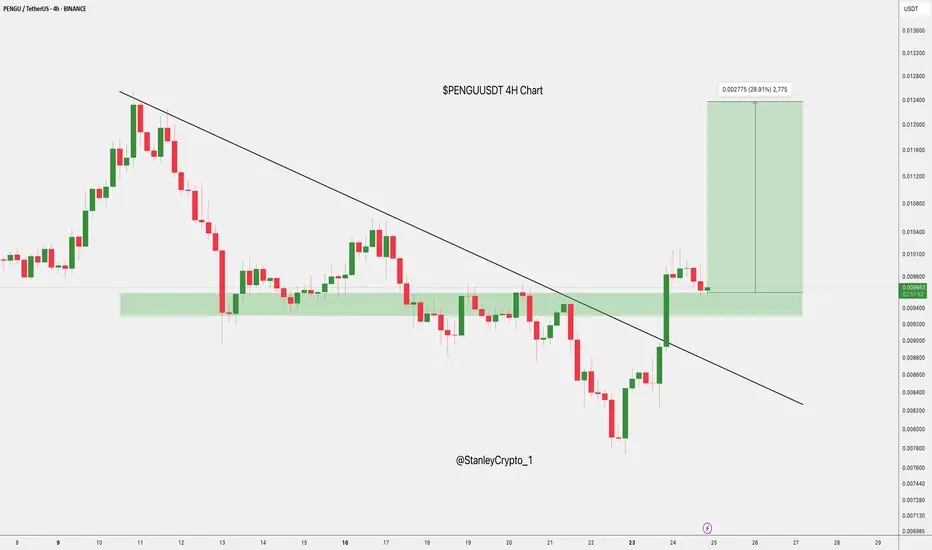
$PENGU Breakout RetestCSECY:PENGU broke above the downtrend and is now retesting the breakout zone.
Holding this support could trigger a 28.91% move higher. Structure remains bullish above this level.
DYRO, NFA
$PENGU - S/R FlipBINANCE:PENGUUSDT | 1D
The price has retested the support/resistance level at 0.008, potentially indicating a support/resistance flip.
A break above the local resistance at 0.012 could lead to a retest of the 0.020–0.026 range.

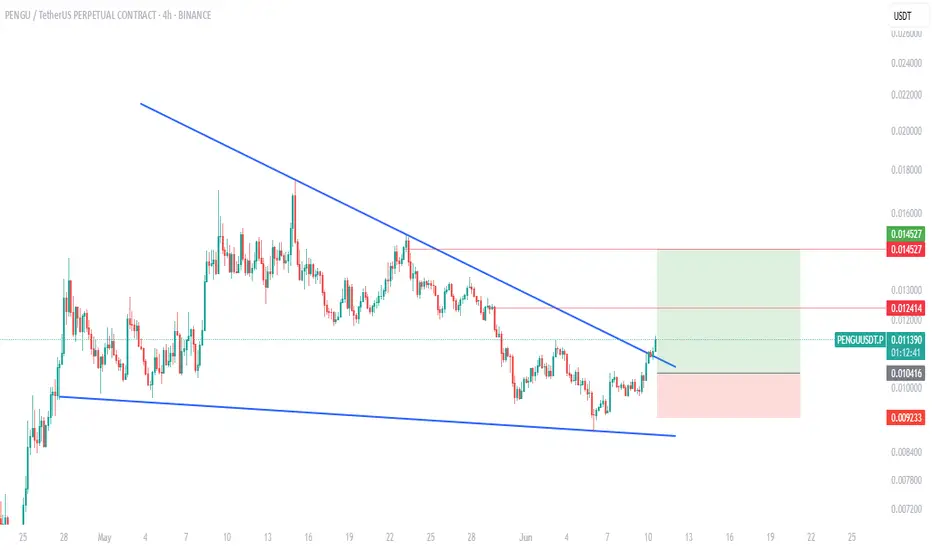
$PENGU Breakout Alert!After days of tight consolidation, PENGU has finally broken out of the falling wedge structure.
Price is pushing through resistance with strong momentum — our entry was right on the breakout!
Targeting the 0.0145 zone
Invalidated below 0.0092
This is a textbook breakout play — wait patiently, str
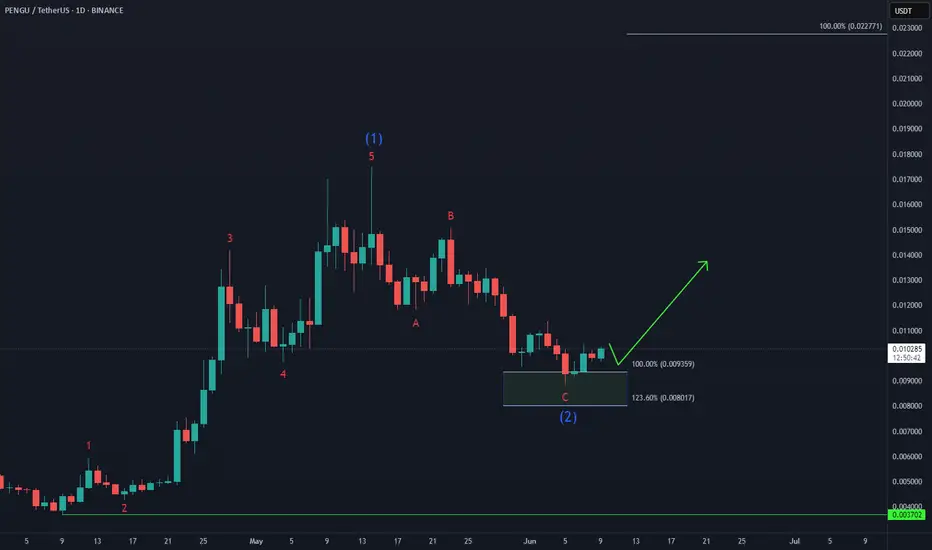
Pudgy Penguins PENGU Gearing Up for a +100% Move! 🐧 BINANCE:PENGUUSDT has completed its 5-wave advance from the April low (wave 1) and corrected with a 3-wave Zigzag structure in wave (2), reaching the buying area at equal legs $0.009 - $0.008.
🚀 Now, it's setting up for wave (3) higher, with an initial target at $0.022.
🌊 Are you positioned t
$PENGU Approaching Apex – Breakout Watch On!CSECY:PENGU is forming a symmetrical triangle on the 4H chart, and price is getting close to the apex.
It’s currently holding above the support trendline and the 200 EMA a key zone to watch.
A breakout above the triangle could push the price toward the $0.022–$0.023 range.
I’m watching closely. I

PENGU 12H – System Entry Triggered
PENGU just gave a system entry on the 12H time frame.
📌 The black line represents entry points from the 3D and 1W time frames. It has acted as a key level in the past and has now been flipped into support again.
📈 Price is currently pushing into the pink box, which may act as short-term resistanc

See all ideas
Summarizing what the indicators are suggesting.
Oscillators
Neutral
SellBuy
Strong sellStrong buy
Strong sellSellNeutralBuyStrong buy
Oscillators
Neutral
SellBuy
Strong sellStrong buy
Strong sellSellNeutralBuyStrong buy
Summary
Neutral
SellBuy
Strong sellStrong buy
Strong sellSellNeutralBuyStrong buy
Summary
Neutral
SellBuy
Strong sellStrong buy
Strong sellSellNeutralBuyStrong buy
Summary
Neutral
SellBuy
Strong sellStrong buy
Strong sellSellNeutralBuyStrong buy
Moving Averages
Neutral
SellBuy
Strong sellStrong buy
Strong sellSellNeutralBuyStrong buy
Moving Averages
Neutral
SellBuy
Strong sellStrong buy
Strong sellSellNeutralBuyStrong buy
Displays a symbol's price movements over previous years to identify recurring trends.