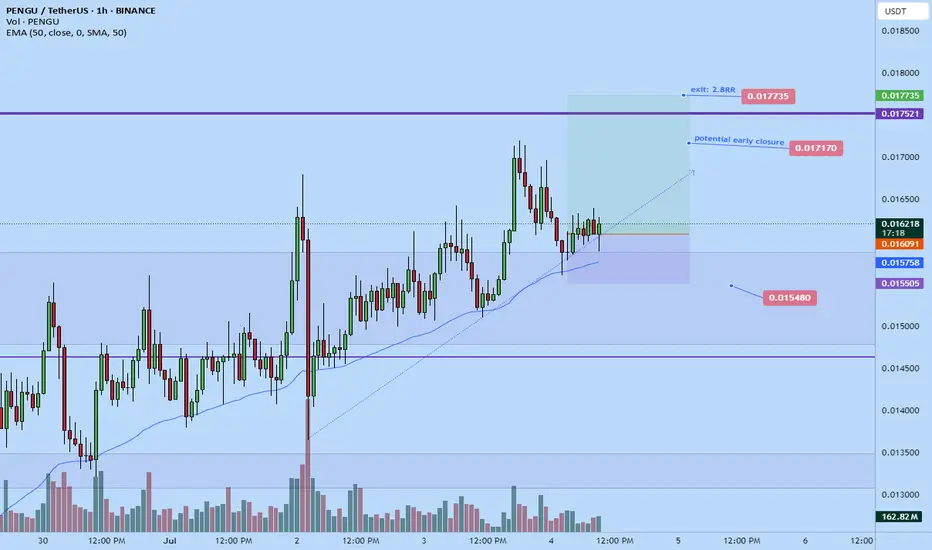
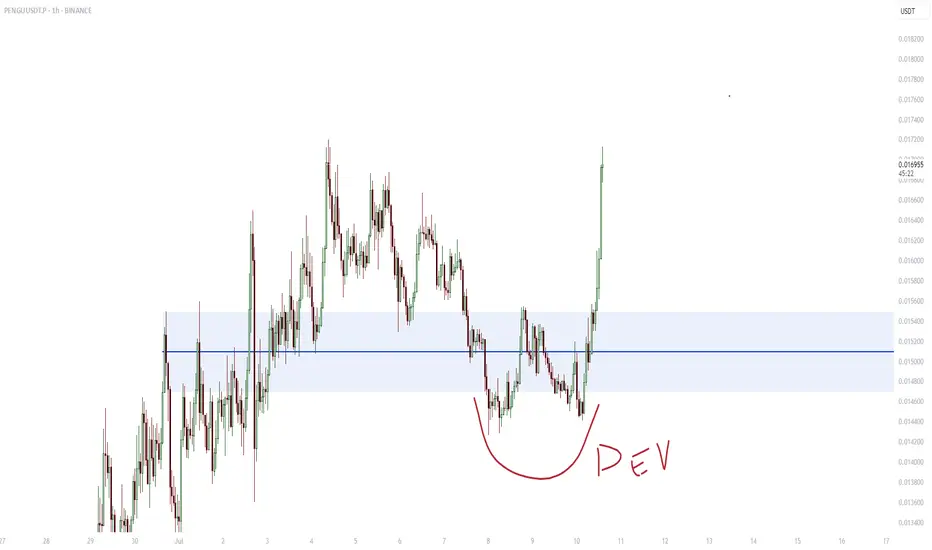
Pengu Long to $0.017735Just went long on Pengu. Targeting $0.017735
Stop: $0.015480
Almost 3RR
Time sensitive
PENGUUSDT trade ideas
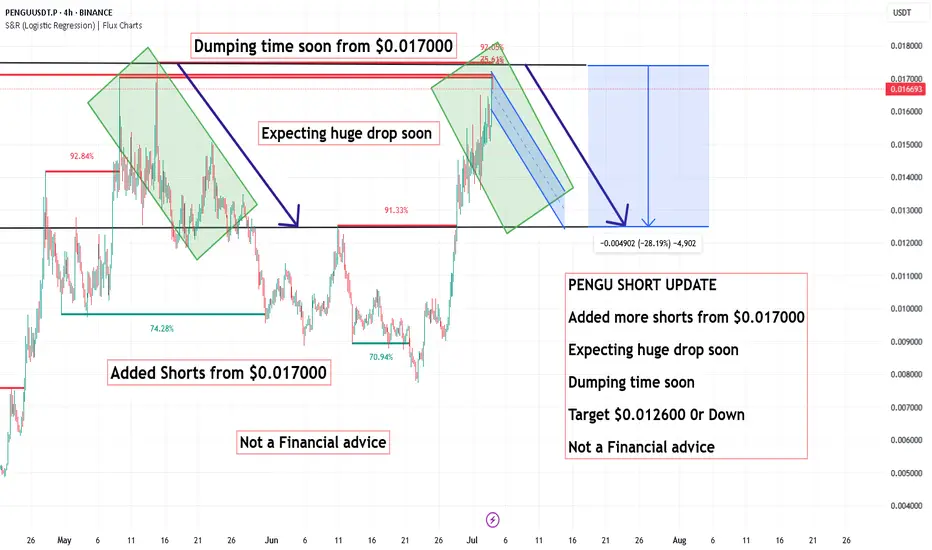
PENGU SHORT UPDATE Added more Shorts from $0.017000 (Dump time PENGU SHORT UPDATE
Added more shorts from $0.017000
Expecting huge drop soon
Dumping time soon
Target $0.012600 0r Down
Not a Financial advice
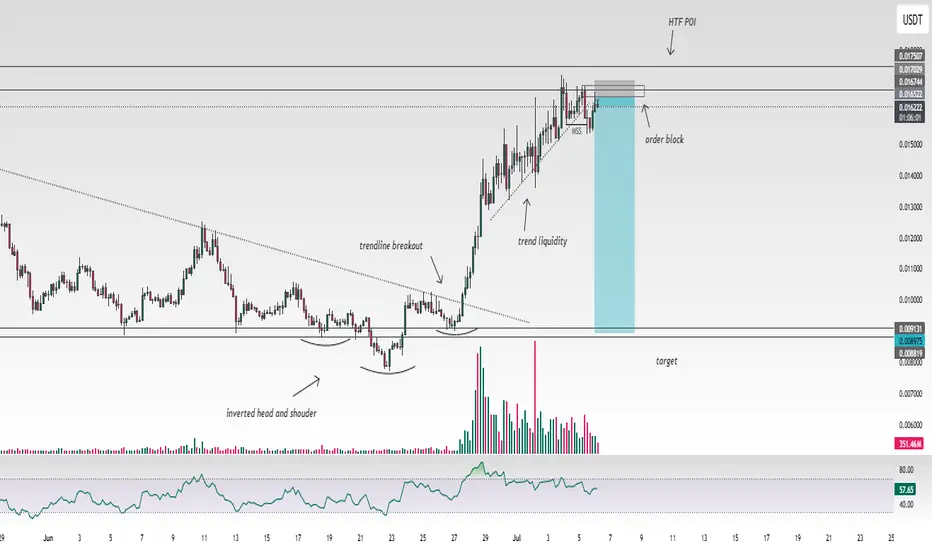
i am bearish for PENGUUSDT for now Key Observations & Analysis
Structure & Trend
You can see a clear downtrend in June.
Price formed an inverted head and shoulders pattern:
Left Shoulder: Early June low.
Head: Deeper low mid-June.
Right Shoulder: Late June higher low.
This is a bullish reversal pattern.
Trendline Breakout: After the right shoulder formed, price broke the diagonal trendline resistance (marked “trendline breakout”)—signaling bullish momentum.
Breakout & Rally
Strong volume increase confirmed the breakout.
Price trended up rapidly after the breakout, forming higher highs and higher lows.
Recent Price Action
The current price is consolidating in a key supply zone (gray shaded area).
Marked order block: a potential supply zone where smart money may sell.
Price has also made a Market Structure Shift (MSS)—suggesting the uptrend could be losing steam.
HTF POI (Higher Timeframe Point of Interest)
The upper gray box labeled HTF POI between ~0.0167–0.0175.
This is likely a major resistance area.
Price is testing this zone repeatedly.
Liquidity & Target
Trend liquidity has been swept, meaning stops above recent highs have likely been taken.
There is a blue shaded box indicating a potential short scenario:
Entry near the order block.
Target near the prior consolidation support around ~0.008–0.009.
This implies a bias toward a corrective move or retracement.
Volume & RSI
Volume spiked during breakout and has since decreased—often a sign of buyer exhaustion.
RSI around ~58—neutral but no overbought signal yet.
✅ Interpretation Summary
Bullish Arguments:
The inverted head and shoulders broke out cleanly.
Strong trend continuation into higher timeframe resistance.
Bearish Arguments:
Price is consolidating under significant resistance (HTF POI).
Order block + liquidity sweep suggest potential distribution.
Market structure shift indicates sellers are stepping in.
The blue target box shows a potential retracement target near 0.008–0.009.
✅ What This Likely Means
Scenario 1 (Continuation):
If price breaks cleanly above 0.0175 with strong volume, continuation higher is likely.
Scenario 2 (Rejection):
If price keeps rejecting this order block, a short-term pullback toward 0.009 becomes probable.
✅ Tip if You’re Trading This
Watch for a clear reaction in the gray order block area.
Confirmation of rejection could trigger shorts.
A strong close above the HTF POI invalidates the bearish scenario.
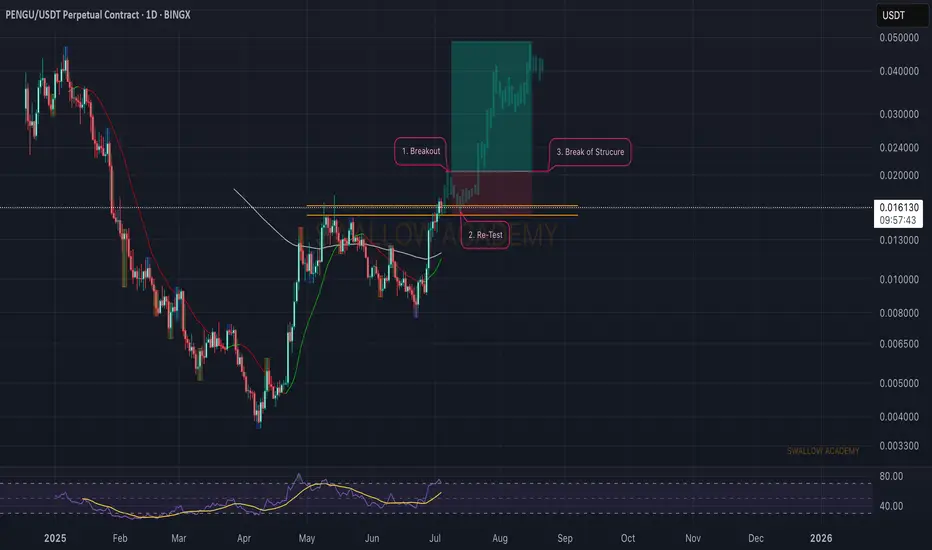
Pudgy Penguins (PENGU): Looking For Break of StructurePengu is forming another BOS (possibly), which will give us a good opportunity for a further movement to upper zones.
We are waiting for the clean breakout from here; after that, we want to see the retest and another BOS, which will be our final confirmation, so our attentions are here right now.
Swallow Academy
PENGU Just Triggered a Massive Breakout! Key Levels to WatchYello, Paradisers! Are you watching what’s unfolding with #PENGU after months of quiet accumulation? Because this chart is finally waking up, and it’s happening right now.
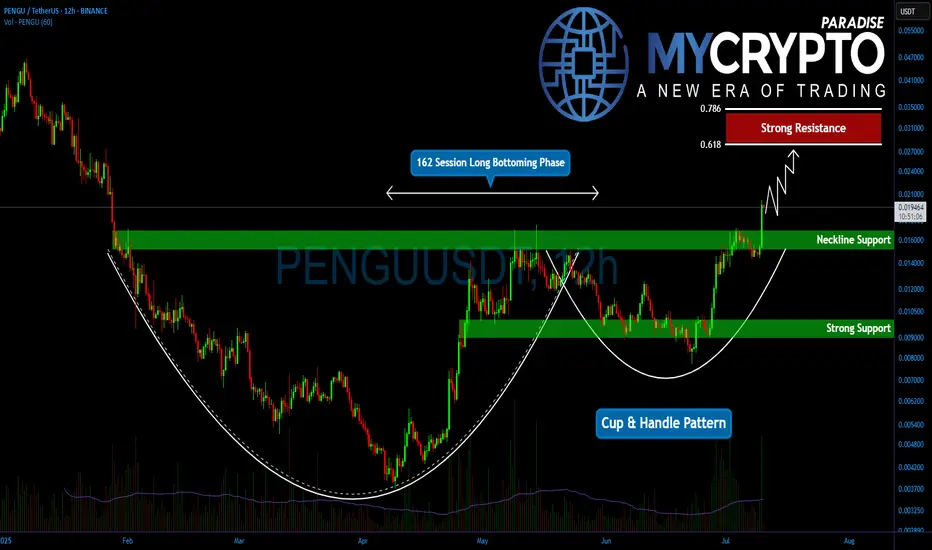
💎After a prolonged bottoming phase that lasted approximately 162 sessions, PENGU has completed a classic cup and handle formation, and we’re now seeing the start of what could be a powerful breakout.
💎#PENGUUSDT has surged above the neckline resistance at $0.01680, and—more importantly, this breakout is backed by strong volume, giving the move real credibility. It’s not just a wick; it’s a genuine push.
💎Now that the neckline is broken, PENGU has room to push higher. But let’s be clear, price is likely to face moderate resistance at the $0.02280 level. That’s a spot where some short-term profit-taking can’t be ruled out, especially from early entries. It’s a natural reaction zone and a moment to watch for how price behaves under pressure.
💎Still, if momentum holds, the pattern suggests a potential move toward the $0.02820 to $0.03200 region. That zone is no joke. It includes the 61.8% and 78.6% Fibonacci retracement levels, two of the most powerful technical resistance points in any market cycle. This makes that area a major decision zone and one that should be approached with caution.
💎On the other side, support is now established between $0.01680 and $0.01500. This is the previous resistance zone, and any retest into this range is likely to see strong demand stepping in. It would not be surprising to see buyers defend this area aggressively, especially if the retest is clean and orderly.
Strive for consistency, not quick profits. Treat the market as a businessman, not as a gambler. This is the only way you will make it far in your crypto trading journey. Be a PRO.
MyCryptoParadise
iFeel the success🌴
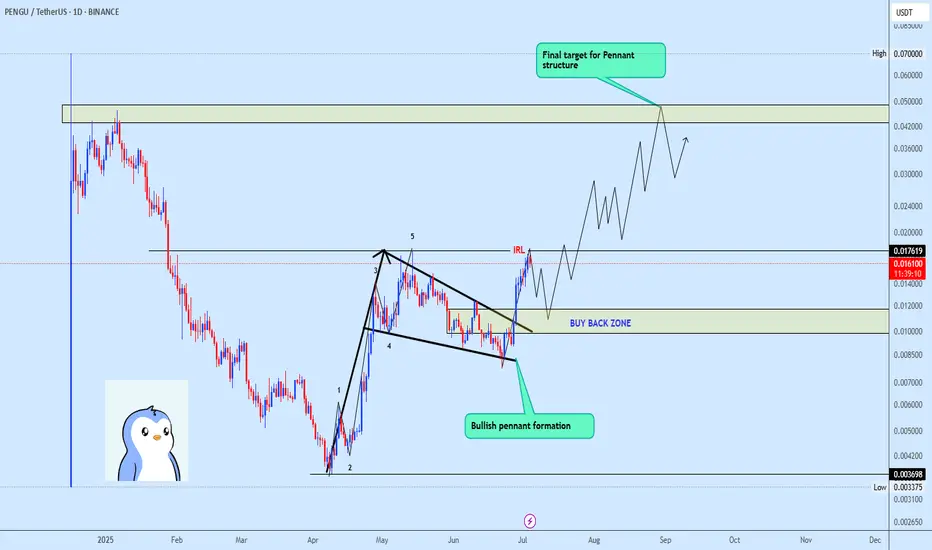
Penguusdt Buy opportunityPENGUUSDT is exhibiting a potential bullish pennant formation, with price making a strong breakout from the consolidation zone.
It recently found resistance near the top of the pennant pole around the $0.0176 level, which aligns with the Immediate Internal Resistance Level (IIRL).
The current plan is to watch for a pullback into the designated buy-back zone, offering a possible re-accumulation opportunity. If the structure holds, the projected pennant target sits around the $0.043 zone, as illustrated on the chart.
PENGU: Bullish Falling Wedge Formation.Hello Traders,
Today, let’s analyze PENGU on the daily timeframe.
PENGU is currently forming a falling wedge pattern, which is typically a bullish setup. However, this will only be confirmed if we see a breakout above both the 50 EMA and the resistance trendline. PENGU has proven to be a profitable meme coin for many traders, and so far, the price action looks promising.
Strategy:
~ Long Entry: $0.0108 (after breakout confirmation)
~ Target: $0.015 – $0.017
~ Holding Period: Q3 2025
~ Trade Type: Spot / 2–3x Leverage
Note: Always conduct your own research and analysis before investing.

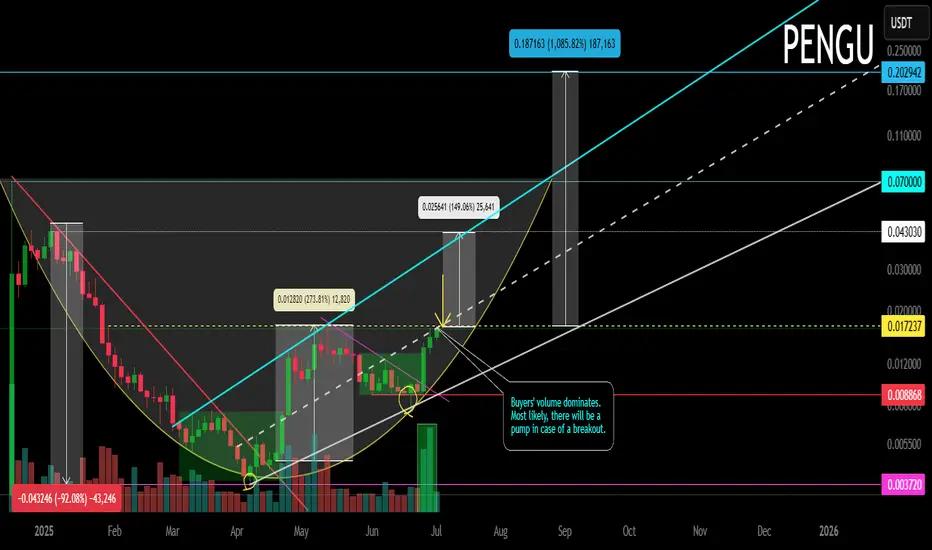
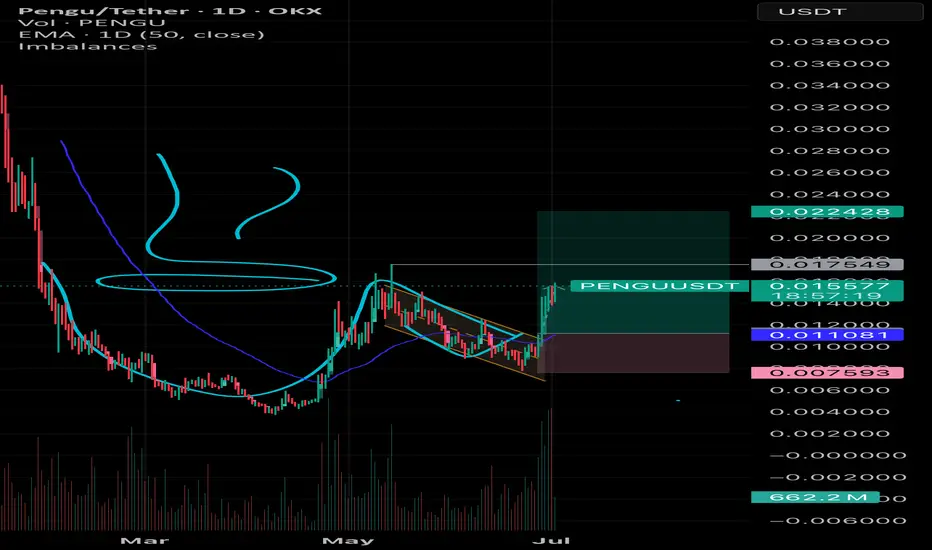
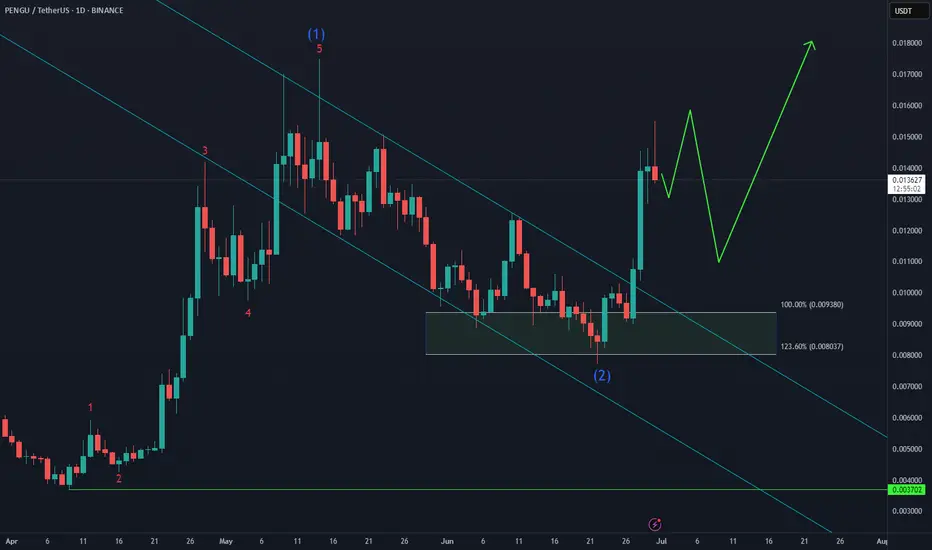
PENGU. Main trend. Trend reversal zone. 04 07 2025Logarithm. Main trend. Fresh cryptocurrency, which is being driven into hype.
Locally now. Price at the median of the bowl.
Buyer volume dominates. Most likely, there will be a large pump in case of a breakout.
The chart is somewhat reminiscent of the Bitcoin chart, the reversal zones of this secondary trend, after the first local wave of growth. The first local, significant target is shown.
There is a possibility of a helicopter, that is, to collect stops in both directions, and thereby dump passengers before a potential pump.
Such cryptocurrencies (low liquidity, monopoly over the price due to the concentration of cryptocurrency in “one hand”) at a good time "the hamster is not scared", will be pumped up conditionally, like Shiba Inu (SHIB), driving the hype (raising the price over and over again, and coming up with positive news) and 0.5 million Twitter subscribers (X). Medium-term — long-term level zones are shown on the chart.
The best-looking HTF meme chart, hands down is $PENGUThe team behind the crypto mascot accomplished a lot over the last couple of weeks, and the TA is showing;
- CBOE filing for PENGU ETF
- Appeared at @Nasdaq
- Listed on @eToro
- Listed on @RevolutApp
- Listed on @Official_Upbit
- Listed on @WebullGlobal Pay
- @NASCAR Partnership
- PEZ x Pudgy Penguins Partnership
- Miles & More Partnership
- @PenguClash reached 2M+ on waitlist
- 1B views per day
All this and much more!
@pudgypenguins are doing it the right way 🐧
PENGU/USDT Breakout Power — Start of a New Bullish Wave?
📌 Technical Overview:
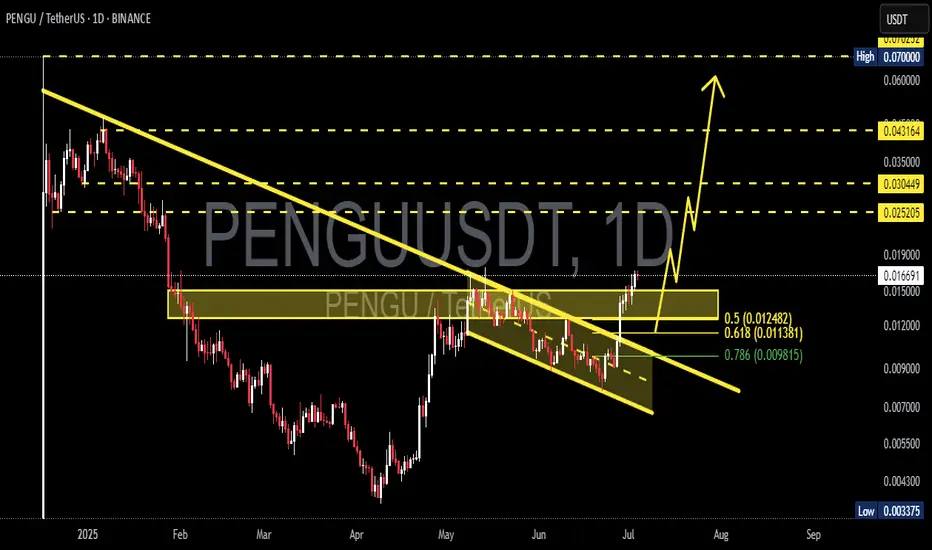
The chart of PENGU/USDT on the daily timeframe has just printed a very strong bullish signal. After months of downward movement, the price has successfully broken out from a well-formed Falling Wedge — a classic bullish reversal pattern.
🧠 Pattern Analysis:
📉 Falling Wedge:
The wedge started forming since January 2025, marked by a series of lower highs and lower lows. Price action was squeezed into a narrowing range, indicating weakening bearish pressure.
The breakout in early July came with strong momentum, confirming bullish intent.
🟨 Key Demand Zone (Highlighted Box):
Between 0.0113 – 0.0124 USDT, this area aligns with key Fibonacci retracement levels:
0.5 @ 0.01248
0.618 @ 0.01138
0.786 @ 0.00981
This zone now acts as critical support, offering a possible buy-the-dip opportunity.
📏 Major Resistance Levels (Targets):
TP1: 0.02520 USDT – Minor resistance, first breakout confirmation
TP2: 0.03044 USDT – Structural mid-level resistance
TP3: 0.04316 USDT – Major psychological and structural barrier
TP4: 0.07000 USDT – Former high, potential long-term target
🟢 Bullish Scenario:
Price has cleanly broken above the wedge resistance and is now retesting or consolidating above the prior resistance zone.
As long as the price holds above 0.012 USDT, the bullish structure remains intact.
The ideal bullish path would be:
1. Minor pullback or retest to the yellow box area (demand)
2. Strong rally toward 0.025 USDT, followed by gradual climb toward 0.030 – 0.043 USDT
3. With sustained volume, 0.07 USDT becomes a realistic mid-term target
🔴 Bearish Scenario:
Failure to hold the 0.012 – 0.011 USDT demand zone would trigger a warning sign.
Breakdown below 0.0098 USDT (Fibo 0.786) would invalidate the breakout, and potentially resume the bearish trend.
If this happens, watch for price to revisit lower supports around 0.0075 – 0.0050 USDT
🧩 Volume and Momentum Watch:
The breakout was supported by a clear uptick in volume – a strong confirmation signal.
Keep an eye on RSI and MACD on your platform — if bullish divergence continues, it could fuel a sustained breakout.
💬 Summary:
> “PENGU is no longer hibernating — the breakout from a long-term falling wedge pattern signals the beginning of a new trend. With a confirmed breakout, solid support at Fibonacci levels, and clearly defined targets ahead, PENGU/USDT could be setting up for a powerful bullish leg — but caution remains essential at support levels.”
📣 Join the Momentum Early!
If the bullish scenario plays out, this could be a high-reward setup — but always manage your risk!
#PENGU #AltcoinSeason #CryptoBreakout #FallingWedge #BullishCrypto #CryptoTA #TradingViewAnalysis #USDT #AltcoinAlert #ChartPattern #TechnicalBreakout
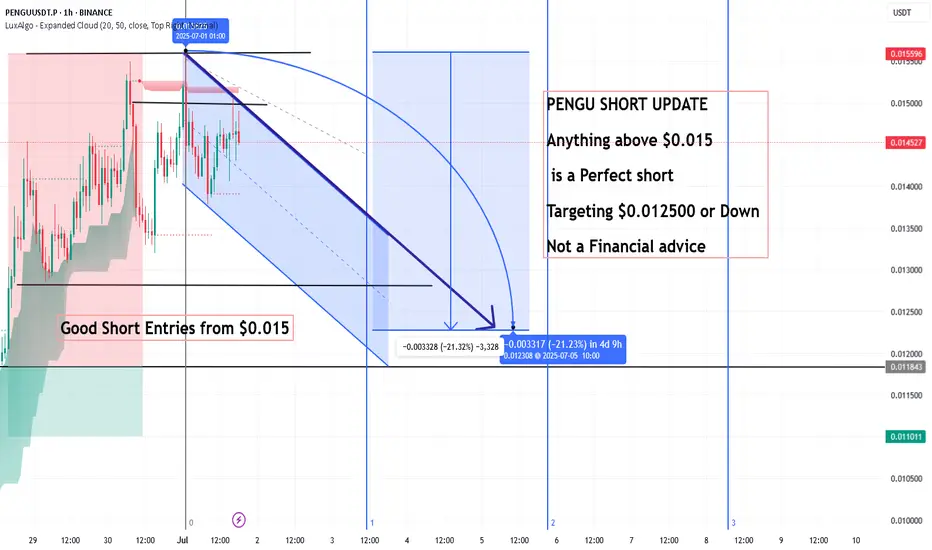
PENGU SHORT UPDATE ,Anything above $0.015 is a Perfect shortPENGU SHORT UPDATE
Anything above $0.015
is a Perfect short
Targeting $0.012500 or Down
Not a Financial advice
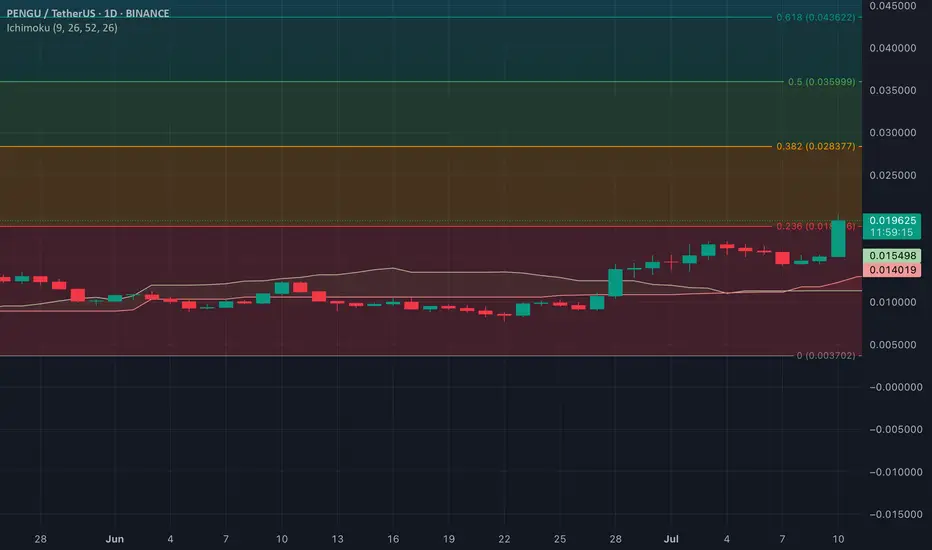
PENGU Above the Cloud – Bullish Momentum BuildsPENGU is maintaining a position above the Ichimoku Cloud on the daily chart — a signal that bullish momentum is in play. The cloud’s Leading Span A and B now act as dynamic support at $0.0154 and $0.0140, respectively, suggesting that the uptrend remains protected for now.
The Ichimoku Cloud indicator helps track trend direction and potential support/resistance zones. With PENGU trading above it, the bias remains bullish, pointing to increasing demand and fading bearish pressure. Should this accumulation phase hold, the price could push toward $0.0203 in the near term.
That said, caution is warranted. If buyers begin to exit and profit-taking sets in, PENGU risks falling close to the cloud’s upper boundary. Traders should watch for a change in volume or momentum that could signal a potential reversal.
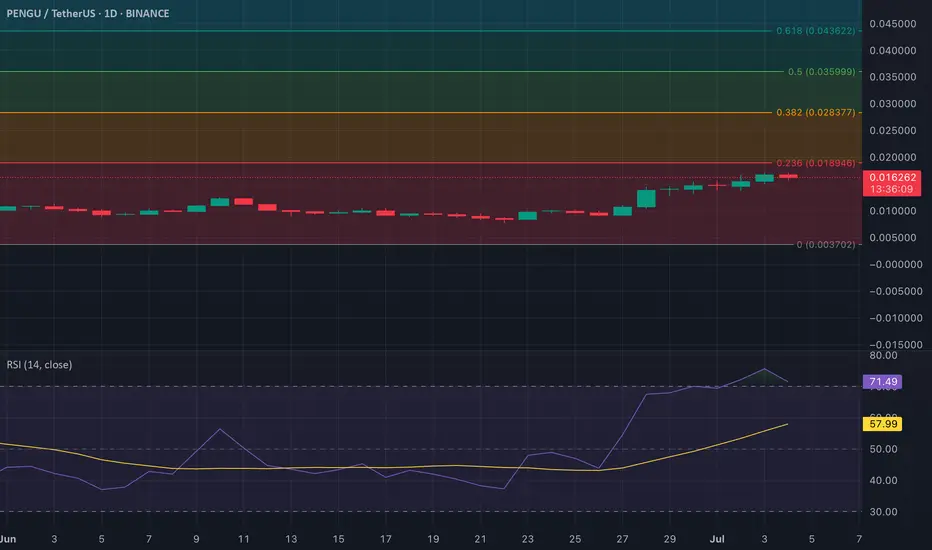
PENGU's RSI Signals Possible Pullback AheadPENGU may be at risk of a short-term correction as buying pressure cools off. The RSI currently sits at above 70, placing the altcoin firmly in overbought territory.
RSI values above 70 typically signals unsustainable momentum and hints at an upcoming pullback or consolidation phase.
Trader are advised to watch for weakening momentum as buyers become exhausted. Once selloffs commence, the token's price could fall to $0.0037.
On the other hand, if demand swells, the meme coin's price could reach $0.018.
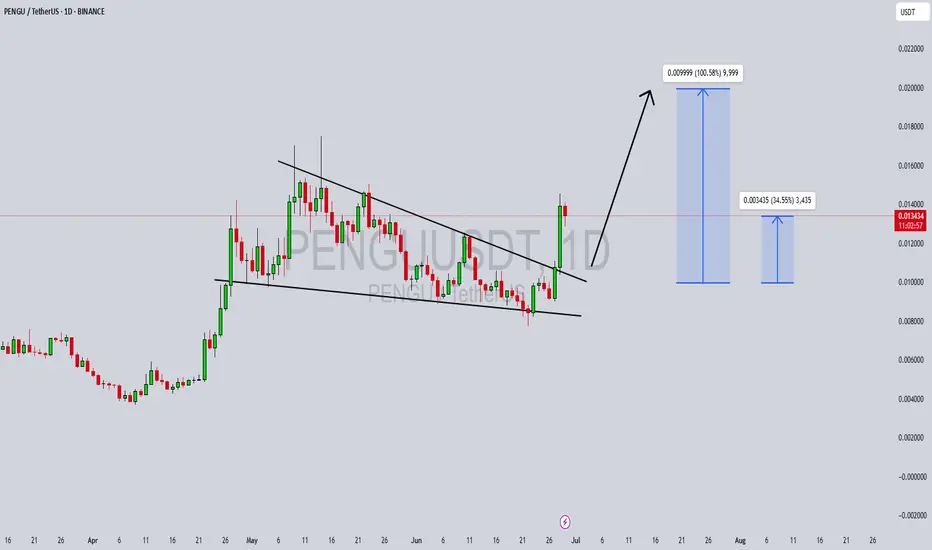
PENGUUSDT Forming Powerful Bullish SetupPENGUUSDT is quickly emerging as one of the standout crypto pairs to watch, with its chart showing signs of a powerful bullish setup. The price action indicates that buyers are steadily gaining control, supported by healthy trading volume that hints at strong investor confidence. With expectations for a potential gain of 90% to 100%+, traders are closely monitoring this pair for a breakout that could deliver significant profits in the short to mid-term.
Technical analysis reveals that PENGUUSDT has been consolidating within a clear structure, allowing accumulation at lower levels before a potential surge. As the market sentiment continues to shift towards more risk-on assets, coins like PENGUUSDT are seeing renewed buying interest from retail and institutional traders alike. The confluence of strong volume, consistent higher lows, and a breakout-ready structure provides a solid foundation for a substantial price move.
What makes PENGUUSDT particularly attractive is the growing attention it’s receiving across crypto communities and trading circles. Investors recognize that such setups, combined with good liquidity and project fundamentals, can yield impressive returns once the market confirms a decisive move. Keeping an eye on breakout levels and sustained volume spikes will be crucial for traders looking to capitalize on this promising opportunity.
Given the current market dynamics, PENGUUSDT is positioning itself as a potential leader among altcoins poised for explosive growth. Traders are advised to apply solid risk management and follow the price action closely as momentum builds up. A successful breakout could pave the way for PENGUUSDT to deliver one of the best percentage gains in the coming weeks.
✅ Show your support by hitting the like button and
✅ Leaving a comment below! (What is You opinion about this Coin)
Your feedback and engagement keep me inspired to share more insightful market analysis with you!
PENGU = ETF Catalyst + Whale Accumulation = +30% More Upside?Today, on the weekend, I want to analyze the Pudgy Penguins project with the PENGU ( BINANCE:PENGUUSDT ) token from a fundamental and technical perspective .
Please stay with me.
Why did PENGU surge nearly 40% in just 48 hours? Here’s what’s driving it:
------------------------------------------
Fundamental Analysis:
1. ETF Momentum via Cboe:
On June 26, Cboe officially filed a 19b-4 form for a new ETF that includes Pudgy Penguins and PENGU as major components.
Although not yet approved, this single move has fueled strong institutional anticipation, similar to what happened with Bitcoin ETFs in early 2023.
The market often prices in future narratives — and this ETF storyline has been a powerful one.
2.Whale Accumulation Signals
According to Nansen data, large holders have increased their balances by 11.37%, and notable wallets linked to public figures by 7% over the last 30 days.
Such coordinated accumulation often precedes major price moves, and that pattern seems to be repeating here.
3.NFT Ecosystem Boost
The Pudgy Penguins NFT collection saw a 400%+ surge in sales volume.
This sharp increase in NFT activity has reignited attention toward the broader Pudgy ecosystem, which naturally benefits its native token, PENGU.
Risk Note:
The ETF is not yet approved — we're still in the hype phase.
Volatility remains high, and strong pullbacks are common in low-liquidity tokens like PENGU.
If whale activity continues and institutional narratives grow, the upside potential remains — but so does the downside risk.
------------------------------------------
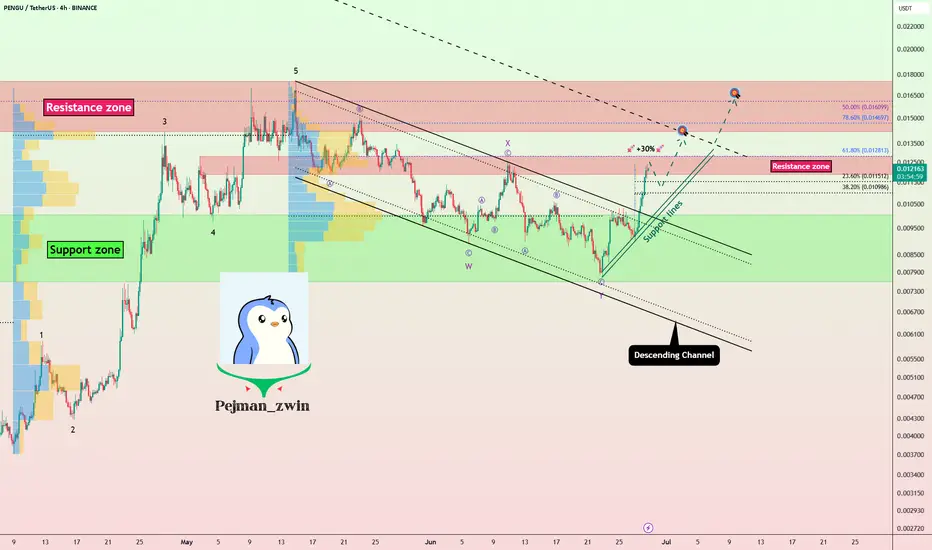
PENGU token started to rise from the Support zone($0.01-$0.0076) . One of the signs of a continuation of the uptrend was the break of the upper line of the descending channel .
Educational Note: One of the price targets after a channel break can be as wide as the width of the broken channel.
In terms of Elliott Wave theory , it seems that the PENGU token has completed the Double Three Correction(WXY) , and we can wait for the next impulsive waves .
I expect the PENGU token to attack the Resistance zone($0.0128-$0.0118) again, and if this zone is broken , it can increase to at least $0.0137(+30%) .
What is your idea about the Pudgy Penguins project?
Note: If the PENGU token drops below $0.01, we can expect a break of the Support zone($0.01-$0.0076).
Please respect each other's ideas and express them politely if you agree or disagree.
Pudgy Penguins Analyze (PENGUUSDT), 4-hour time frame.
Be sure to follow the updated ideas.
Do not forget to put a Stop loss for your positions (For every position you want to open).
Please follow your strategy and updates; this is just my Idea, and I will gladly see your ideas in this post.
Please do not forget the ✅' like '✅ button 🙏😊 & Share it with your friends; thanks, and Trade safe.
Pudgy Penguins PENGU price analysis🪙 It seems that #PENGU is being sold off, and the price of OKX:PENGUUSDT has been stuck in consolidation at conditional highs for several days now, where positions are likely being redistributed.
Nevertheless, if at the beginning of the year, after listing, the price of the #PudgyPenguins token was released into not even “free float,” but simply into “free fall,” now, for several months, it has been “held” in a controlled manner.
🐻 If our assumption is correct, then the price of #PENGUUSDT should adjust to $0.01 or, in the worst case, to $0.0065-0.0070
📈 And if we are wrong, then the price of #PENGU has every chance of breaking out through to $0.02 in the coming days. With a global target of $0.03
⁉️ What is your opinion
Is this a fundamental project that is doomed to grow, or just a manipulative memecoin toy?
_____________________
Did you like our analysis? Leave a comment, like, and follow to get more
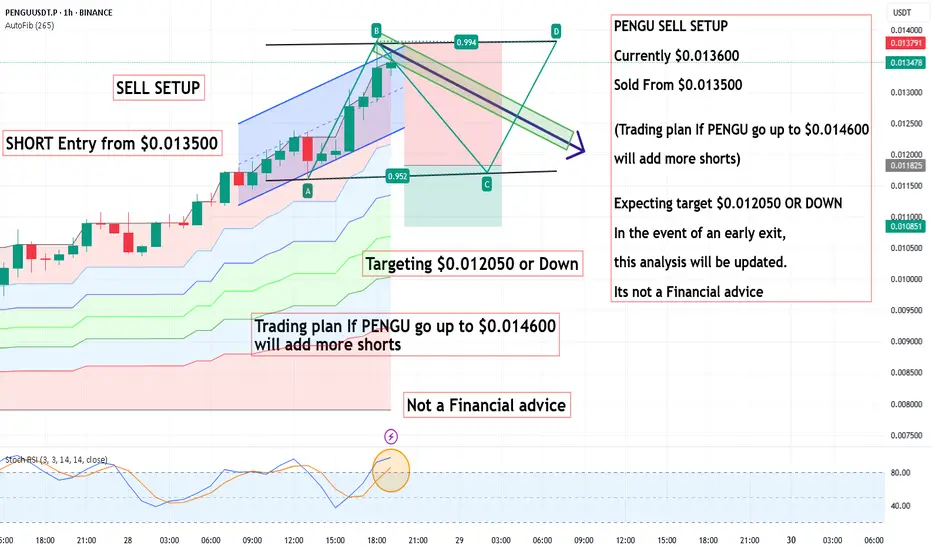
PENGU SELL SETUP ,Sold From $0.013500PENGU SELL SETUP
Currently $0.013600
Sold From $0.013500
(Trading plan If PENGU go up to $0.014600
will add more shorts)
Expecting target $0.012050 OR DOWN
In the event of an early exit,
this analysis will be updated.
Its not a Financial advice
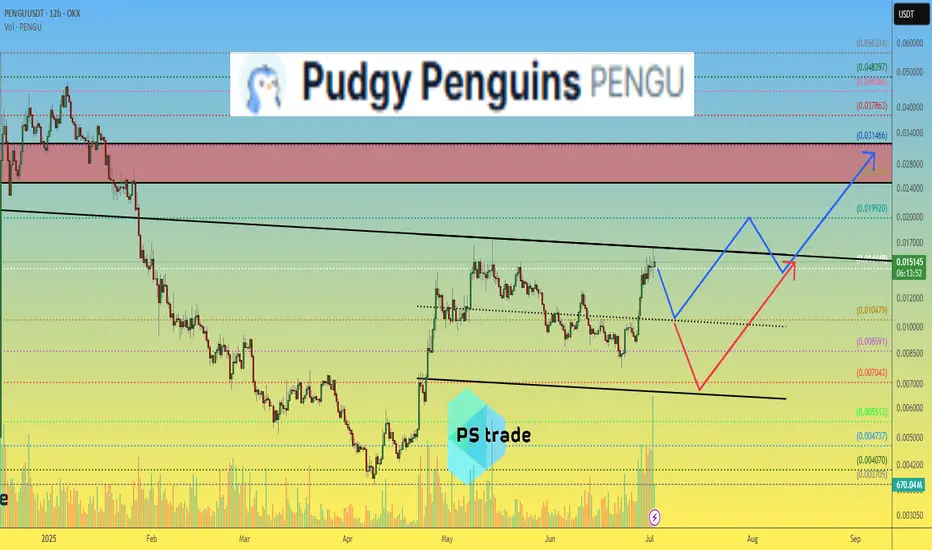
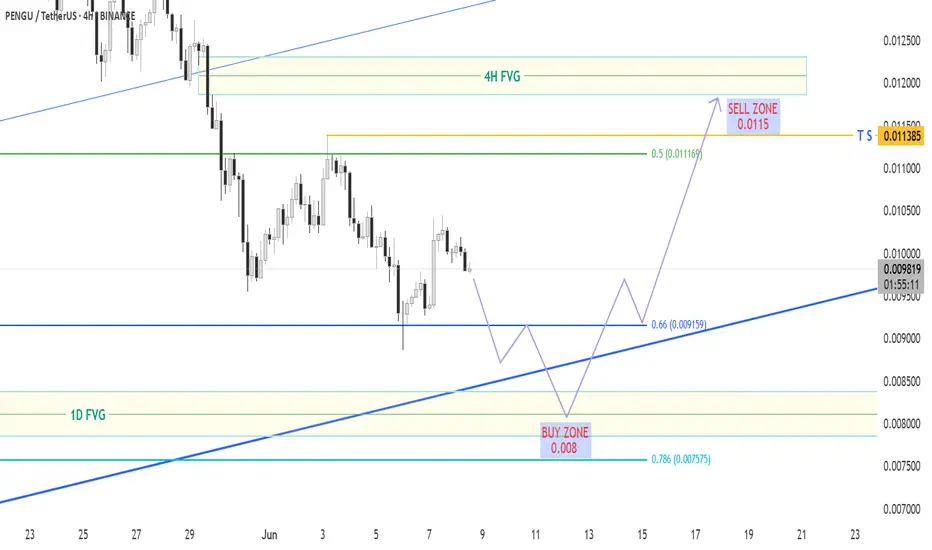
PENGU/USDT: The Penguin's Journey to Recovery!📊 CURRENT SITUATION 🔔
🎯 THE BIG PICTURE: "Penguin Waddle Pattern"
PENGU is currently executing what I call the "Antarctic Slide Recovery" - a classic bounce pattern after a significant correction from the 4H Fair Value Gap (FVG).
🟢 BUY ZONE (Support Cluster)
* Primary Support: 0.008
* Fibonacci 0.786 Level: 0.0075
* 1D FVG: Providing strong foundational support
🚀 TRADING SCENARIO ⭐⭐⭐
- Target 1: 0.0095
- Target 2: 0.0114
- STOP LOSS: 0.007
- Ultimate Support: 1D FVG zone
🎯⚡ RISK MANAGEMENT
* Position Size: Risk only 2-3% of portfolio
* Time Horizon: 5-10 days for full target achievement
* Exit Strategy: Scale out at each resistance level
Remember: Trade what you see, not what you think! The market is the ultimate teacher. 🎓
Happy Trading! 🚀🐧
Care for a cup of tea? And this goes like this.
Cup with a handle. Perfect example?
Lets see how does this develop.
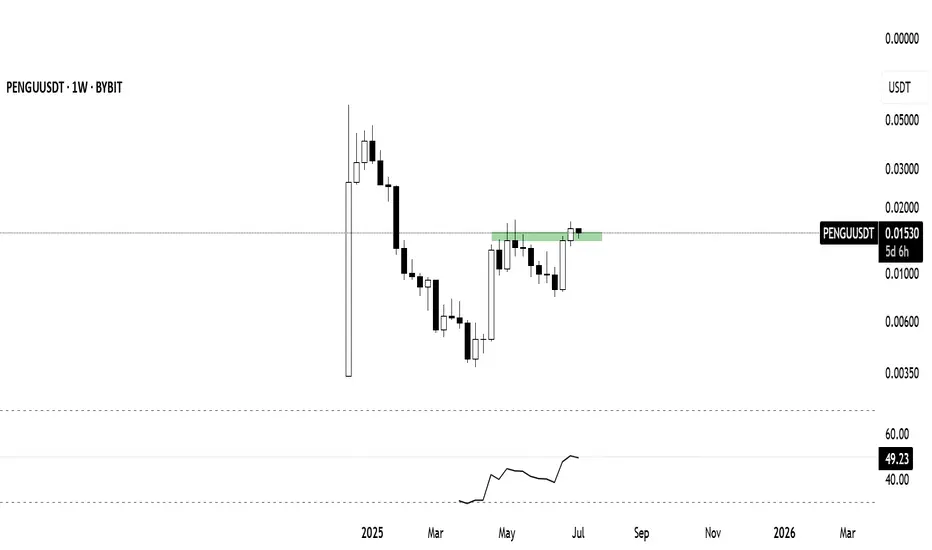
Pudgy Penguins PENGU Bullish Reversal Taking Shape🐧 Pudgy Penguins BINANCE:PENGUUSDT has bounced twice from the $0.009–$0.008 buying zone, showing resilience despite the choppy structure. As long as the June low holds, the setup favors a higher low formation next month, potentially setting the stage for the next impulsive leg higher.
Momentum is building — now it’s about follow-through and confirmation.
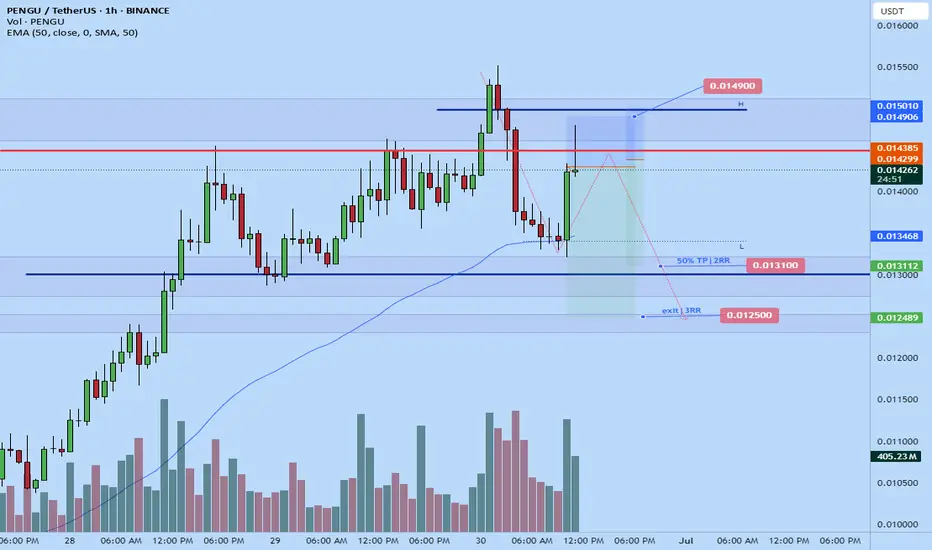
Pengu short to $0.0125Hopped into pengu short just now.
2-3RR setup
Stop: $0.0149
I reckon the current pullback is just to facilitate a new LH to short from. I didn't want for more confirmation just because by the time it comes the RR might be unfavorable.
Time sensitive
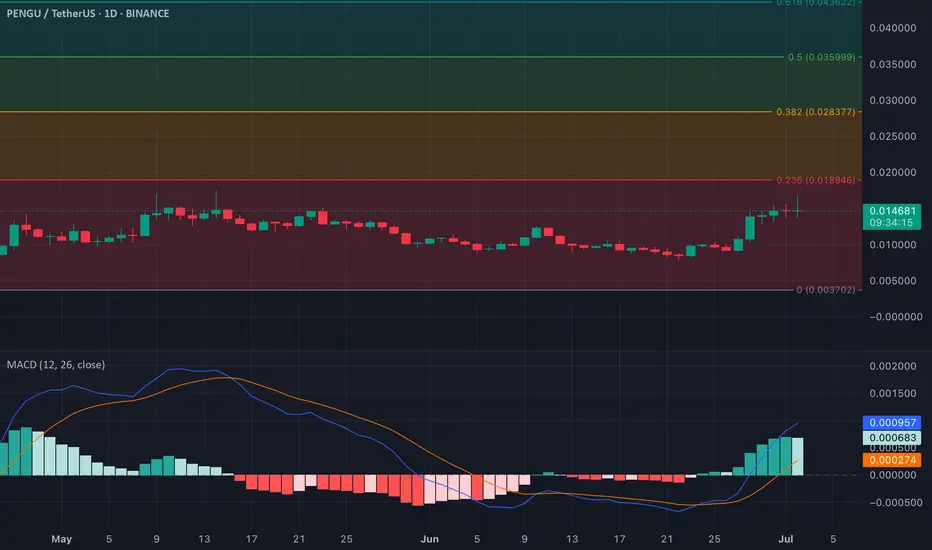
PENGU Price Outlook: Bullish Momentum BuildsPENGU shows signs of bullish strength on the charts. The MACD line is currently above the signal line, signaling positive momentum and increasing buying pressure. This crossover is typically viewed as a buy signal, suggesting bulls are gaining control.
A continued rally could send PENGU toward $0.0189.
However, failure to sustain this momentum might see the price drop back to $0.0037.