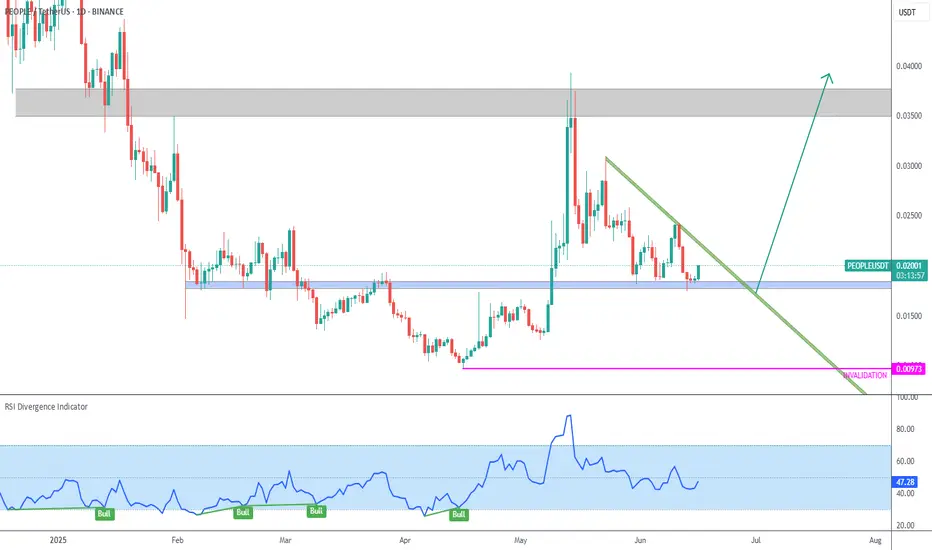
Good moment for try to Buy PEOPLEGood moment for try to buy PEOPLE. We see a weak upward trend forming. If it forms, now is the time to buy. Stop under the local minimum. We'll see.
#PEOPLE/USDT Breakout in Action!#PEOPLE
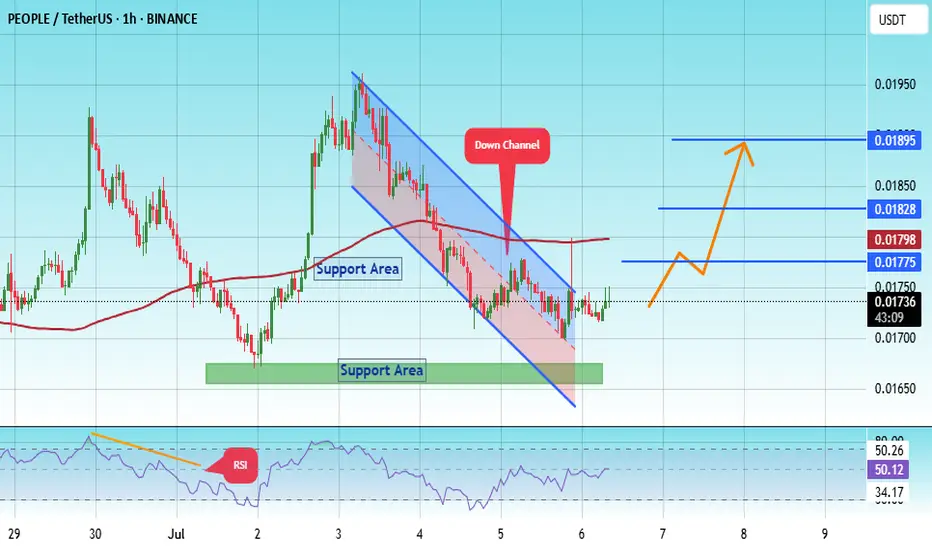
The price is moving within a descending channel on the 1-hour frame, adhering well to it, and is poised to break it strongly upwards and retest it.
We have a bounce from the lower boundary of the descending channel. This support is at 0.01660.
We have a downtrend on the RSI indicator that
#People/usdt#People
The price is moving within a descending channel on the 1-hour frame, adhering well to it, and is heading for a strong breakout and retest.
We are seeing a bounce from the lower boundary of the descending channel, which is support at 0.01750.
We have a downtrend on the RSI indicator that is
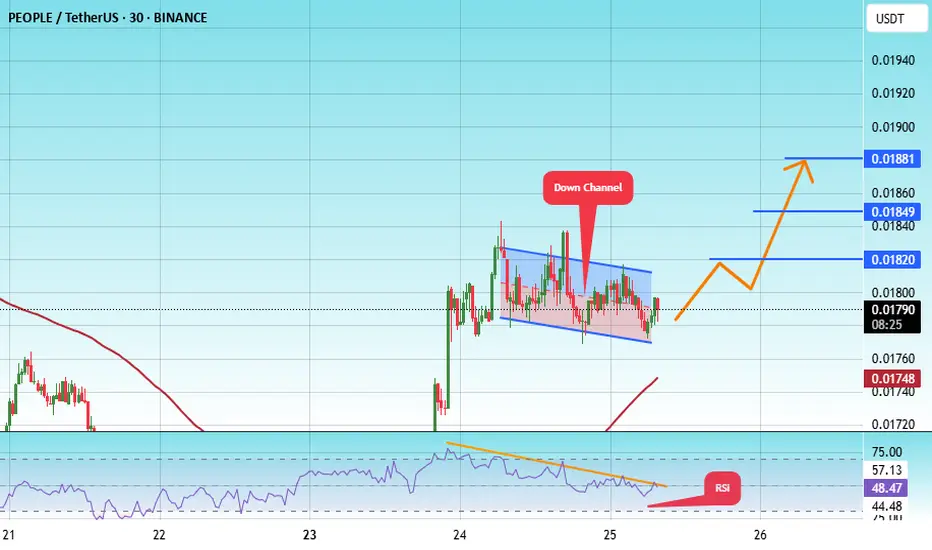
#PEOPLE Breakout in Action!#PEOPLE
The price is moving within a descending channel on the 1-hour frame, adhering well to it, and is poised to break it strongly upwards and retest it.
We have a bounce from the lower boundary of the descending channel. This support is at 0.01717.
We have a downtrend on the RSI indicator that
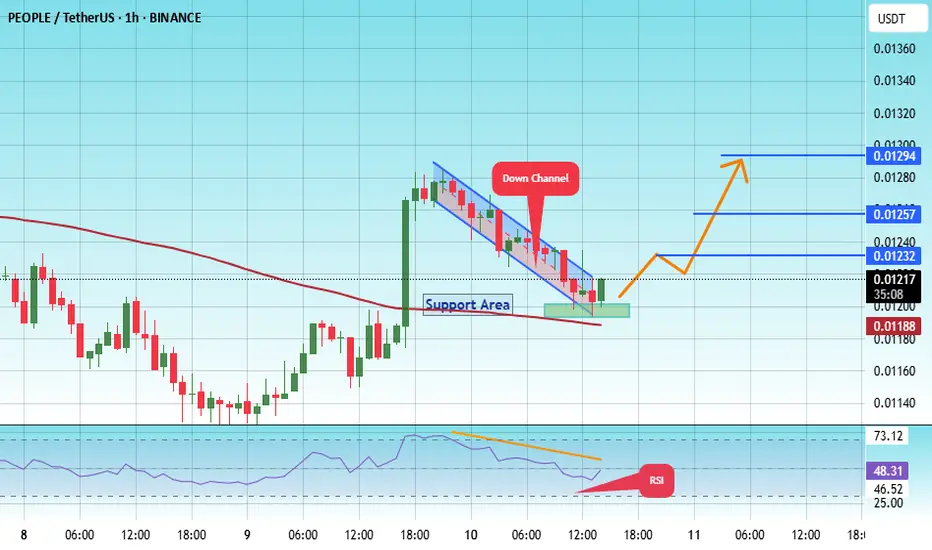
#PEOPLE/USDT#PEOPLE
The price is moving within a descending channel on the 1-hour frame, adhering well to it, and is on its way to breaking it strongly upwards and retesting it.
We are experiencing a rebound from the lower boundary of the descending channel, which is support at 0.01200.
We are experiencing a
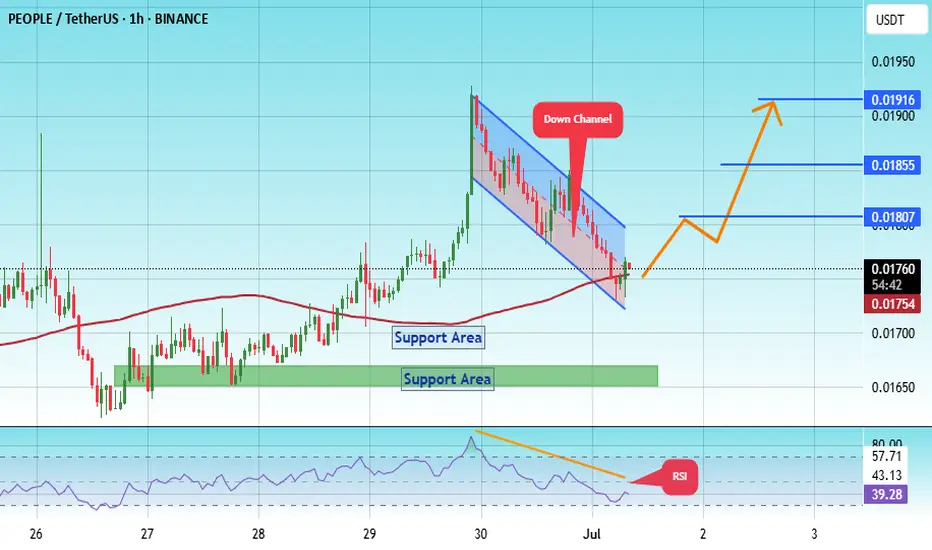
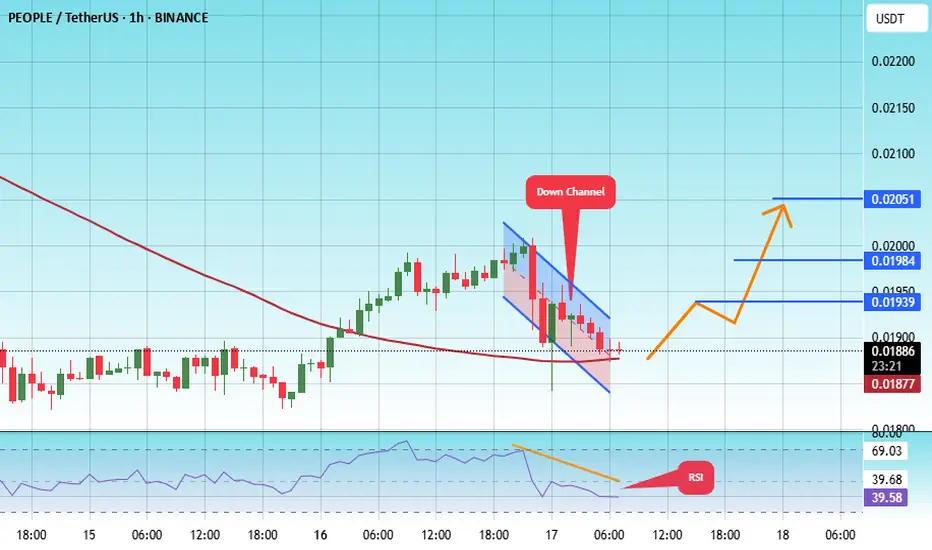
#PEOPLE/USDT#PEOPLE
The price is moving within a descending channel on the 1-hour frame, adhering well to it, and is heading for a strong breakout and retest.
We are seeing a rebound from the lower boundary of the descending channel. This support is at 0.01855.
We have a downtrend on the RSI indicator that is
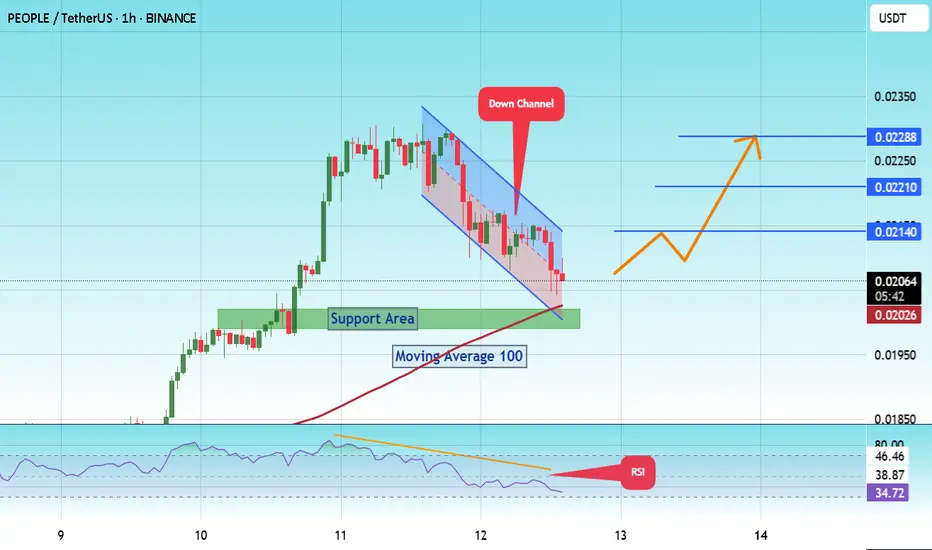
#PEOPLE/USDT trading opportunity#PEOPLE
The price is moving within a descending channel on the 1-hour frame and is expected to break and continue upward.
We have a trend to stabilize above the 100 moving average once again.
We have a downtrend on the RSI indicator that supports the upward break.
We have a support area at the l
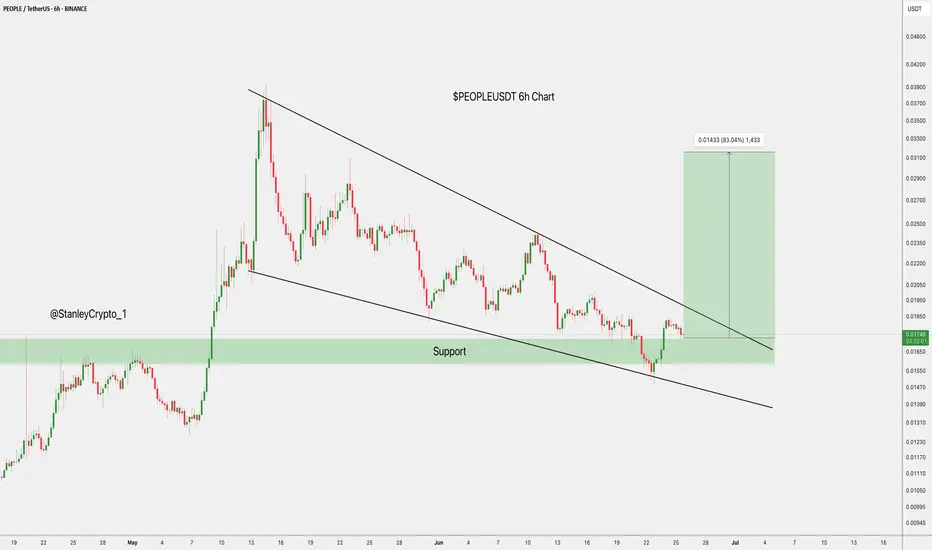
$PEOPLEUSDT Eyes 83% Upside – Watch This BreakoutBINANCE:PEOPLEUSDT is forming a bullish falling wedge on the 6H chart.
Price bounced from key support and is approaching the resistance line. A breakout could trigger a strong move toward $0.03160
Watch for confirmation.
DYRO, NFA
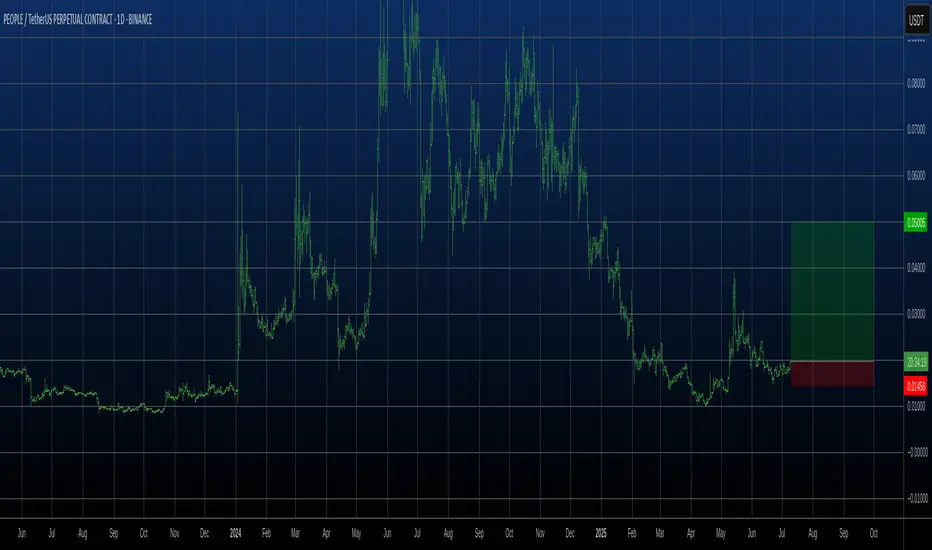
PEOPLE UpdateI´m considering the recent downside to be a correction from the move which began on mid-April.
Price is finding support in the blue 0.18 zone, but the lack of any reversal patterns in smaller timeframes leads me to believe that we will still see further tests of this level.
Break of the green desc
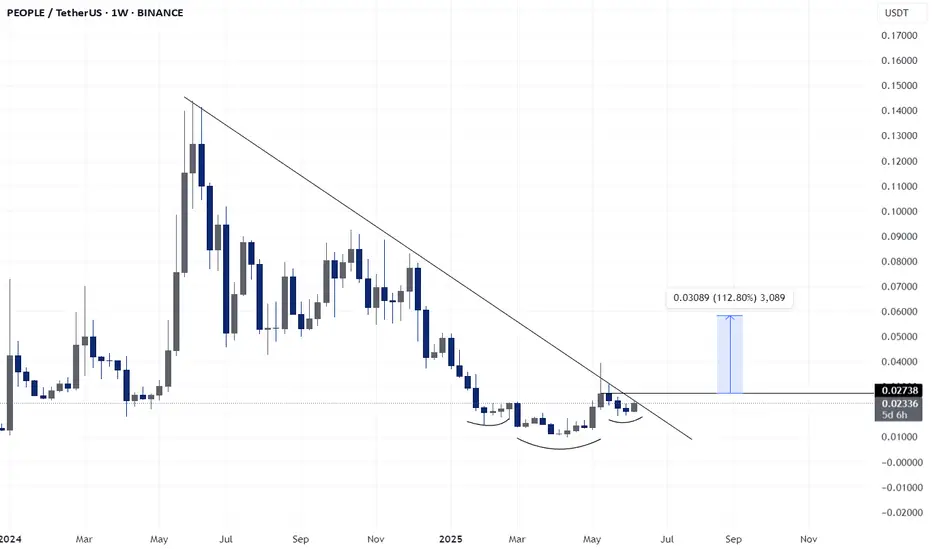
PEOPLE - Inverse Head & Shoulder Long SetupBINANCE:PEOPLEUSDT
𝐏𝐄𝐎𝐏𝐋𝐄/𝐔𝐒𝐃𝐓
People is shaping a classic inverse head & shoulders just under trendline resistance. A breakout could fuel a 113% move toward $0.054. Chart’s heating up
See all ideas
Summarizing what the indicators are suggesting.
Oscillators
Neutral
SellBuy
Strong sellStrong buy
Strong sellSellNeutralBuyStrong buy
Oscillators
Neutral
SellBuy
Strong sellStrong buy
Strong sellSellNeutralBuyStrong buy
Summary
Neutral
SellBuy
Strong sellStrong buy
Strong sellSellNeutralBuyStrong buy
Summary
Neutral
SellBuy
Strong sellStrong buy
Strong sellSellNeutralBuyStrong buy
Summary
Neutral
SellBuy
Strong sellStrong buy
Strong sellSellNeutralBuyStrong buy
Moving Averages
Neutral
SellBuy
Strong sellStrong buy
Strong sellSellNeutralBuyStrong buy
Moving Averages
Neutral
SellBuy
Strong sellStrong buy
Strong sellSellNeutralBuyStrong buy
Displays a symbol's price movements over previous years to identify recurring trends.