PEOPLE#PEOPLE
"BY PEOPLE, TO PEOPLE"
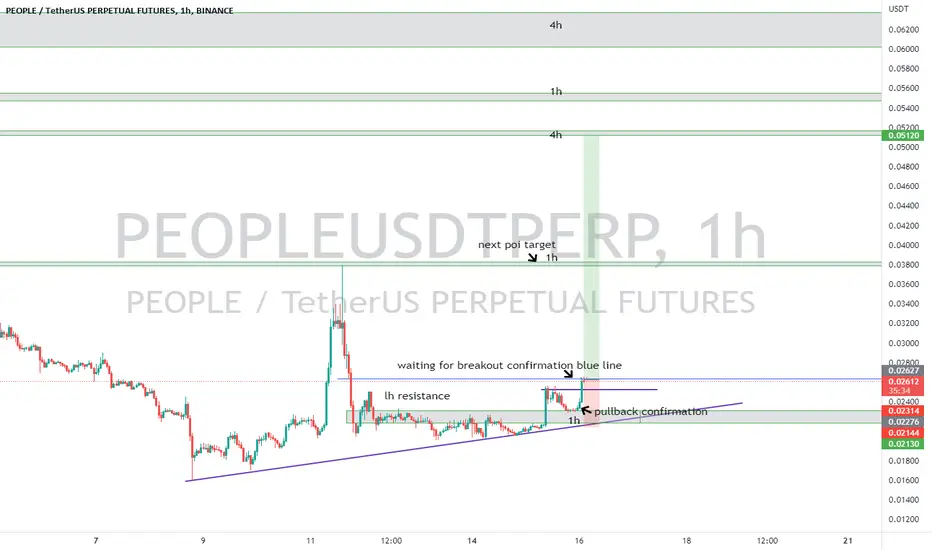
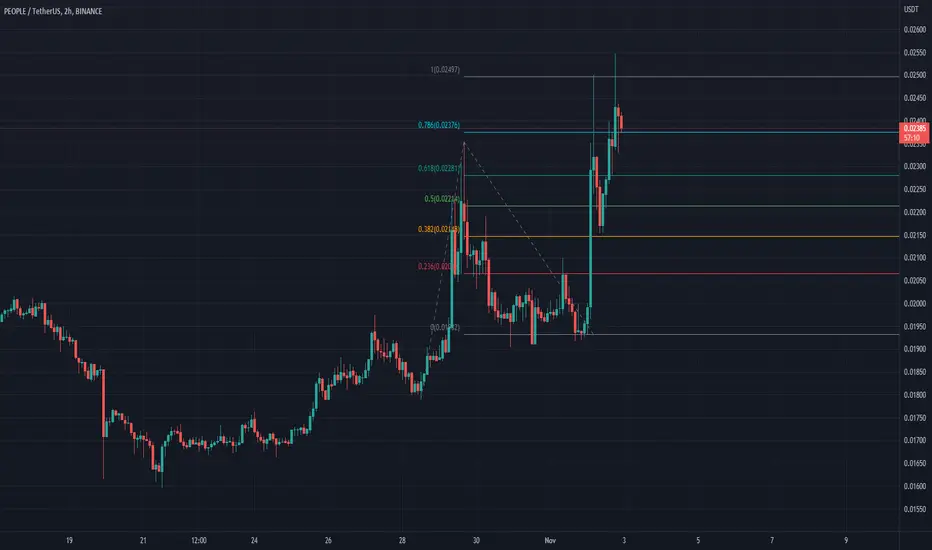
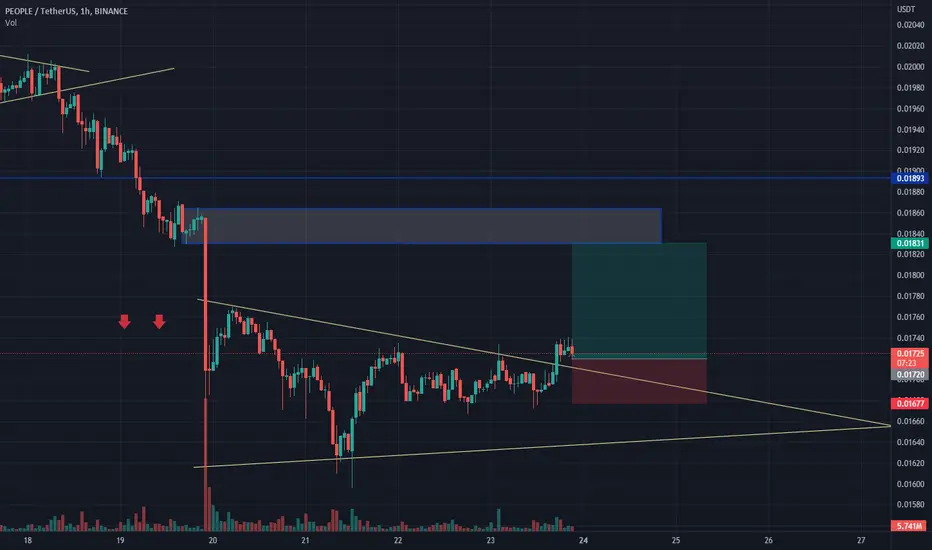
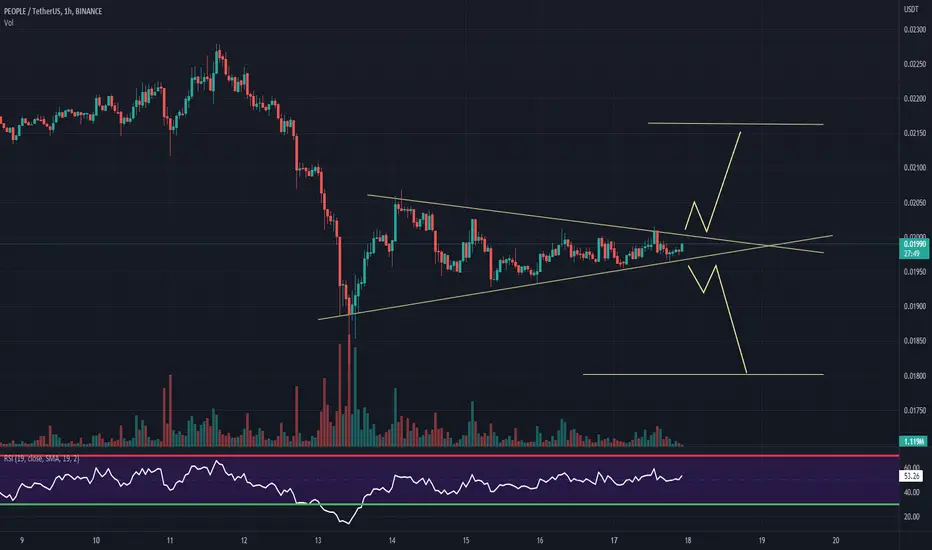
As ive checked the #people chart, im for LONG
with confirmation pull back and waiting and hoping to break my
blue line appearing 0.02634
and if happened, my target profit is my next poi 1h tf 0.038
unless if not breakout, waiting again for a pullback from 0.0219.
Goodluck
PEOPLEUSDT.P trade ideas
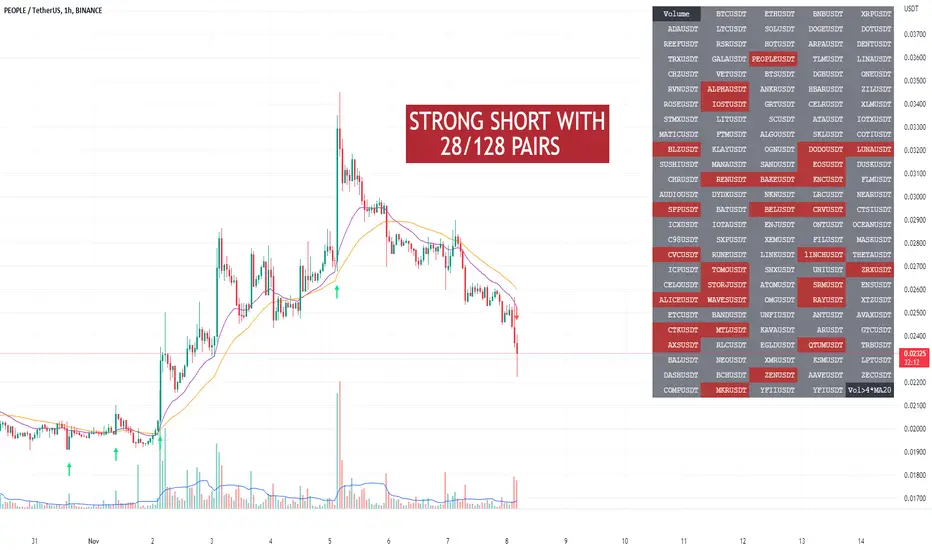
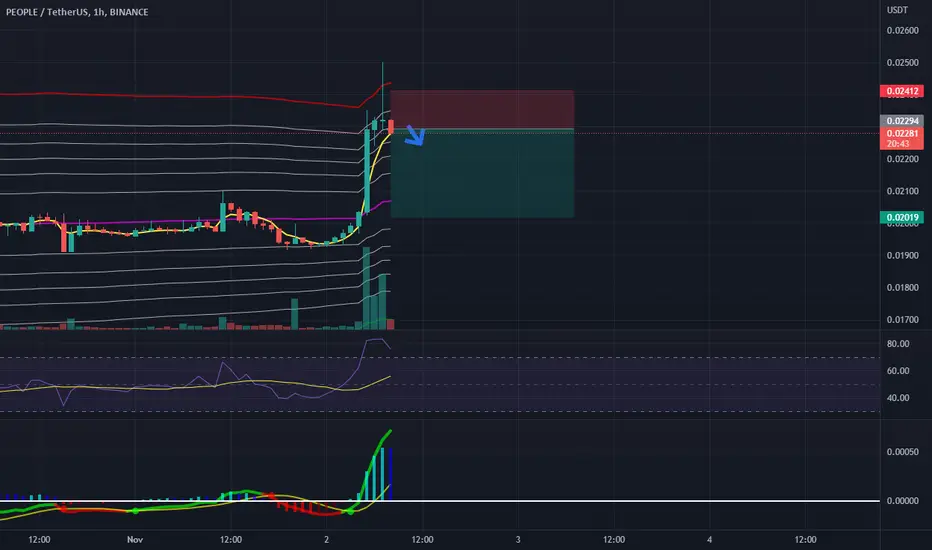
[SHORT] 28/128 pairs drop- 28/128 pairs drop with Short's volume > 4 x Moving average 20 past candles.
---> Only wait to a Sell.
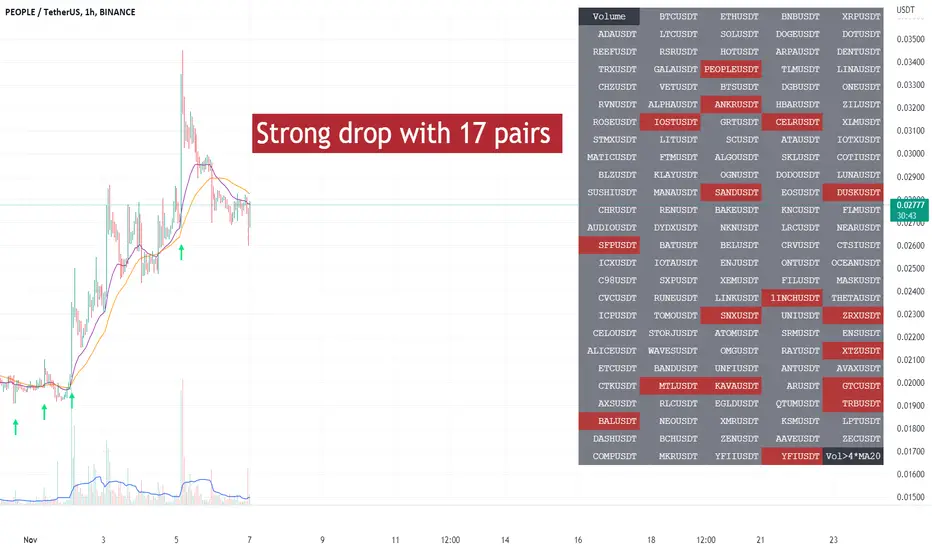
[Crypto] Strong drop with 17 pairs- 17 pairs drop with volume > 4 * moving average 20.
- Should wait for a Sell in Future.
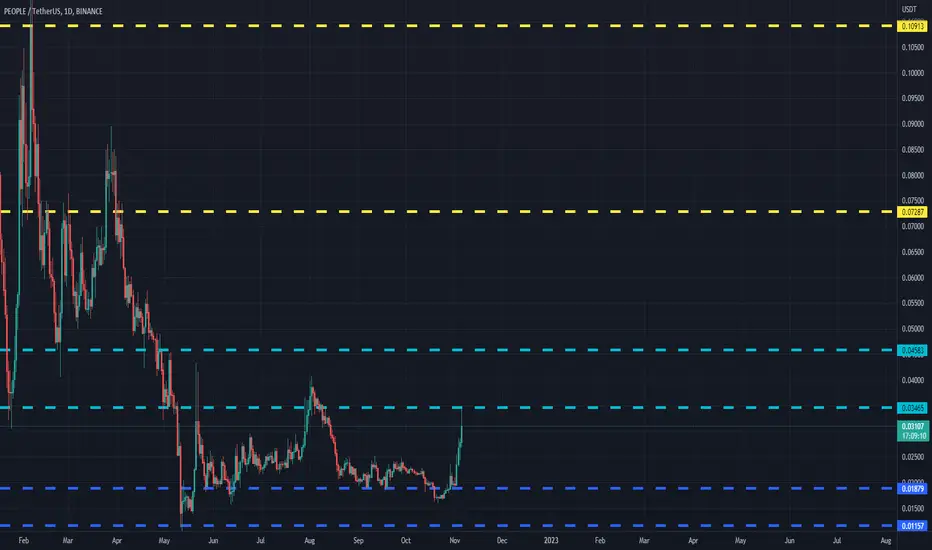
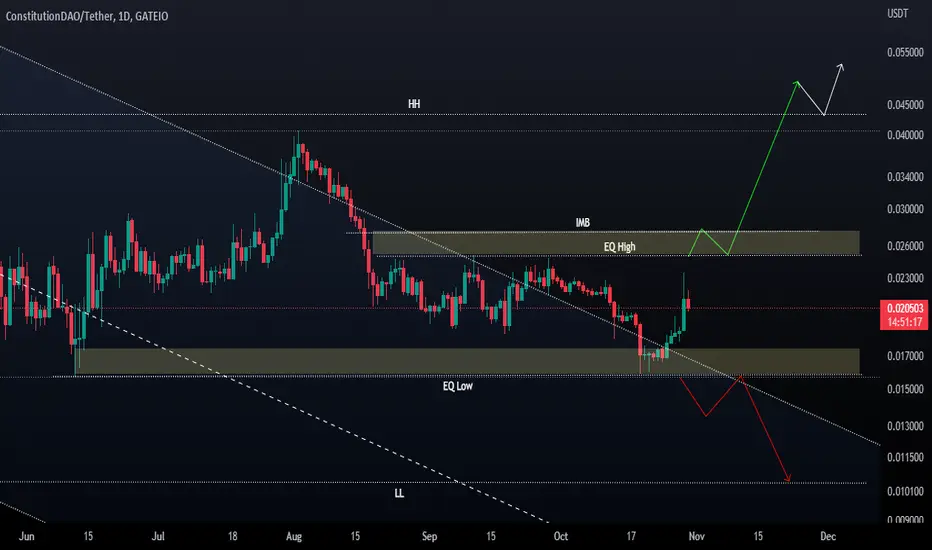
PEOPLEUSDT (ConstitutionDAO) Daily tf Range Updated till 5-11-22PEOPLEUSDT (ConstitutionDAO) Daily timeframe range. a decent chart with lots of price discovery option. if you zoomout the chart you can see there are not much of data to it. funny part is there not much of retail interest and volume into it too. so it may take time to cover those gaps. its a high risk and reward alt cause for volume its too easy to make it move.
People__Long SIGNALHello again 👋🏻
This is for future traders with low leverage
And for spot traders.
Follow the chart and set your position
Good luck ✌🏼✅
+33% PROFIT DONE AFTER BREAKOUT ✅SPOT TRADING
PEOPLE-USDT
BUY: 0.0178
SELL: 0.0238
PROFIT: 33% DONE ✅
Target hit successfully

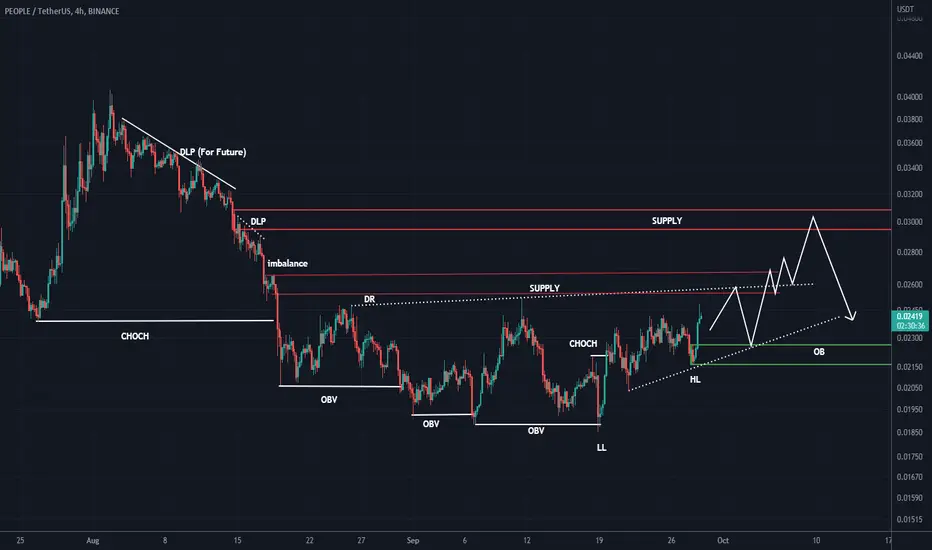
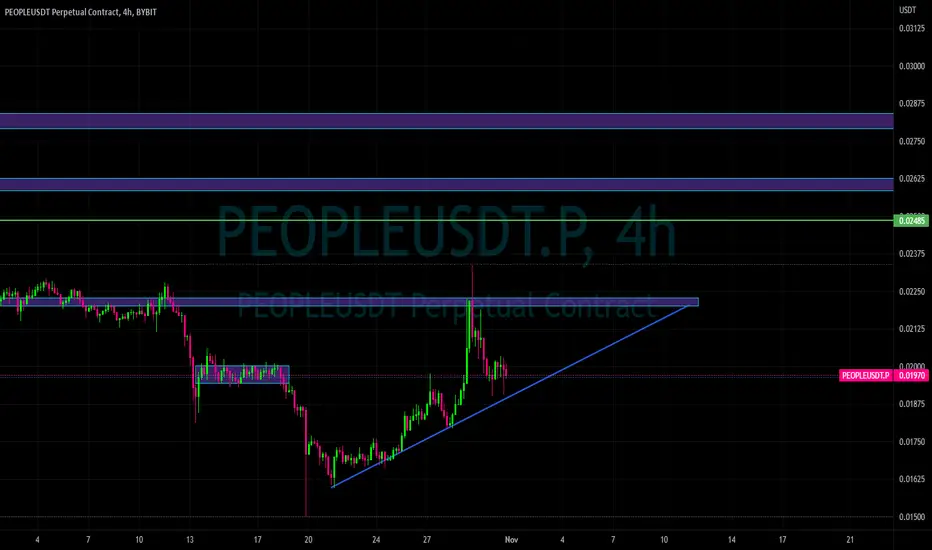
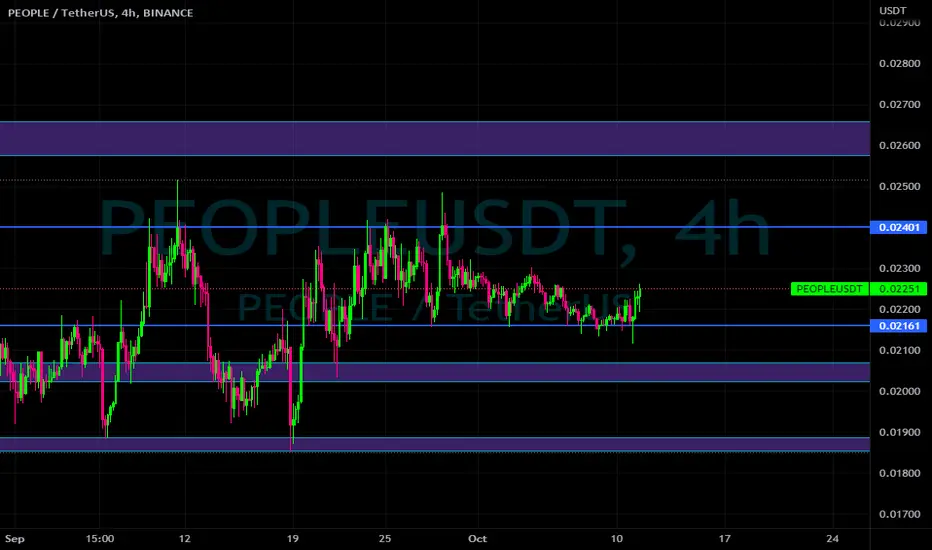
Possible ascending triangle PEOPLEUSDT 4hPossible ascending triangle PEOPLEUSDT 4h
If/when we breakout upwards some key take profit points are:
TP 1: 0.0248
TP 2: 0.026
TP 3: 0.028
Entry only at confirmed breakout!
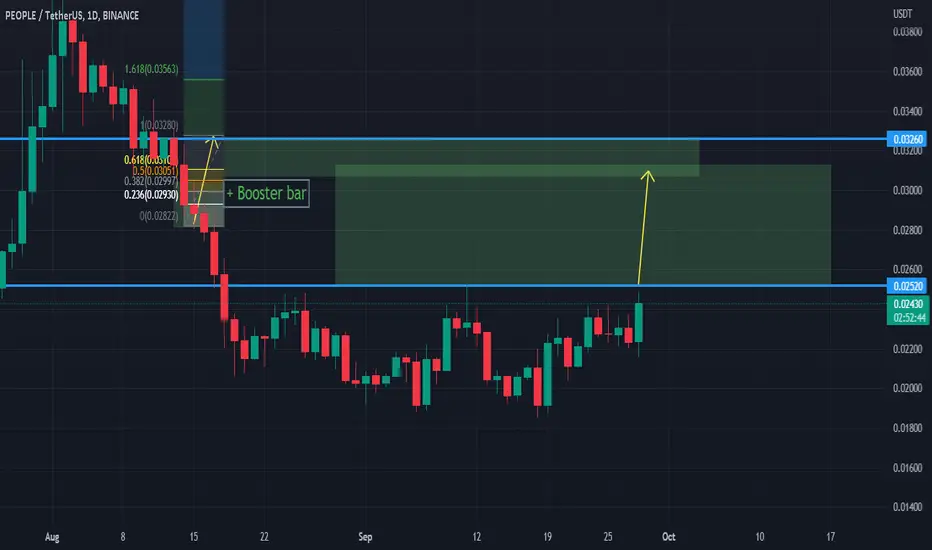
PEOPLE/USDTHello dear traders,
welcome back to another premium analysis.
i would like to share with you idea. this coin consolidating from long time & almost will explode soon as alt market will get stable.
entry & exit point clearly & simply draw on chat.
i always try to share simple chart with you. i hope you can understand easily.
have good day.
thanks.
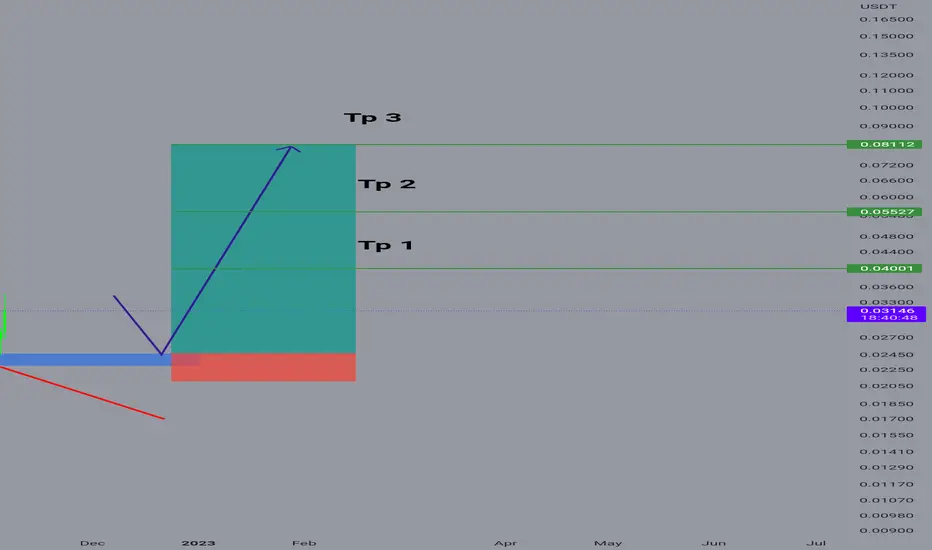
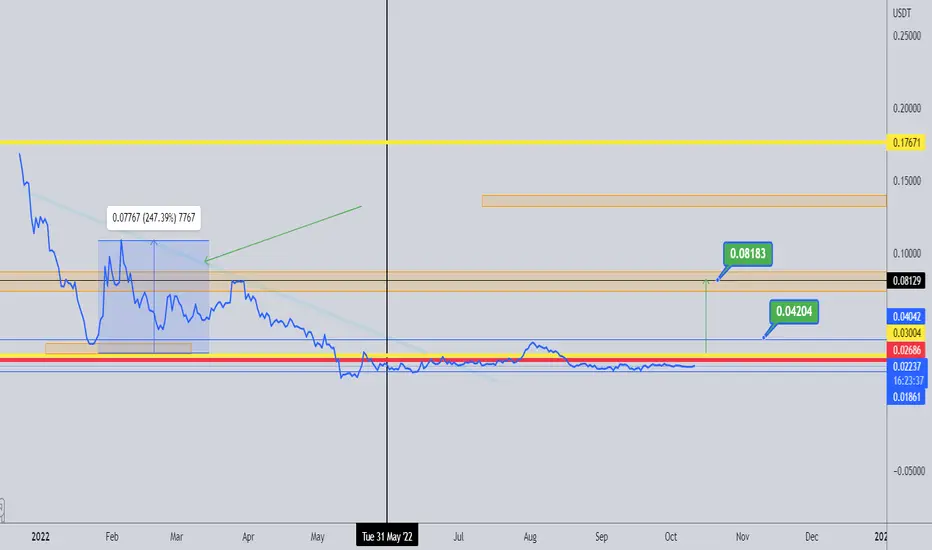
✅PEOPLE : BREAKOUT TREND ON HIGH TARGET✅People seem very interested in the low time frame and breakout.
High target 0,08 ( we have seen before breakouts of 200% on people) ( this can be long term target, so don't expect it will go in 1 day)
Before this targets are more low time frame targets as 0,03
This expectation is since expecting that BTC is also into a new increase cycle
most important manage the risk, this is crypto and it can be very hard.

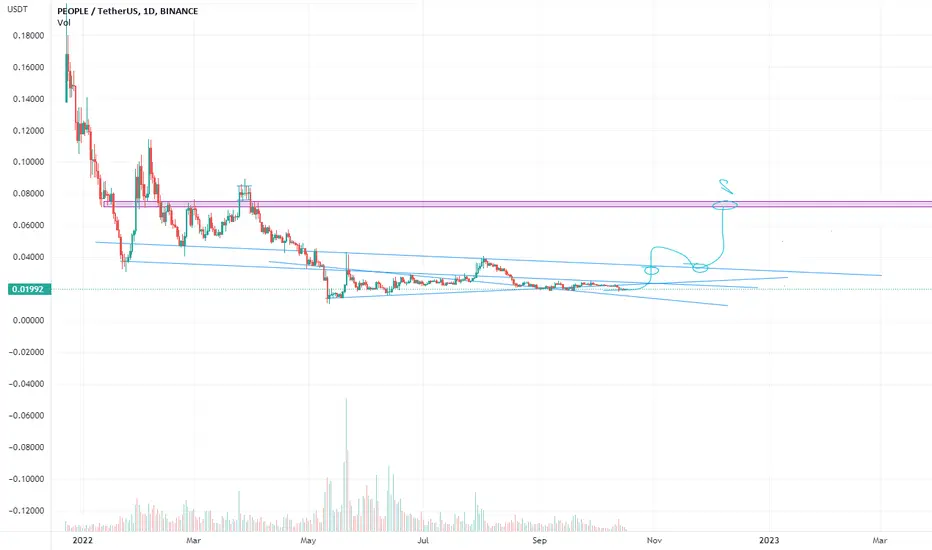
THE TIME BREAKOUT FOR PEOPLEPeople is one of the coins we follow for a time and waiting for the golden breakout on it.
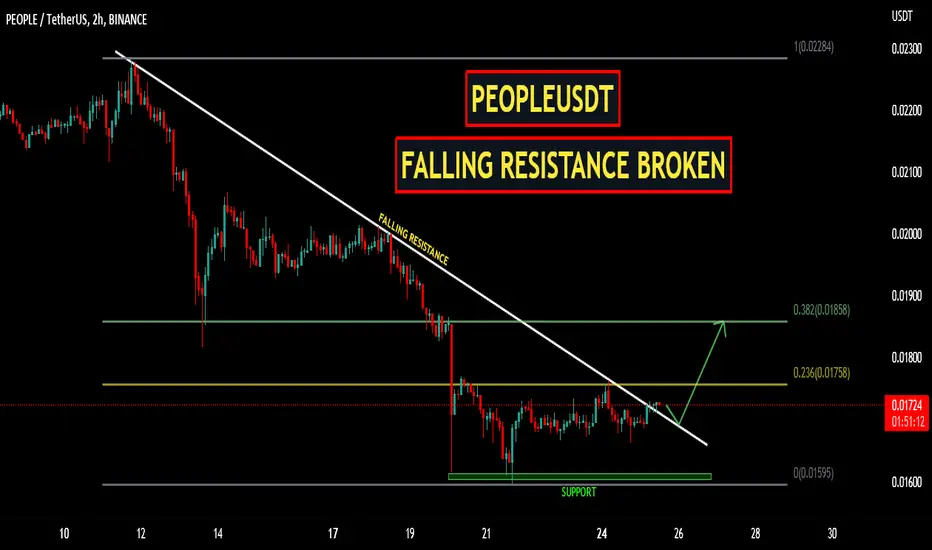
PEOPLEUSDT | FALLING RESISTANCE BROKENPEOPLEUSDT has been trading under the falling resistance. The price has recently broken above the resistance and currently trading at horizontal resistance. The bullish candles on breakout zone will confirm the bullish trend ahead.
Th bulls need to hold price above breakout zone.
Manage your trades accordingly
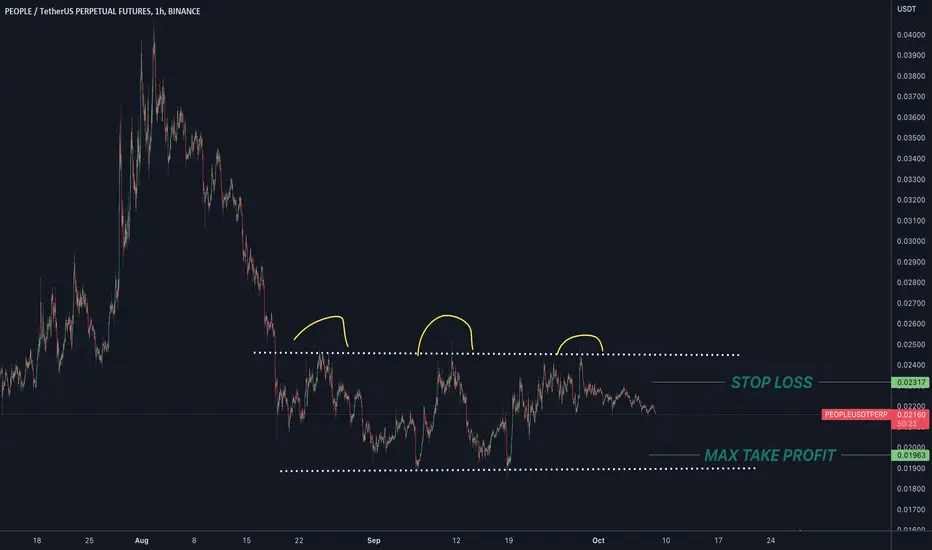
People USDT ShortsSaw a triple top. Decided to short.
Disclaimer:
This is not financial advice. TAYOR and DYOR
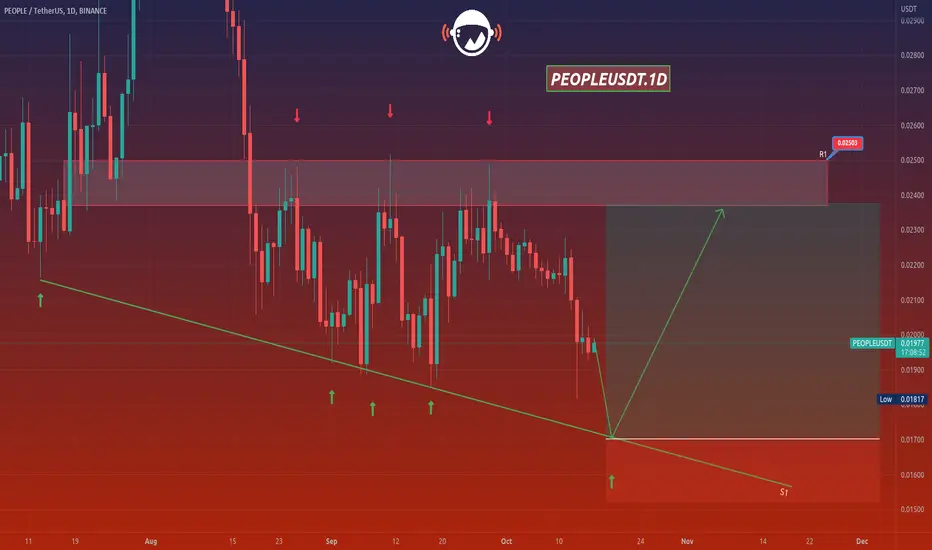
PEOPLEUSDTHello Crypto Lovers,
Mars Signals team wishes you high profits.
This is a one-day-time frame analysis for PEOPLEUSDT
Here we have R1 as a support area and S1 is our long-term support line which contains the support of price since the past. Thus, we have the price fluctuating over S1 area and our prediction would be a fall for it to reach the mentioned line, according to its past behavior. There we must wait for some rising signs and via them, we will expect an increase predicted for the price up to R1. By the rise of price above R1, and by its fixation over there, more rise is waiting for it. Also, it is not so probable for the price to move below S1 and have more decline at the present.
Warning: This is just a suggestion and we do not guarantee profits. We advise you to analyze the chart before opening any positions.
Wish you luck
PEOPLE/USDT 4h SHORT PLANEntry: 0.024
TP 1: $0.021 (50%)
TP 2: $0.02 (25%)
Tp 3: $0.018 (25%)
I advise you to wait for rejection! I also move SL BE around $0.022!
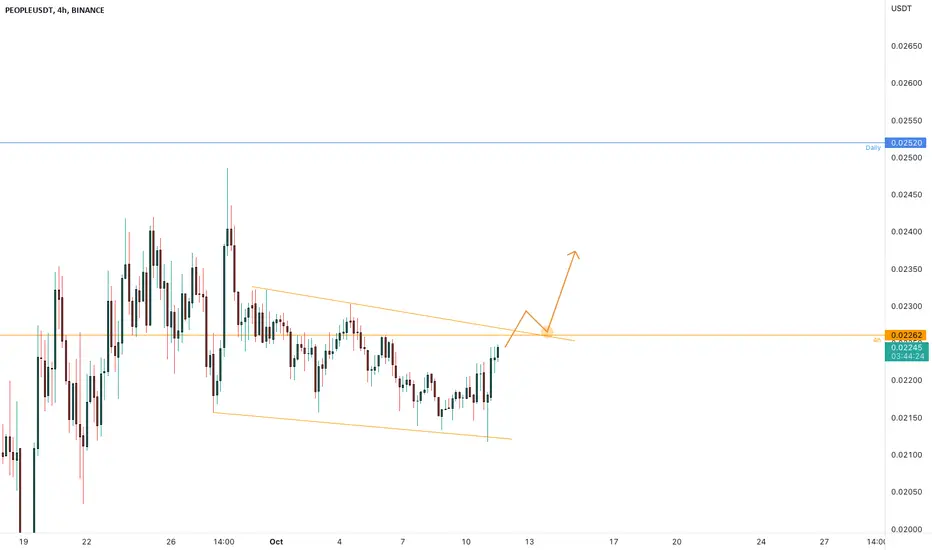
PEOPLEUSDT is creating the descending channelThe price is testing the 4h resistance at 0.0226 area where the market is creating a descending channel.
The price got liquidity from the lower trendline.
How to approach it?
IF AND ONLY IF the price is going to have a breakout from the channel and retest the resistance as new support, According to Plancton's strategy , we can set a nice order
–––––
Keep in mind.
🟣 Purple structure -> Monthly structure.
🔴 Red structure -> Weekly structure.
🔵 Blue structure -> Daily structure.
🟡 Yellow structure -> 4h structure.
⚫️ black structure -> <= 1h structure.
–––––
Follow the Shrimp 🦐
PEOPLEUSDT broadening pattern in ActionThe price is testing the daily resistance inside a broadening pattern.
At the moment the price is testing the 0.5 Fibonacci level on the Daily timeframe.
How to approach it?
IF the price is going to have a clear breakout and retest the resistance as new support, According to Plancton's strategy , we can set a nice order
–––––
Keep in mind.
🟣 Purple structure -> Monthly structure.
🔴 Red structure -> Weekly structure.
🔵 Blue structure -> Daily structure.
🟡 Yellow structure -> 4h structure.
⚫️ black structure -> <= 1h structure.
–––––
Follow the Shrimp 🦐

people It may surprise everyoneThis symbol can continue to move upwards and fluctuate like this. Follow capital management and stop because the market is volatile