You all Panic and Sell While Whales Buy Ever sold at the exact bottom, just before the bounce?
Mass fear always becomes the perfect entry for whales, while regular traders are running away.
In this post, I’ll break down how their mindset beats ours, and how to flip the script on your own fear.
Hello✌
Spend 3 minutes ⏰ reading this educa
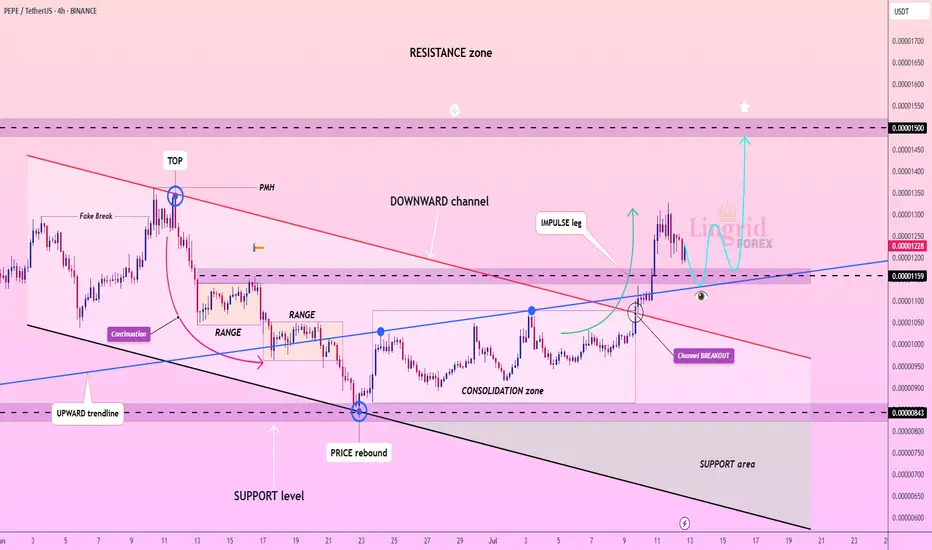
Lingrid | PEPEUSDT Corrective Channel BreakoutThe price perfectly fulfilled my previous idea . BINANCE:PEPEUSDT rebounded powerfully from the 0.00000843 support and broke out of the long-standing downward channel, marking the start of a bullish impulse leg. Price is now holding above the breakout point and consolidating above the 0.00001159
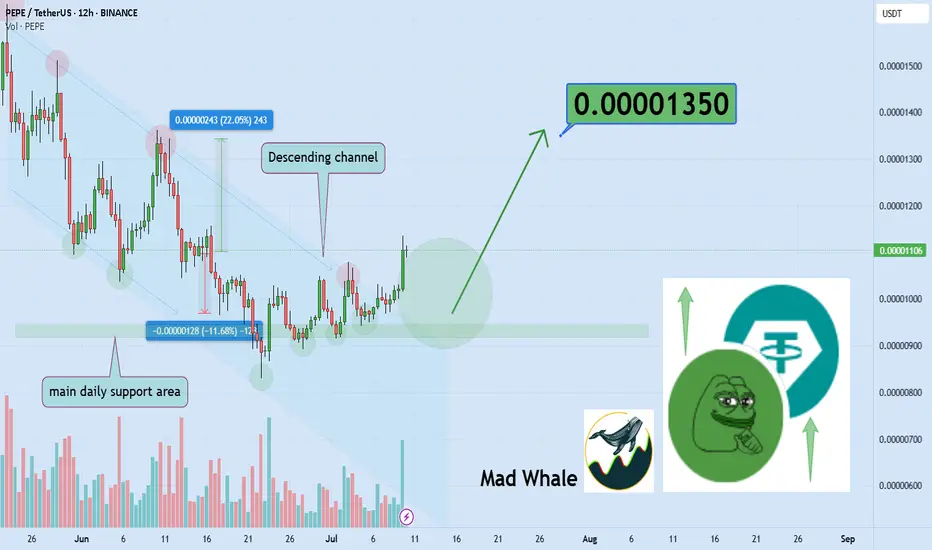
Is Pepe growing? Read the caption, it's important.Hello friends🙌
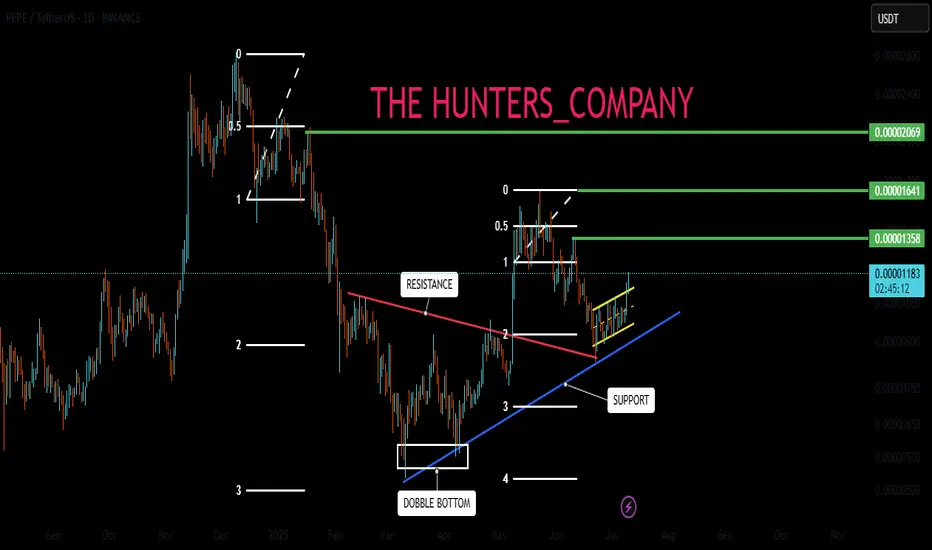
✔Some factors caused the price to fall, but in a support area that we have drawn for you with several Fibonacci waves, you can see that a classic double bottom pattern has been formed and buyers have entered.
🔊Now there is no more news of a fall and buyers have raised the price to t
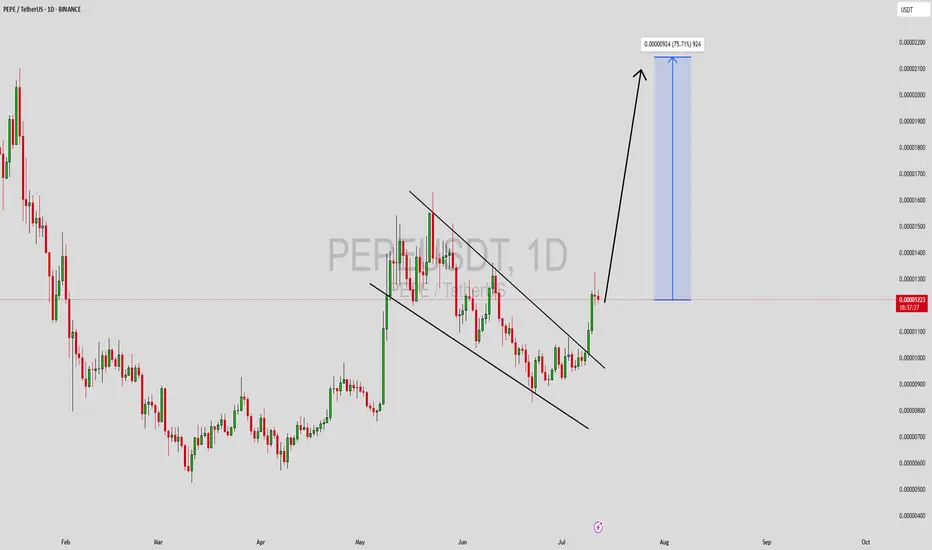
PEPEUSDT Forming Falling ChannelPEPEUSDT is showing promising signs of a potential breakout, supported by a clear price structure that resembles a falling channel pattern. This technical setup is widely known among traders for indicating a possible trend reversal when the price successfully breaches the channel’s upper resistance
PEPE Faces Key Resistances – Is a -8% Pullback Coming?The PEPE memecoin ( BINANCE:PEPEUSDT ) is currently near the Resistance zone($0.00001392-$0.00001330) and Important Resistance lines . This is the third time that PEPE has attacked the Important Resistance lines .
In terms of Elliott wave theory , it seems that PEPE is completing the micro

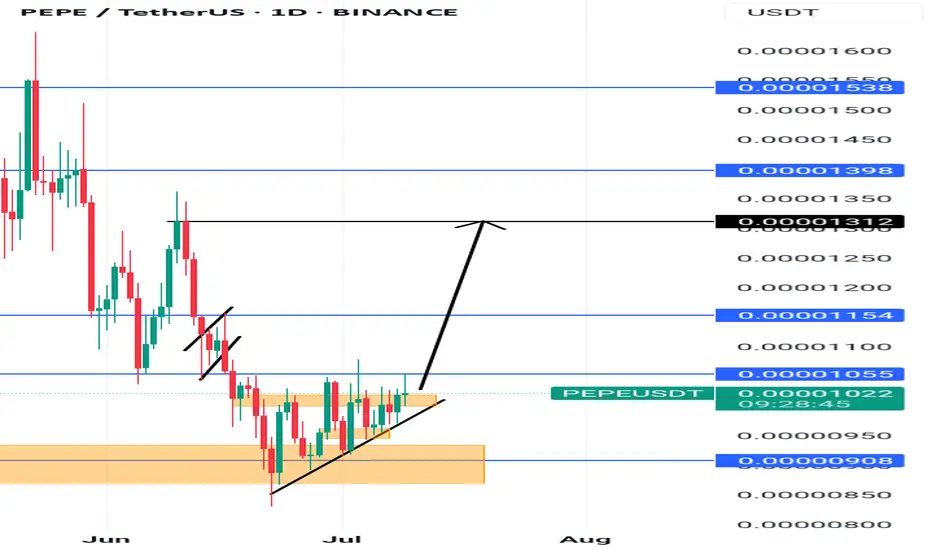
W formation Pepe has shifted and invalidated the bearish structure that would have served us a wonderful sell opportunity.
There is a retest, at a support level,once the current candle closes,the movement continues upward all the way to 0.00001312.
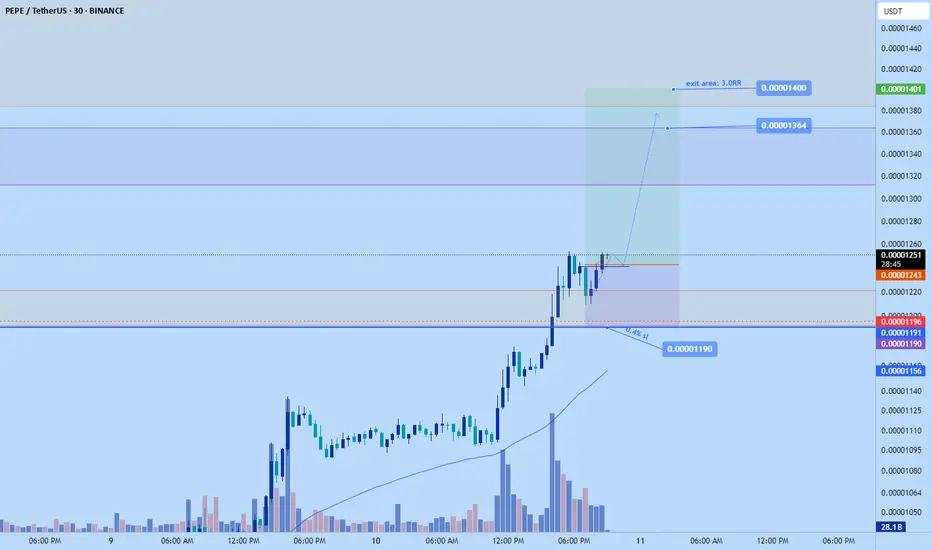
PEPE long to $0.000014Just opened a long position on pepe. Aiming for 0.000014
Stop: $0.00001190
Roughly 3RR
Pepe seems to be itching to breakout and continue pumping based on my DTT analysis. Its high on higher tf though the momentum is strong
Time sensitive
PEPEUSDT Critical Decision Zone – Massive Move Incoming?🧠 Macro Technical Analysis
PEPEUSDT is currently hovering within a critical demand zone (0.00000095 – 0.00000110), an area that has historically acted as a strong accumulation base and a launchpad for previous rallies. The chart structure shows multiple interactions with this zone, highlighting its
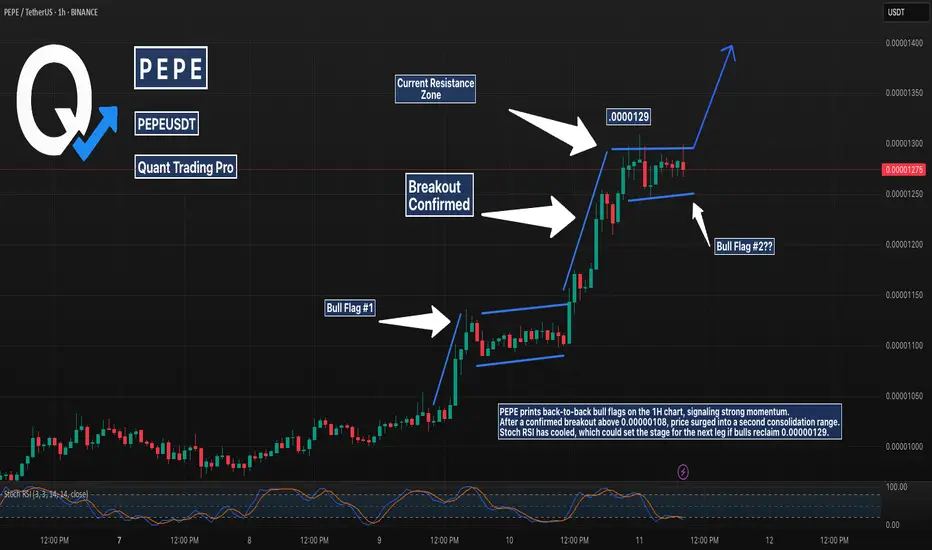
PEPE Breakout Sequence – Double Flag Pattern Forming?PEPE continues its breakout sequence on the 1H chart, forming a classic bull flag followed by another possible setup in real time. The first breakout above 0.00000108 triggered strong follow-through. Now, a second flag is forming just under 0.00000130. With Stoch RSI cooling down, this could be the
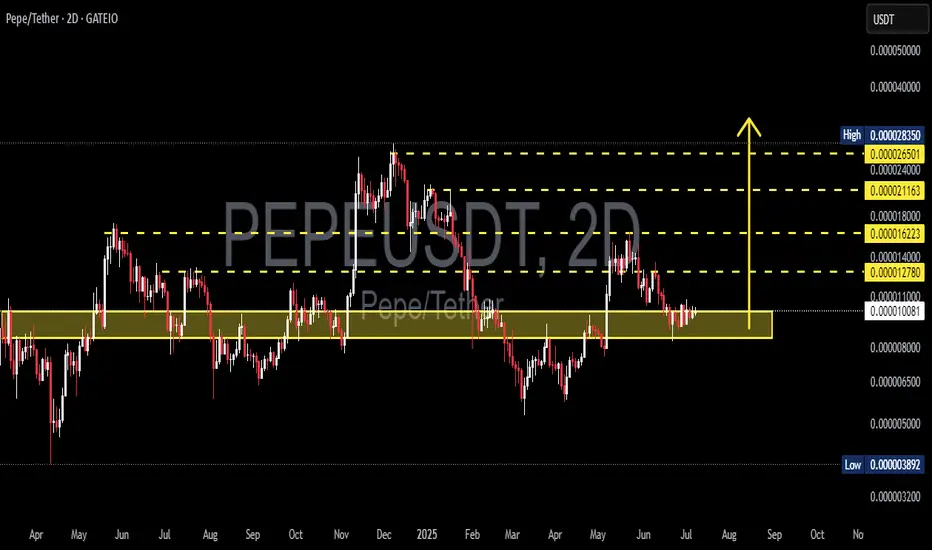
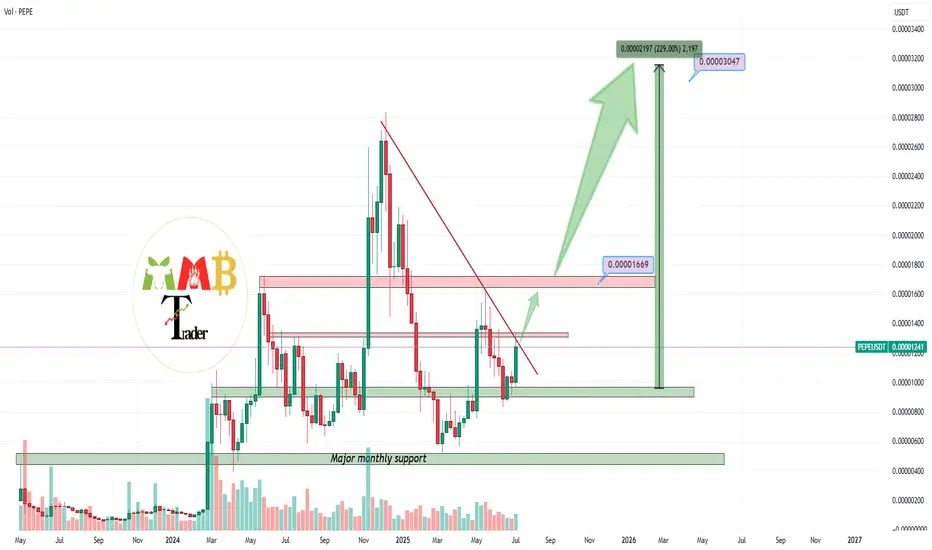
PEPEUSDT high potential pump is cooking As we can see price is near major resistance of 0.000013$ and any breakout here to the upside is going to pump price hard to the targets like 0.000040$.
Two major resistance here is now same which are 0.000013$ which is weekly resistance zone + red trendline resistance also now is here so after b
See all ideas
Summarizing what the indicators are suggesting.
Oscillators
Neutral
SellBuy
Strong sellStrong buy
Strong sellSellNeutralBuyStrong buy
Oscillators
Neutral
SellBuy
Strong sellStrong buy
Strong sellSellNeutralBuyStrong buy
Summary
Neutral
SellBuy
Strong sellStrong buy
Strong sellSellNeutralBuyStrong buy
Summary
Neutral
SellBuy
Strong sellStrong buy
Strong sellSellNeutralBuyStrong buy
Summary
Neutral
SellBuy
Strong sellStrong buy
Strong sellSellNeutralBuyStrong buy
Moving Averages
Neutral
SellBuy
Strong sellStrong buy
Strong sellSellNeutralBuyStrong buy
Moving Averages
Neutral
SellBuy
Strong sellStrong buy
Strong sellSellNeutralBuyStrong buy
Displays a symbol's price movements over previous years to identify recurring trends.