PEPEUSDT: Bearish Outlook After Internal Trendline BreakHello guys.
PEPE has tested the internal trendline multiple times and finally broke below it, signaling potential weakness. Price also failed to reclaim the key supply zone above.
Internal trendline broken
Rejection from a key supply zone
Potential move toward the demand zone around 0.0000026
Related pairs

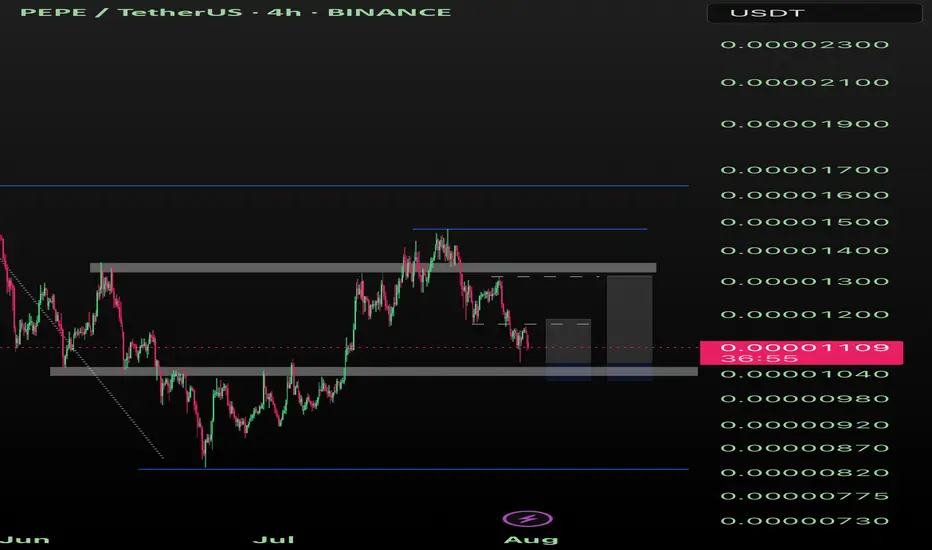
Pepe 10% or 25% Pepe could see a 10% - 25% pump after one more sweep to 1040 or even a hold for the week over 1040, for a trade.
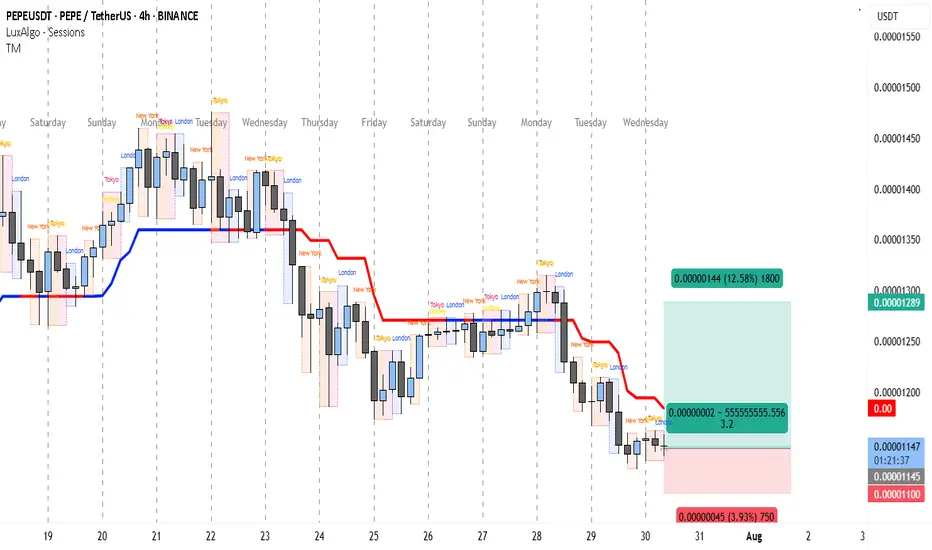
High R:R Play on PEPE — 3.2X Reward WaitingThe PEPEUSDT 4H chart clearly shows that the market has been in a downtrend since late July, forming consistent lower highs and lower lows. The trend indicator lines (red above price, blue below) suggest that bearish momentum has been dominant for several sessions.
From July 28 onwards, price tested
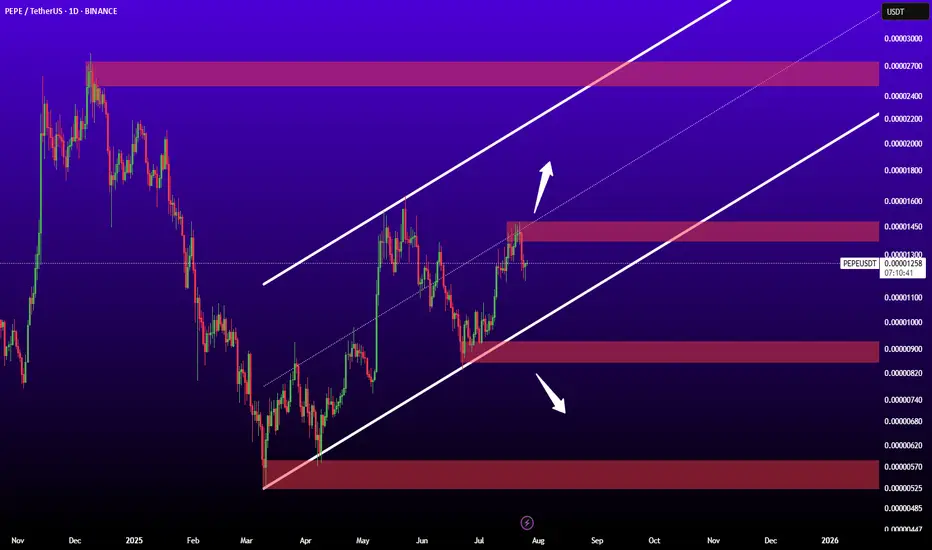
PEPEUSDTIf reaked midlle trend channel may ready for jump to nest levels.
Key levels:
0.00002700
0.0000145
0.00000900
0.00000570
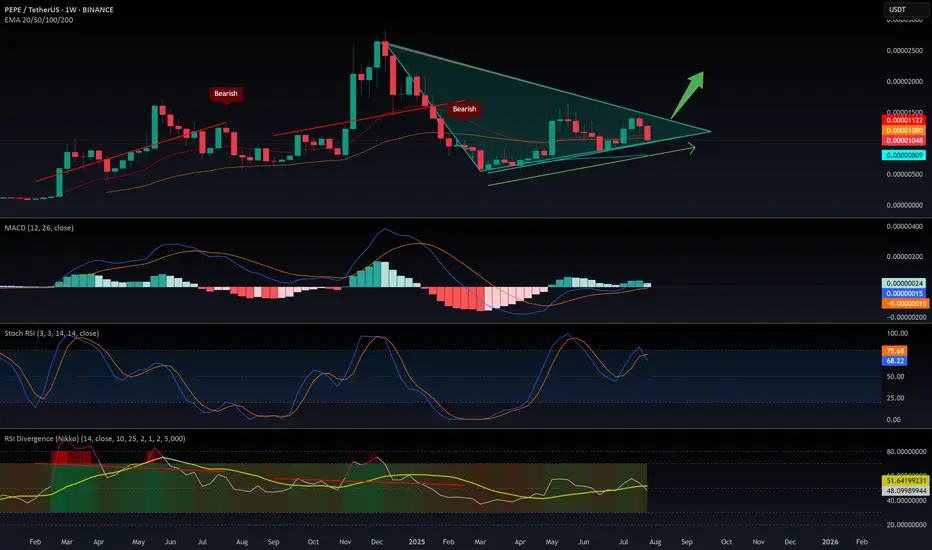
$PEPE: the big picture, 1W analysis.August 1st, 2025 – A tough day for altcoins, hit once again by tariff concerns.
But let’s talk about CRYPTOCAP:PEPE , one of my favorite altcoins to track. Why? No VC backing, the entire supply is community-held, and volume is consistently strong—making it a reliable market sentiment indicator.
W
PEPE on the verge of breakout!PEPE / USDT
Price is trying to breakout massive downtrend line since 7 months
Incase of breakout we will see strong bullish momentum
Keep an eye on it
PEPEUSDT – Downtrend Breakout & Golden Zone Retest in Play!📊 Chart Analysis:
On this daily timeframe chart of PEPEUSDT, price has successfully broken above the descending trendline that had capped the price since late 2024. This breakout is a strong early signal that bearish momentum is weakening and a potential trend reversal may be underway.
After the b

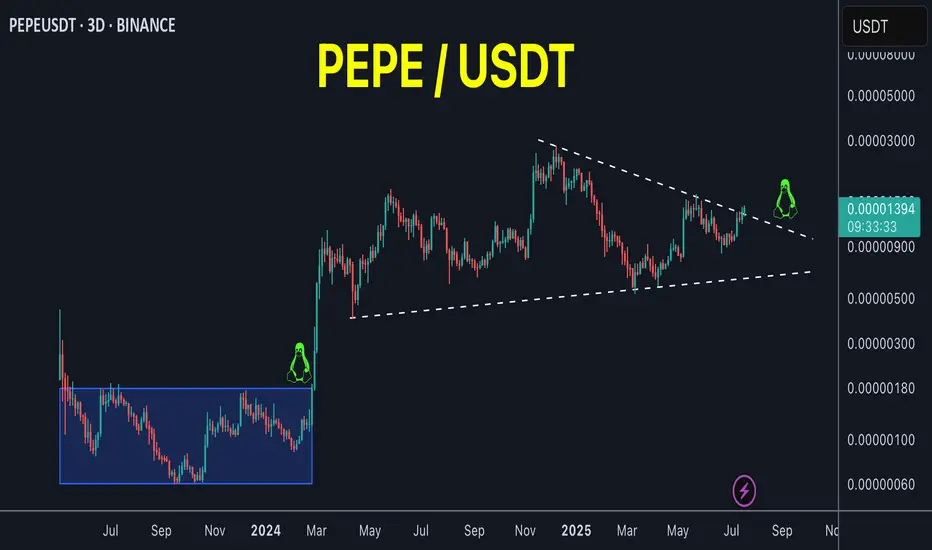
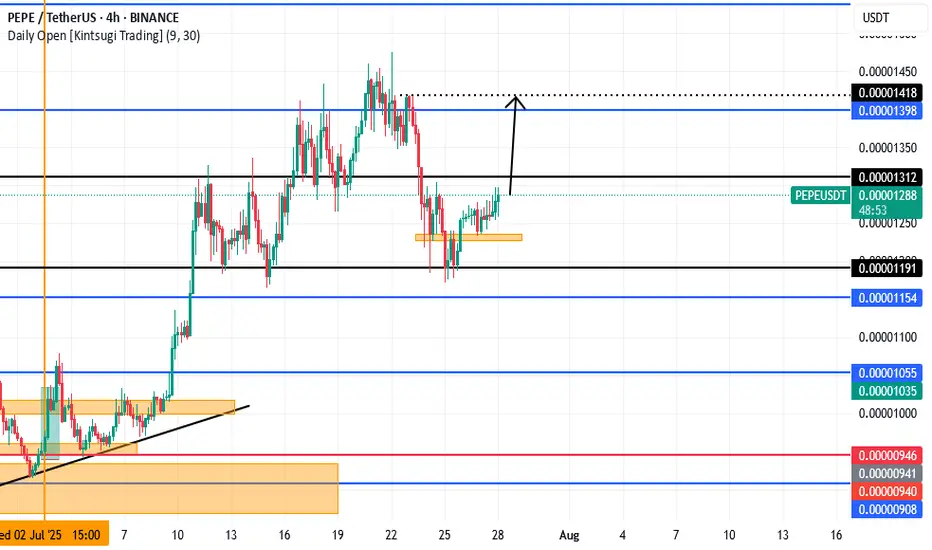
Bull PositionPepe has formed an (IH&S) pattern and the entry point would be now and then you hold up-to the potential take profit level of 0.00001418
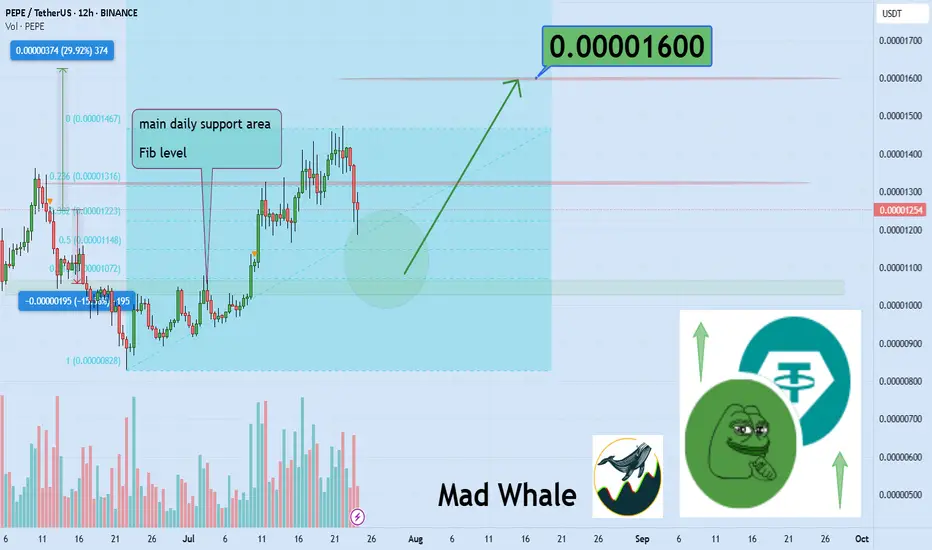
Bounce or Breakdown? PEPE Eyes 0.000016 Target!38% BounceHello✌
Let’s analyze PEPE memecoin’s upcoming price potential 📈.
BINANCE:PEPEUSDT is approaching a key daily support level, which also aligns with the 0.61 Fibonacci retracement. If this level holds, a potential bounce toward the 0.000016 area could offer around 38% upside. 📈🟢
✨We put lov
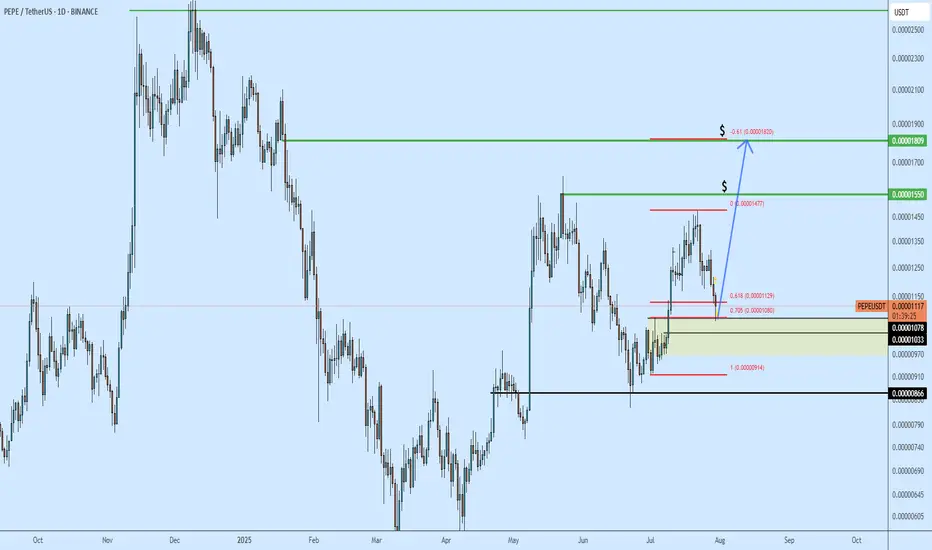
PEPE Uptrend continuation?PEPE has been trending higher over the last few weeks. Today it hit the fib level - seems to be getting a reaction. PEPE is a good hold for upside targets labeled ($).
I would keep thi bias unless we start invalidating (closing-below) 0.00000918
See all ideas
Summarizing what the indicators are suggesting.
Oscillators
Neutral
SellBuy
Strong sellStrong buy
Strong sellSellNeutralBuyStrong buy
Oscillators
Neutral
SellBuy
Strong sellStrong buy
Strong sellSellNeutralBuyStrong buy
Summary
Neutral
SellBuy
Strong sellStrong buy
Strong sellSellNeutralBuyStrong buy
Summary
Neutral
SellBuy
Strong sellStrong buy
Strong sellSellNeutralBuyStrong buy
Summary
Neutral
SellBuy
Strong sellStrong buy
Strong sellSellNeutralBuyStrong buy
Moving Averages
Neutral
SellBuy
Strong sellStrong buy
Strong sellSellNeutralBuyStrong buy
Moving Averages
Neutral
SellBuy
Strong sellStrong buy
Strong sellSellNeutralBuyStrong buy
Displays a symbol's price movements over previous years to identify recurring trends.
Frequently Asked Questions
The current price of PEPE / Tether USD (PEPE) is 0.000010211195 USDT — it has fallen −1.15% in the past 24 hours. Try placing this info into the context by checking out what coins are also gaining and losing at the moment and seeing PEPE price chart.
PEPE / Tether USD price has fallen by −12.02% over the last week, its month performance shows a 8.52% increase, and as for the last year, PEPE / Tether USD has increased by 0.50%. See more dynamics on PEPE price chart.
Keep track of coins' changes with our Crypto Coins Heatmap.
Keep track of coins' changes with our Crypto Coins Heatmap.
PEPE / Tether USD (PEPE) reached its highest price on Dec 10, 2024 — it amounted to 0.000028368778 USDT. Find more insights on the PEPE price chart.
See the list of crypto gainers and choose what best fits your strategy.
See the list of crypto gainers and choose what best fits your strategy.
PEPE / Tether USD (PEPE) reached the lowest price of 0.000000020000 USDT on Apr 19, 2023. View more PEPE / Tether USD dynamics on the price chart.
See the list of crypto losers to find unexpected opportunities.
See the list of crypto losers to find unexpected opportunities.
The safest choice when buying PEPE is to go to a well-known crypto exchange. Some of the popular names are Binance, Coinbase, Kraken. But you'll have to find a reliable broker and create an account first. You can trade PEPE right from TradingView charts — just choose a broker and connect to your account.
Crypto markets are famous for their volatility, so one should study all the available stats before adding crypto assets to their portfolio. Very often it's technical analysis that comes in handy. We prepared technical ratings for PEPE / Tether USD (PEPE): today its technical analysis shows the sell signal, and according to the 1 week rating PEPE shows the sell signal. And you'd better dig deeper and study 1 month rating too — it's sell. Find inspiration in PEPE / Tether USD trading ideas and keep track of what's moving crypto markets with our crypto news feed.
PEPE / Tether USD (PEPE) is just as reliable as any other crypto asset — this corner of the world market is highly volatile. Today, for instance, PEPE / Tether USD is estimated as 7.21% volatile. The only thing it means is that you must prepare and examine all available information before making a decision. And if you're not sure about PEPE / Tether USD, you can find more inspiration in our curated watchlists.
You can discuss PEPE / Tether USD (PEPE) with other users in our public chats, Minds or in the comments to Ideas.