PEPEUSDT: Bearish Outlook After Internal Trendline BreakHello guys.
PEPE has tested the internal trendline multiple times and finally broke below it, signaling potential weakness. Price also failed to reclaim the key supply zone above.
Internal trendline broken
Rejection from a key supply zone
Potential move toward the demand zone around 0.00000262–0.00000365
Unless bulls reclaim the broken trendline and break above the recent highs, the bias remains bearish with a possible continuation to the downside.
PEPEUSDT trade ideas

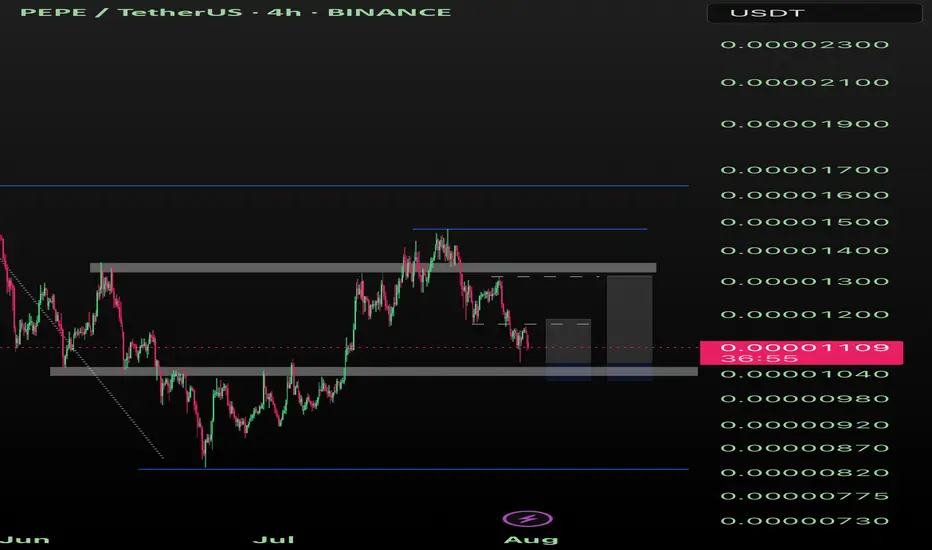
Pepe 10% or 25% Pepe could see a 10% - 25% pump after one more sweep to 1040 or even a hold for the week over 1040, for a trade.
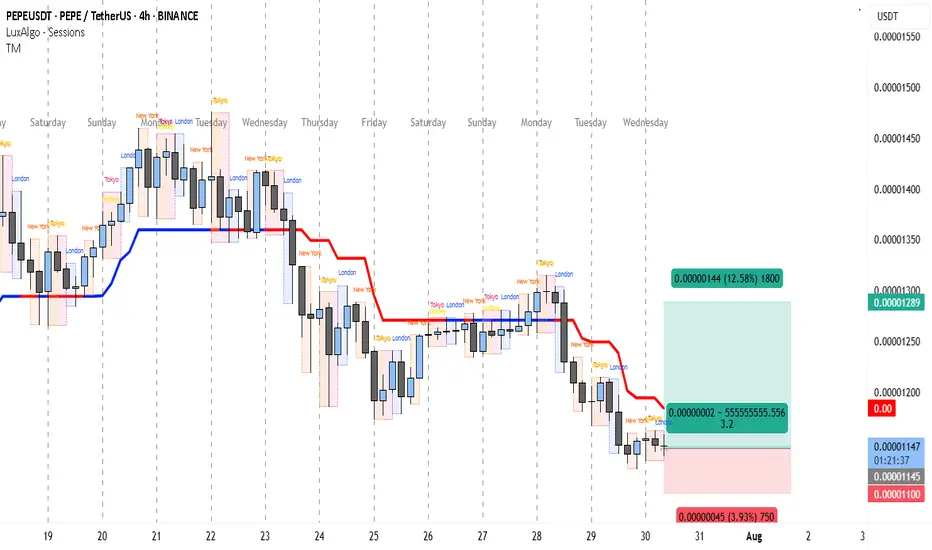
High R:R Play on PEPE — 3.2X Reward WaitingThe PEPEUSDT 4H chart clearly shows that the market has been in a downtrend since late July, forming consistent lower highs and lower lows. The trend indicator lines (red above price, blue below) suggest that bearish momentum has been dominant for several sessions.
From July 28 onwards, price tested the short-term moving average multiple times but failed to break above it, confirming that sellers remain in control. However, over the past few candles, we can see that price has started to slow its decline and is now consolidating near the 0.00001145 support zone. This is an area where buyers have previously stepped in, making it a potential pivot point for a short-term bounce.
The marked trade idea on the chart suggests a countertrend long trade. This makes sense because the market is oversold on lower timeframes and showing signs of accumulation. The upside target is set just below a prior reaction level at 0.00001289, which has historically acted as resistance. This creates an opportunity for a clean bounce if buying pressure increases.
Trade Setup
• Entry: 0.00001145 (at current support)
• Stop Loss: 0.00001100 (below recent swing low)
• Take Profit: 0.00001289 (targeting prior resistance)
• Risk-to-Reward Ratio: ~1:3.2
• Trade Bias: Short-term countertrend long
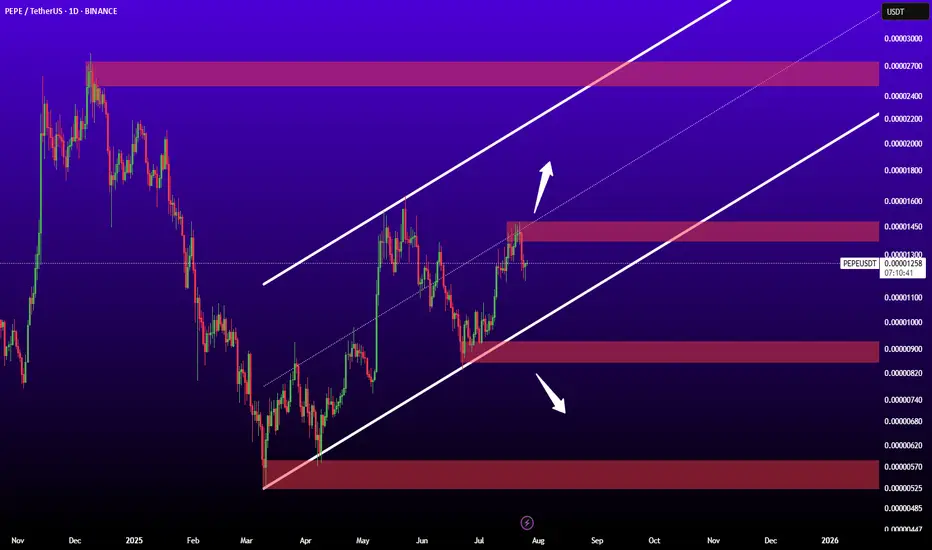
PEPEUSDTIf reaked midlle trend channel may ready for jump to nest levels.
Key levels:
0.00002700
0.0000145
0.00000900
0.00000570
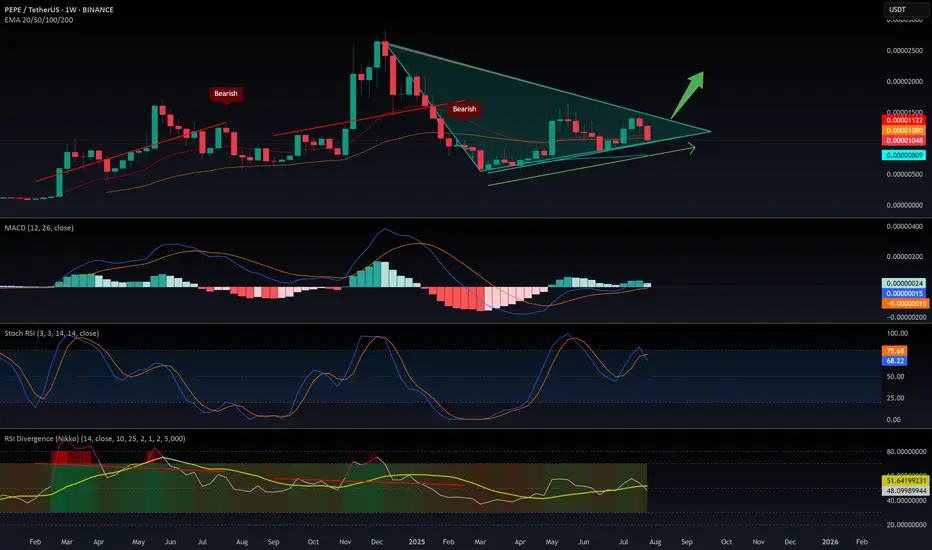
$PEPE: the big picture, 1W analysis.August 1st, 2025 – A tough day for altcoins, hit once again by tariff concerns.
But let’s talk about CRYPTOCAP:PEPE , one of my favorite altcoins to track. Why? No VC backing, the entire supply is community-held, and volume is consistently strong—making it a reliable market sentiment indicator.
Weekly Outlook:
CRYPTOCAP:PEPE remains in a macro uptrend, riding above the 100 EMA.
- My Momentum indicator has triggered two buy signals: at 0.00000634 and 0.00001040
- RSI is rising but still mid-range—there’s plenty of room to move higher.
- MACD is gradually ramping up.
- Stochastic RSI is cooling off, but given the strength of the other signals, further downside looks limited.
Technically, we’re seeing a bullish flag pattern. Price is currently testing support at the lower range—likely setting the stage for a decisive move in the coming weeks.
Conclusion:
Based on the current indicators and structure, the odds favor a bullish breakout and continuation of the uptrend—though, as always, DYOR.
PEPE on the verge of breakout!PEPE / USDT
Price is trying to breakout massive downtrend line since 7 months
Incase of breakout we will see strong bullish momentum
Keep an eye on it
PEPEUSDT – Downtrend Breakout & Golden Zone Retest in Play!📊 Chart Analysis:
On this daily timeframe chart of PEPEUSDT, price has successfully broken above the descending trendline that had capped the price since late 2024. This breakout is a strong early signal that bearish momentum is weakening and a potential trend reversal may be underway.
After the breakout, the price is now performing a retest at a key confluence support zone, including:
Fibonacci Retracement levels 0.5 (0.000011580) and 0.618 (0.000010835) — the Golden Zone
Previous horizontal demand zone (highlighted in yellow)
Retest of the broken descending trendline
This retest area will be crucial for determining the next directional move.
---
🐂 Bullish Scenario:
If price holds above the Fibonacci Golden Zone and forms a bullish confirmation candle, we could see a continuation of the uptrend toward:
0.000014191
0.000015000
0.000016836
0.000021533 (medium-term target)
Possibly retesting the High at 0.000028364
This would confirm the start of a major trend reversal and renewed bullish momentum.
---
🐻 Bearish Scenario:
If price fails to hold above the 0.000010835 level and breaks down below the Golden Zone:
Expect a drop toward psychological support around 0.000010000
And potentially further down to the strong support near 0.000007000
Such a move would invalidate the breakout and put PEPE back into a consolidation or extended downtrend phase.
---
🧠 Chart Pattern Notes:
Descending Trendline Breakout
Golden Zone Retest (Fibonacci 0.5 & 0.618)
Potential formation of an Inverted Head & Shoulders pattern (in early stages)
---
🎯 Conclusion:
PEPEUSDT is at a critical turning point after breaking out of a long-term downtrend. If the support at the Golden Zone holds, there is strong potential for a sustained bullish rally. However, traders should remain cautious and apply proper risk management in case of a breakdown below key levels.
#PEPEUSDT #CryptoBreakout #GoldenZoneRetest #TechnicalAnalysis #FibonacciLevels #PEPECoin #AltcoinAnalysis #TrendReversal #BullishSetup #BearishRisk

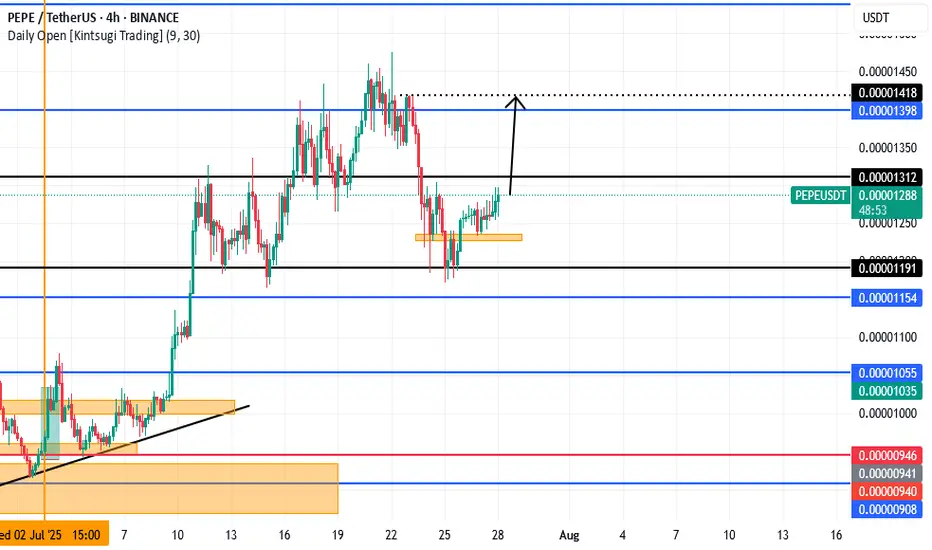
Bull PositionPepe has formed an (IH&S) pattern and the entry point would be now and then you hold up-to the potential take profit level of 0.00001418
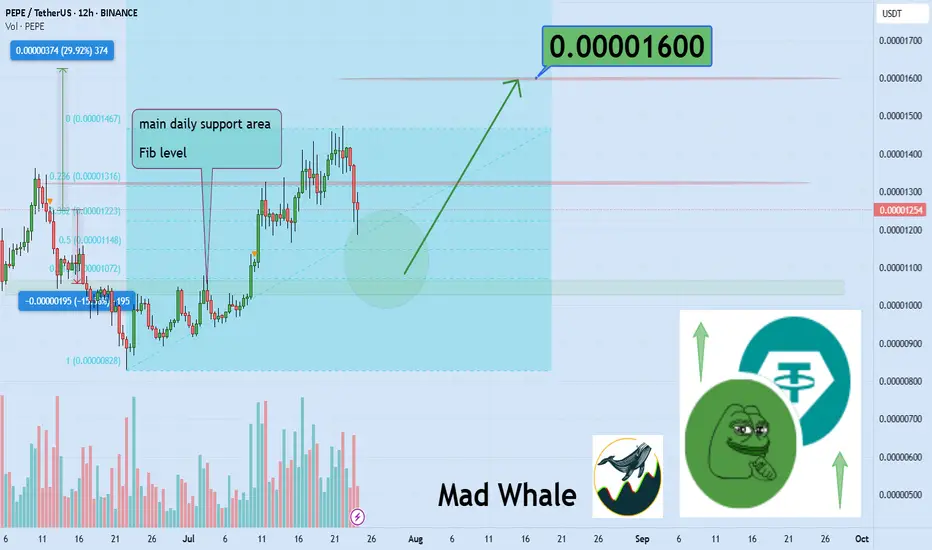
Bounce or Breakdown? PEPE Eyes 0.000016 Target!38% BounceHello✌
Let’s analyze PEPE memecoin’s upcoming price potential 📈.
BINANCE:PEPEUSDT is approaching a key daily support level, which also aligns with the 0.61 Fibonacci retracement. If this level holds, a potential bounce toward the 0.000016 area could offer around 38% upside. 📈🟢
✨We put love into every post!
Your support inspires us 💛 Drop a comment we’d love to hear from you! Thanks , Mad Whale
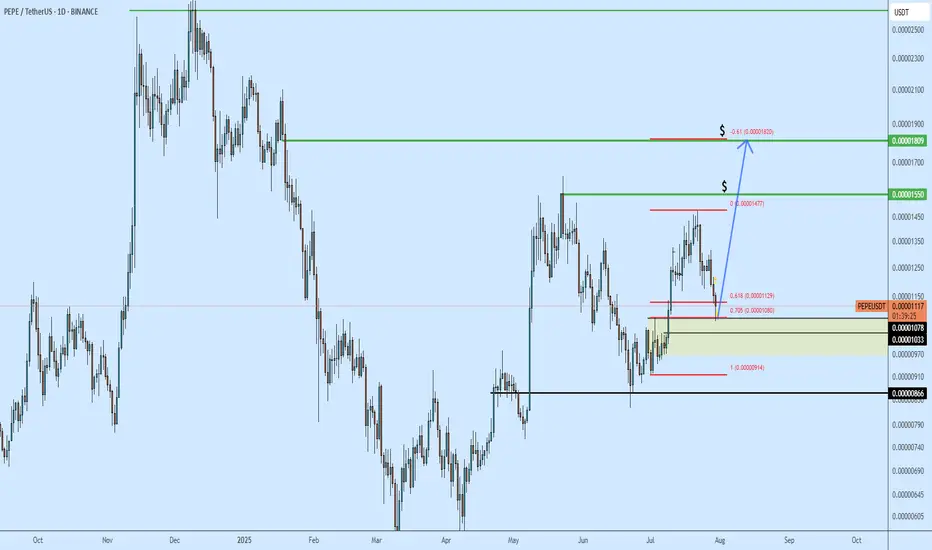
PEPE Uptrend continuation?PEPE has been trending higher over the last few weeks. Today it hit the fib level - seems to be getting a reaction. PEPE is a good hold for upside targets labeled ($).
I would keep thi bias unless we start invalidating (closing-below) 0.00000918
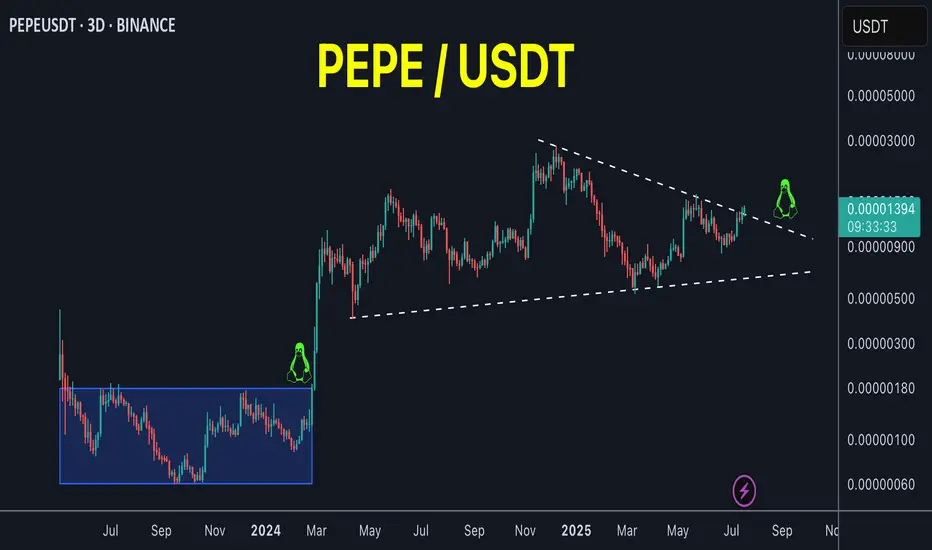
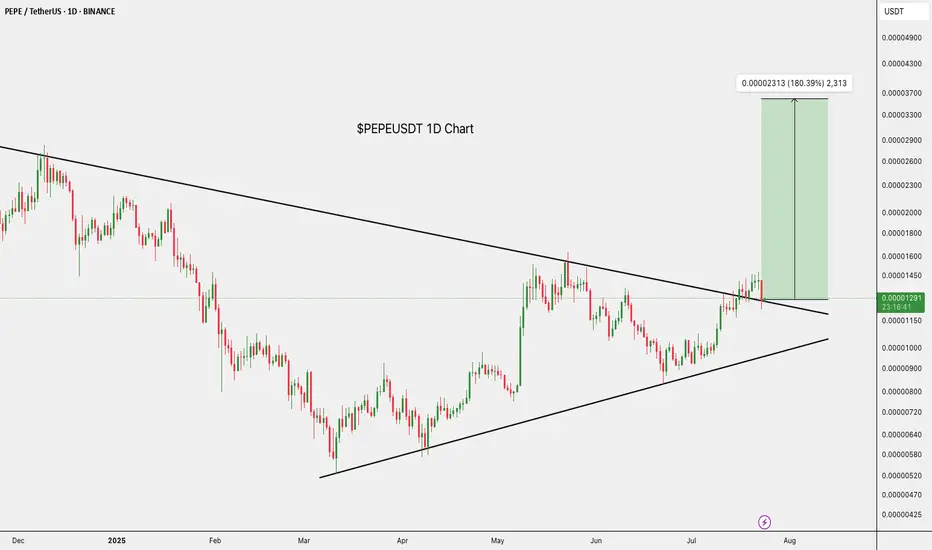
$PEPEUSDT Breakout: 180% Ahead?CRYPTOCAP:PEPE just broke out of a long-term triangle.
If the move holds, it could pump up to 0.00002313, that’s a potential 180% gain.
Watch for a retest before making a decision.
DYOR, NFA
PEPE – Highest Weekly Close in 6 Months: Eyes on New HighsMajor Breakout Level:
Last week’s candle closed above the 1W S/R (~0.000013845), marking the highest weekly close in half a year.
Bullish Structure:
Price reclaimed and closed above a crucial weekly resistance. This flips the structure bullish, increasing odds of continuation.
Next Targets:
Immediate resistance lies near the 1M S/R (around 0.000020193–0.000020272). Break and close above opens way toward the 1.27–1.618 Fib extensions (0.000029793+).
Invalidation:
Failure to hold above the 1W S/R and a weekly close back below (~0.000013845) would invalidate the breakout, putting risk back toward mid-range support (0.000009697).
The weekly close above key resistance signals strong buyer interest and market acceptance of higher prices, especially after a multi-month consolidation. This “highest close in 6 months” is a classic trend continuation setup. The next natural target is the higher time frame resistance (1M S/R), with Fibs aligning to previous price action. Failure to hold the breakout level would suggest a failed move and likely mean-reversion.

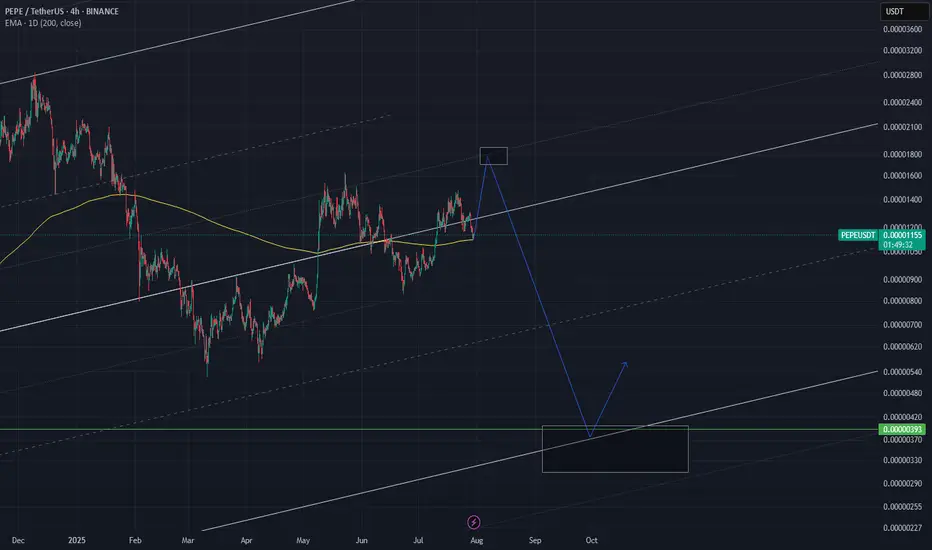
Get Ready to Sell...I'm expecting another swing high (probably by FOMC upcoming statement) just before a an almost 80% drop!
Get ready to sell your PEPE and other crypto before the huge drop.
YOU HAVE BEEN WARNED !!!
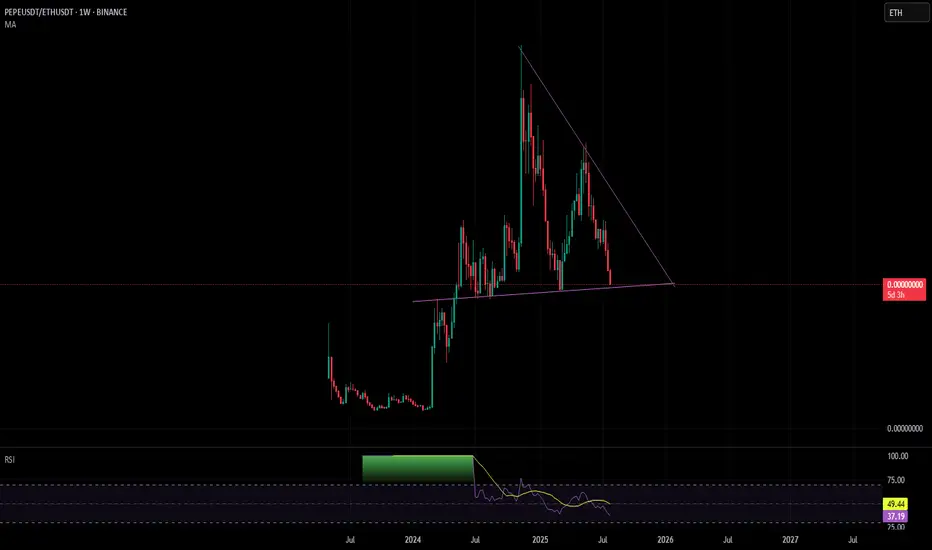
PEPE/ETH Weekly longPEPE against ETH is nearing a nice support level,
I will buy PEPE here and sell it at the tops against ETH to gain more ETH
PEPE last season alive?🔥 The alt season is beginning on the market. Many alts are yielding tens and even hundreds of percent per day. But there are also those among them from whom we clearly expected more.
And I'm talking about old memes like Doge, PEPE, SHIB, and others.
Over the past month, PEPE has grown by only 60%. Is everything really that bad? Let me explain:
1️⃣ The latest growth impulse formed a divergence with the price in terms of volume. Throughout the growth over the last 4 months, purchase volumes continued to decline. This signals a waning interest in PEPE as the price rises.
2️⃣ Money Flow also shows a near-total lack of new liquidity. Fresh money is not flowing into the asset, and even now, in such an euphoric phase, PEPE's liquidity indicator is in the neutral zone.
3️⃣ PEPE has formed a local lower high and has already deviated from resistance at $0.00001439. It has already corrected by 6% today. This shows that there is currently no liquidity in the asset to drive the price higher.
4️⃣ GAP was formed at the levels of $0.00001241 - $0.00001027. And as we know, 99% of GAPs close sooner or later.
Nevertheless, we see high levels of interest at lower prices. When the fifth 0 appears. However, these zones can also change quickly in the event of a major correction of the entire market, and no other correction will bring the asset to such prices in the short term.
📌 Conclusion:
Right now, old memes really do look sad. Thousands of new memes are created every day that can give big returns, and people are asking themselves, “If I buy a meme with no value, why should I buy an old one?”
🔔 So, at current prices, PEPE is clearly of no interest to anyone. But, as is usually the case, once such coins fall below a certain price, whales will take positions and start pushing them up. Everyone will suddenly notice how undervalued this wonderful coin was.
So, for those who want to buy, I advise you to relax, you are not missing out on anything. And there will definitely be better prices for buying.
And stay in tune by subscribing, for more insightful ideas!

TAKE PROFIT .00001639-.00001642 ? In a weekly analysis:
I bought Pepe in the lower demand zone, held the loss, and I plan to take partial profits in the lower supply zone while leaving some positions to capture gains in the higher supply zone.

Is the alt season over at Pepe?PEPE
This is not a little suspicious to me. H&S is forming on a 1-month timeframe. I also discovered 4 divergences on a 4-hour timeframe looking back at the past few weeks, which may support my assumption that this is what the off-season was all about and a longer break may be in order.

Are old PEPE meme dead?🔥 The alt season is beginning on the market. Many alts are yielding tens and even hundreds of percent per day. But there are also those among them from whom we clearly expected more.
And I'm talking about old memes like Doge, PEPE, SHIB, and others.
Over the past month, PEPE has grown by only 60%. Is everything really that bad? Let me explain:
1️⃣ The latest growth impulse formed a divergence with the price in terms of volume. Throughout the growth over the last 4 months, purchase volumes continued to decline. This signals a waning interest in PEPE as the price rises.
2️⃣ Money Flow also shows a near-total lack of new liquidity. Fresh money is not flowing into the asset, and even now, in such an euphoric phase, PEPE's liquidity indicator is in the neutral zone.
3️⃣ PEPE has formed a local lower high and has already deviated from resistance at $0.00001439. It has already corrected by 6% today. This shows that there is currently no liquidity in the asset to drive the price higher.
4️⃣ GAP was formed at the levels of $0.00001241 - $0.00001027. And as we know, 99% of GAPs close sooner or later.
Nevertheless, we see high levels of interest at lower prices. When the fifth 0 appears. However, these zones can also change quickly in the event of a major correction of the entire market, and no other correction will bring the asset to such prices in the short term.
📌 Conclusion:
Right now, old memes really do look sad. Thousands of new memes are created every day that can give big returns, and people are asking themselves, “If I buy a meme with no value, why should I buy an old one?”
🔔 So, at current prices, PEPE is clearly of no interest to anyone. But, as is usually the case, once such coins fall below a certain price, whales will take positions and start pushing them up. Everyone will suddenly notice how undervalued this wonderful coin was.
So, for those who want to buy, I advise you to relax, you are not missing out on anything. And there will definitely be better prices for buying.
And stay in tune by subscribing, for more insightful ideas!

Was that all the offseason was for Pepe?PEPE
This is not a little suspicious to me. H&S is forming on a 1-month timeframe. I also discovered 4 divergences on a 4-hour timeframe looking back at the past few weeks, which may support my assumption that this is what the off-season was all about and a longer break may be in order.


$PEPE going up. Double in the weeks ahead?CRYPTOCAP:PEPE has one of the highest beta for meme coin with high trading volume. Over 400k of hodlers on chain. Looks likely to double from here in the weeks to come as BTC D drops.

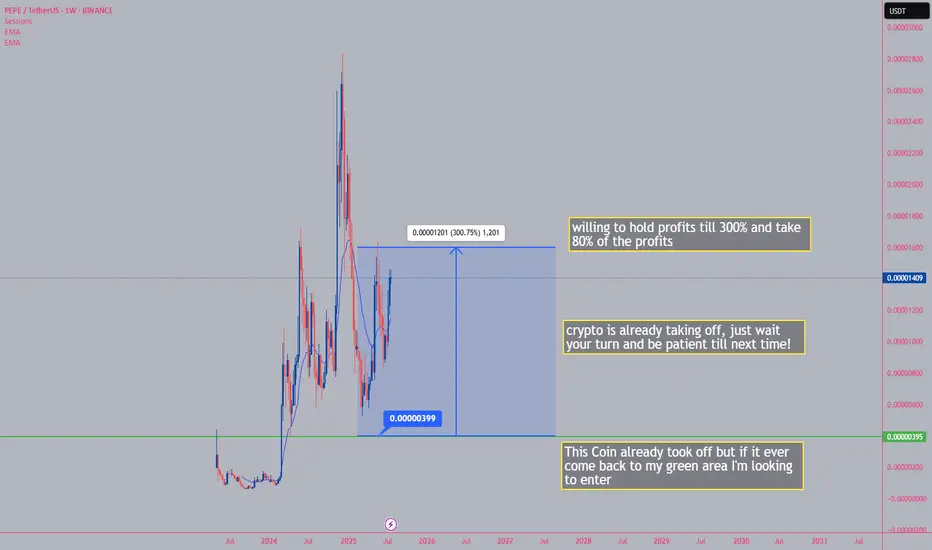
Crypto BOOMING What Does that Mean? PEPEI've entered crypto when it was low and it paid off it can take a long time, but you will make your profit back and some more as long as your patient I see this making 300% later if it comes back to my sweet spot
BINANCE:PEPEUSDT