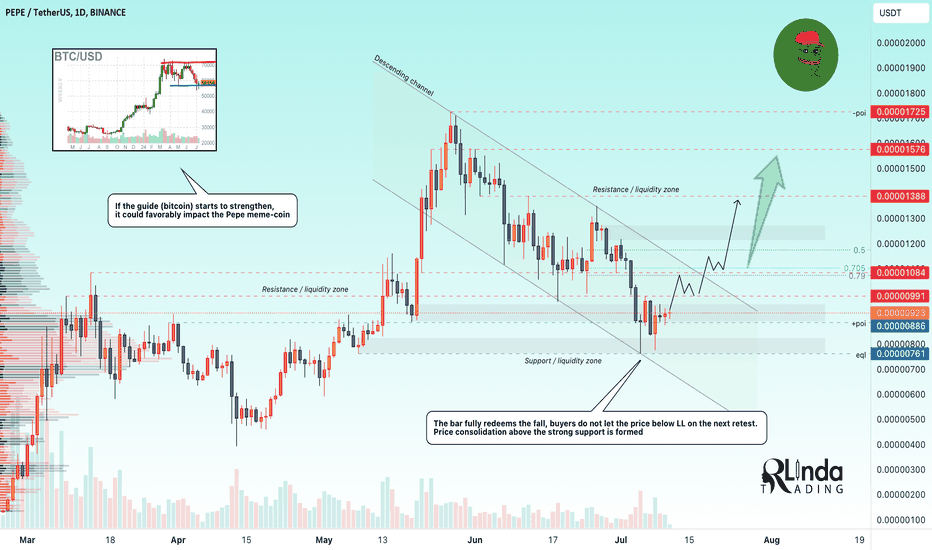
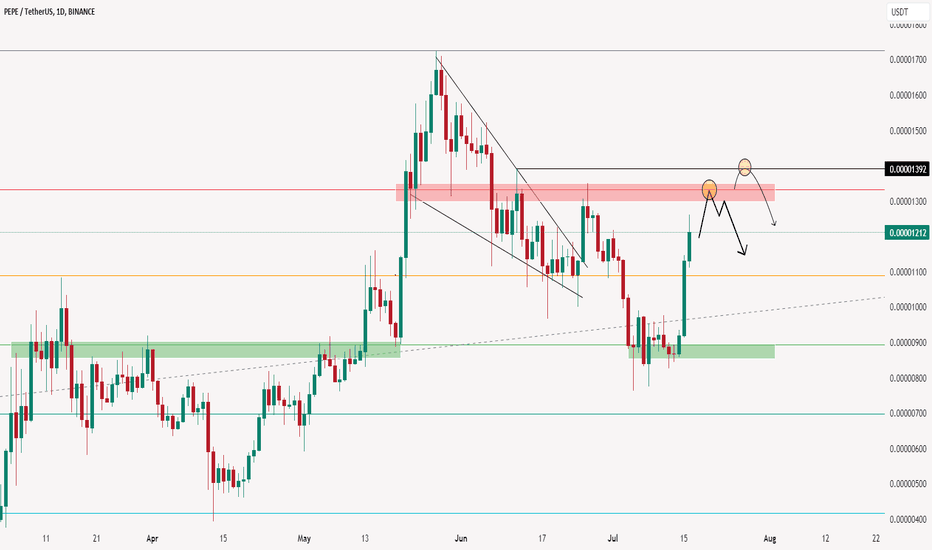
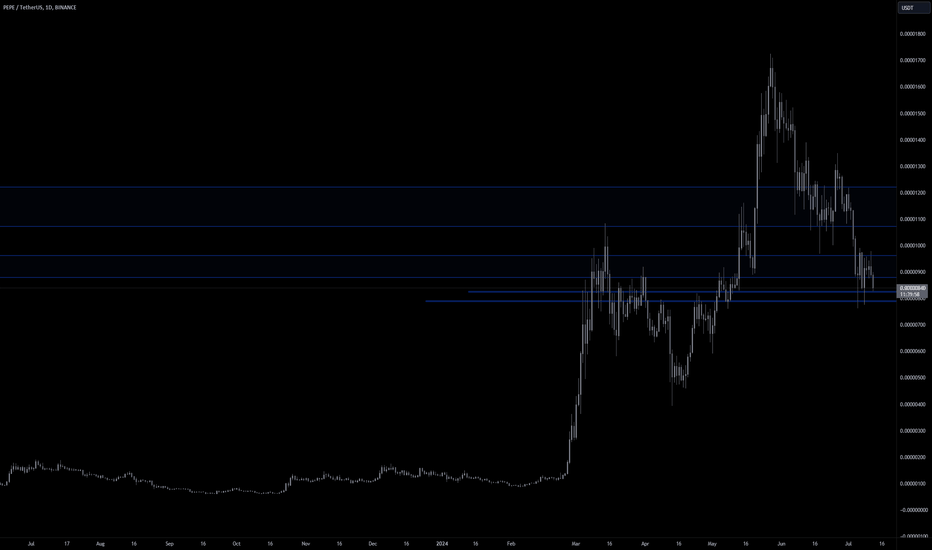
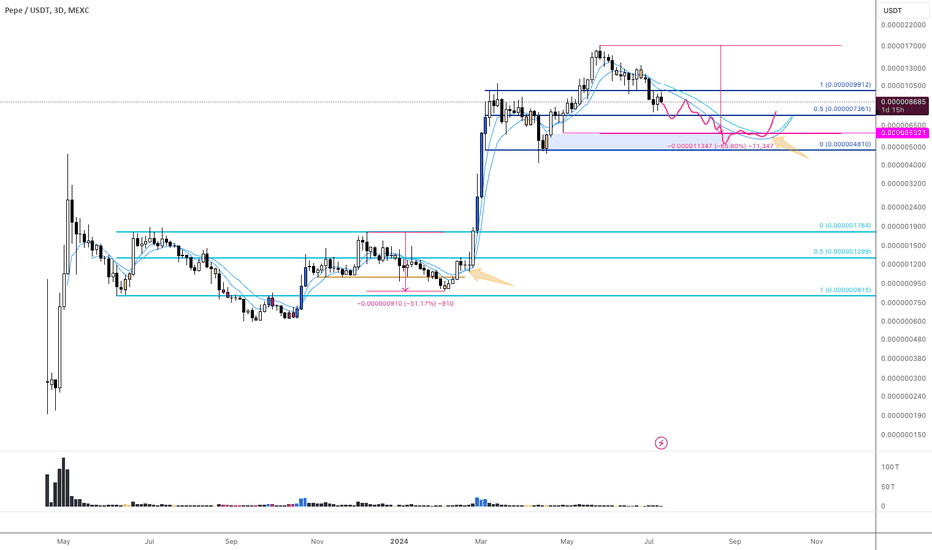
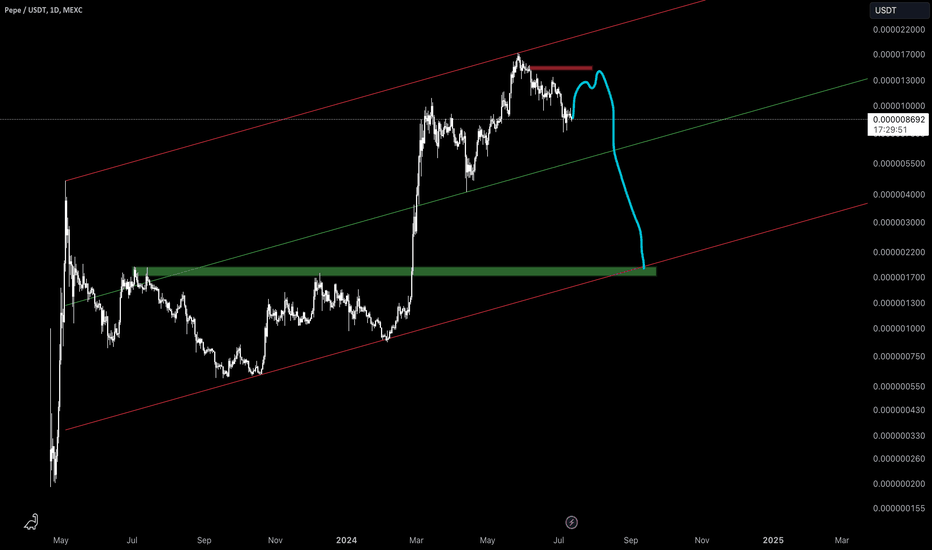
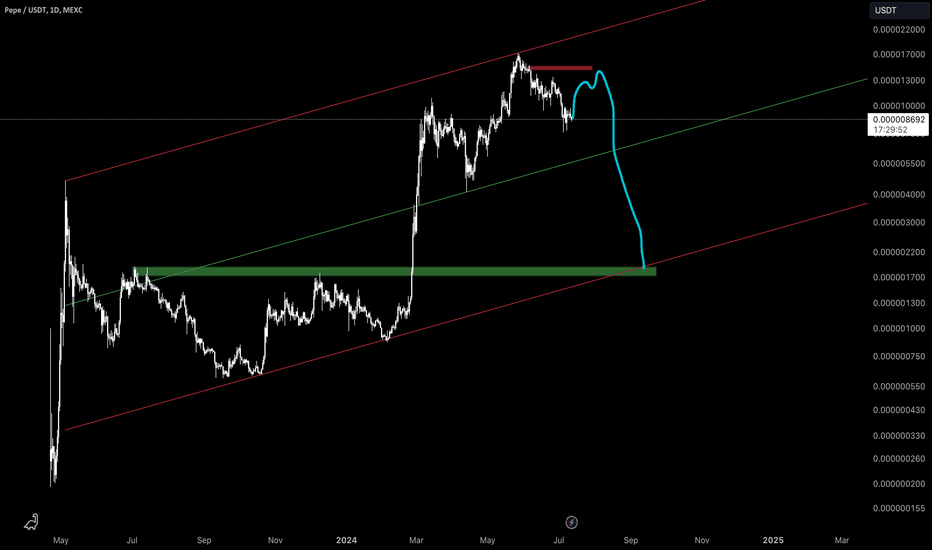
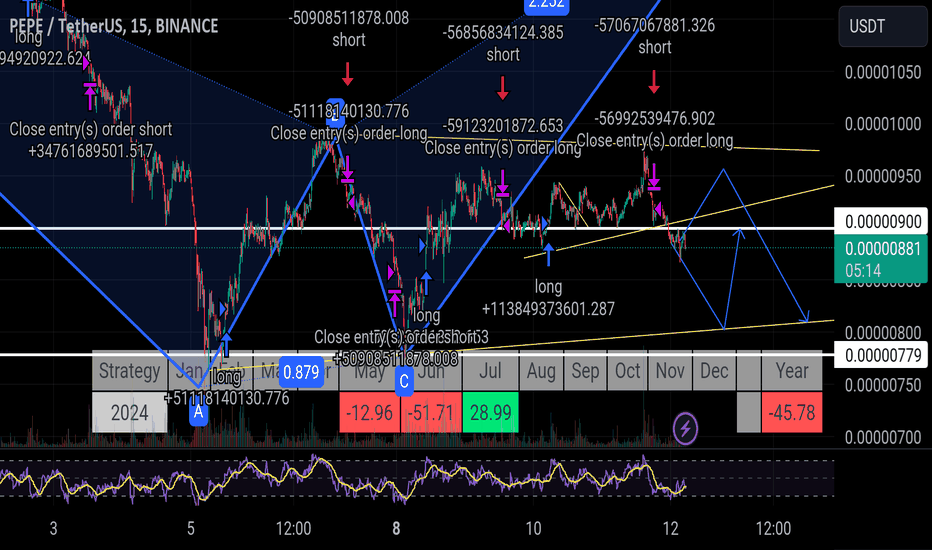
PEPE → A condition that will lead to growth. Is the buyer back?BINANCE:PEPEUSDT is undergoing a deep correction phase. The price is resting on the strong support and the "discount" zone appears the buyer, holding the market. The focus on the upper boundary of the range...
! For convenience, I will indicate key zones without zeros.
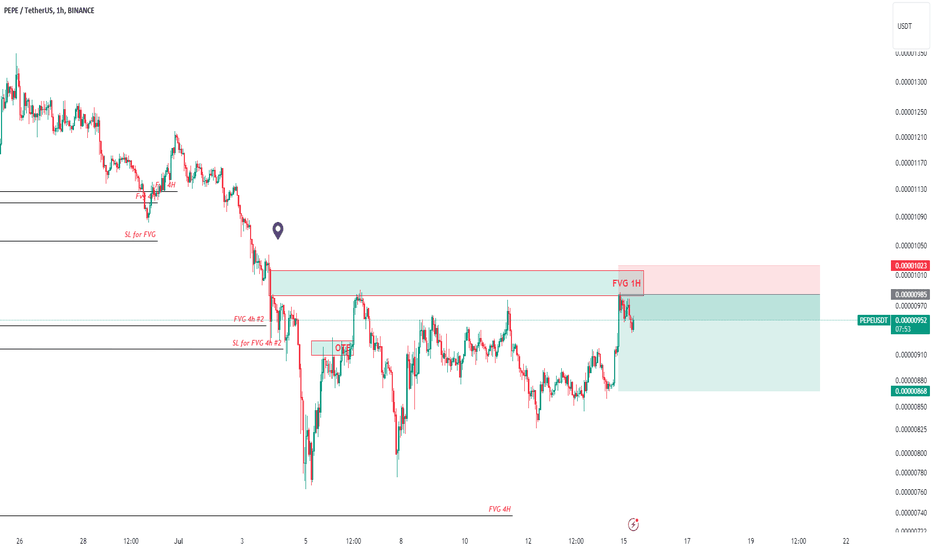
Bulls do not let the price below 0.0761, forming a limit support area, in the neighborhood of which a strong buyer appears, it can be determined by the growth of volumes and the pattern of redemption with the subsequent retest without updating the minimum.
At the moment it is not excluded that the coin can continue falling, but based on the general situation there is a chance that PEPE can move into the recovery phase, but provided that the coin can pass the area of 0.0951-0.0991 with the price fixing above this zone, which will generally define an intermediate bottom for the market.
Resistance levels: 0.0952, 0.0991, 0.1084
Support levels: 0.0886, 0.0761
Technically, the situation is complicated because of bitcoin, which is consolidating in the discount zone, but in general there are bullish prerequisites. If the guide (BTC) goes up, it may favor altcoins.
Rate, share your opinion and questions, let's discuss what's going on with PEPE / USDT ;)
Regards R. Linda!
PEPEUSDT trade ideas
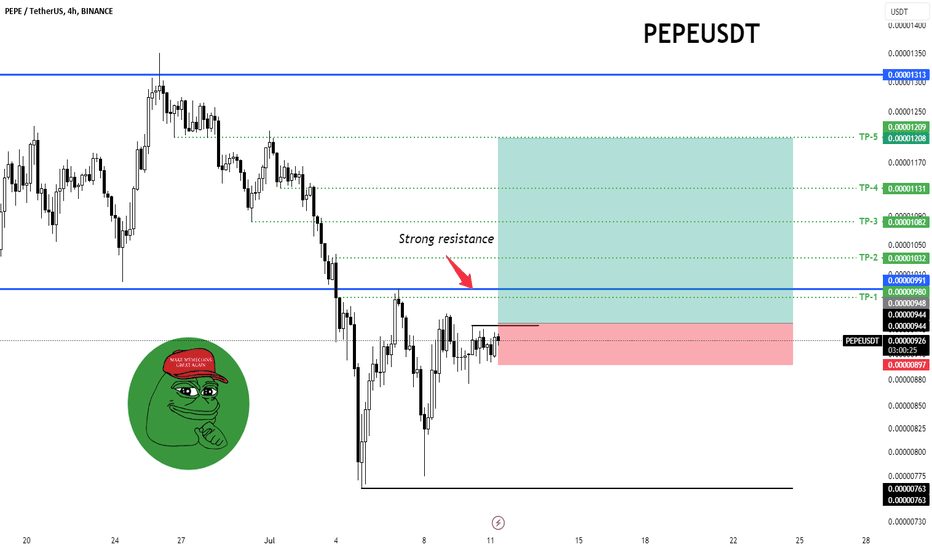
PEPE wait break S/R📊 PEPEUSDT Chart Analysis
Key Points:
Strong Resistance 💪:
A strong resistance is observed at the 0.00000991 - 0.00001032 zone. This level has acted as a barrier multiple times.
Indicated by the blue horizontal line.
Take Profit (TP) Levels 🎯:
TP-1: 0.00000991 🟢
TP-2: 0.00001032 🟢
TP-3: 0.00001082 🟢
TP-4: 0.00001131 🟢
TP-5: 0.00001208 🟢
Technical Analysis 🔍:
Previous Downtrend 📉:
The chart shows a strong downtrend previously, with the price dropping from around 0.00001313 to the low of approximately 0.00000763.
Current Zone 📈:
The current price is around 0.00000924, close to the strong resistance zone.
The red area represents the risk zone, indicating the potential for a price drop if this area is broken downward.
Potential Upside 🚀:
If the price can break the strong resistance around 0.00000991, there's potential for movement towards the subsequent TP levels.
Given the current position and the strong resistance, breaking this zone could signal a good buying opportunity.
Trading Strategy 💹:
Enter Long Position 🛒:
Consider entering a long position if the resistance at 0.00000991 is broken.
The take profit targets (TP) are sequentially TP-1 to TP-5.
Stop Loss 🛑:
Place the stop loss below the red zone (0.00000897) to limit losses in case of a sudden price drop.
Conclusion 📝:
The PEPEUSDT chart indicates a strong resistance zone. Breaking this resistance can lead to a potential price increase towards the specified TP levels. Therefore, entering a long position upon breaking this resistance and setting a stop loss below the red zone can be a sound strategy.
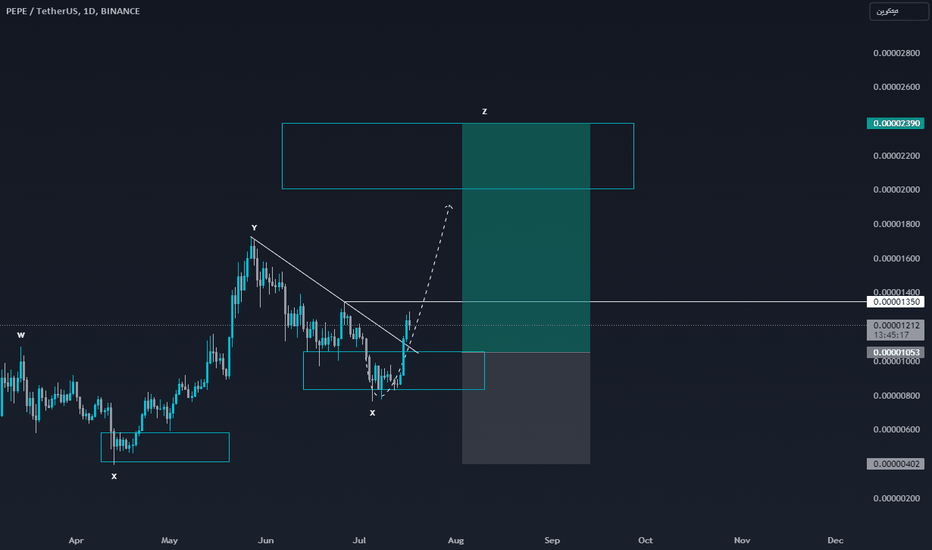
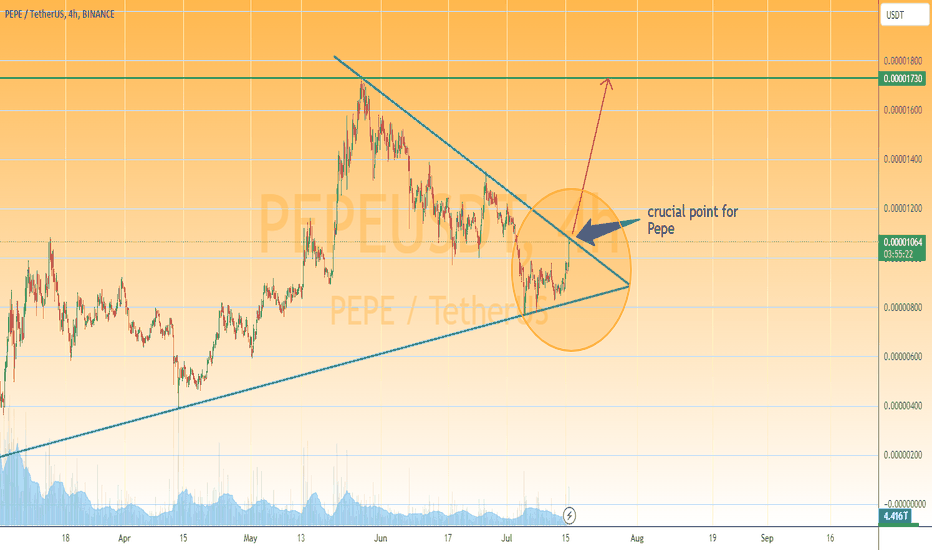
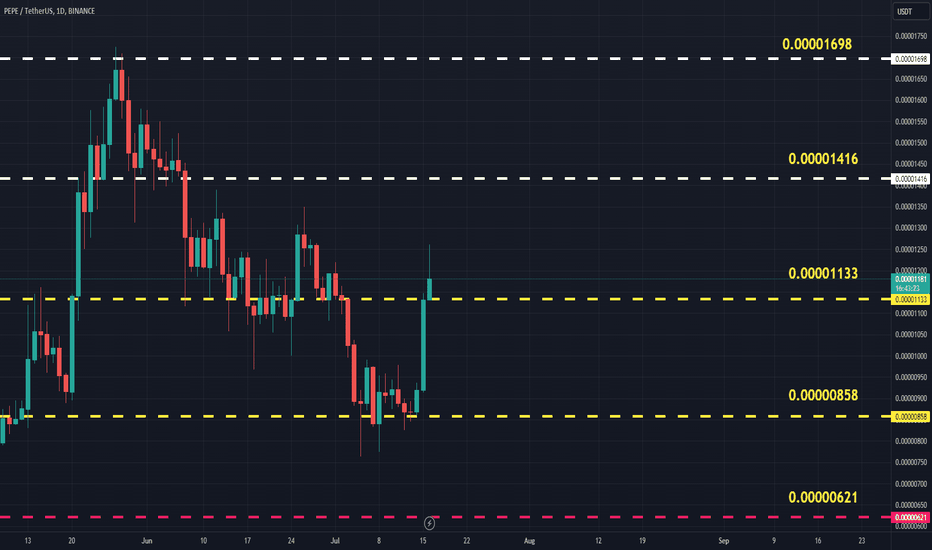
PEPE/USDTTo continue monitoring PEPE/USDT, we need to see a breakout of the resistance level at 0.00001350 USDT with a clear daily close. If the price manages to break this level and close above it, we can expect it to reach the following targets:
- 0.00001570 USDT
- 0.00001723 USDT
- 0.00002003 USDT
- 0.00002324 USDT
If the price successfully surpasses 0.00001350 USDT and closes daily above it, we might see a stronger upward movement towards these mentioned targets. Keep a close watch on this level to confirm the uptrend.
Displaying Current Market Cap Next to Price on TradingView ChartConcept Overview
The proposed feature will display the current market capitalization of an asset directly next to its price on TradingView charts. This real-time integration will allow traders and investors to see both the current trading price and the overall market value of the asset simultaneously. By having this information readily available, users can make more informed trading decisions without needing to switch between different sources or perform manual calculations.
Detailed Feature Description
1. Real-Time Market Capitalization Display
Dynamic Calculation: The market capitalization will be calculated in real-time using the formula:
Market Capitalization = Current Price × Number of Outstanding Shares
Current Price: Utilize the existing real-time price feed that TradingView provides.
Outstanding Shares: This value can be static, retrieved from the company's latest financial disclosures, or updated periodically from trusted financial databases.
2. User Interface Integration
Positioning: Display the market capitalization next to the current price in the chart’s price scale. This could be on the right side, just below or above the current price.
Formatting: Use a clear, concise format, such as:
Price :$123.45
Market Cap:$1.23𝐵
Price:$123.45 Market Cap:$1.23B
Color Coding: Match the market cap text color with the price color for consistency and easy association.
3. Customization Options
Toggle Visibility: Allow users to enable or disable the market cap display through the chart settings.
Update Frequency: Provide options to set the update frequency (e.g., real-time, every minute, hourly) to manage performance.
Font and Size: Include customization for the font size and style to match user preferences.
Technical Implementation
1. Data Integration
Data Source: Integrate with reliable financial data providers to fetch the number of outstanding shares for each asset.
API Access: Use APIs to retrieve the latest data and ensure it’s updated regularly.
2. Pine Script Modification
Extend Pine Script: Enhance Pine Script to support the calculation and display of market capitalization.
For example:
pinescript
//@version=5
indicator("Market Cap Display", overlay=true)
// Define the number of outstanding shares (for example, 1 billion shares)
var float outstandingShares = 1e9
// Fetch the current price of the asset
currentPrice = close
// Calculate the market capitalization
marketCap = currentPrice * outstandingShares
// Convert market cap to a readable format
marketCapStr = str.tostring(marketCap, "#.##a")
// Display the market cap next to the price on the chart
label.new(x=bar_index, y=close, text="Price: $" + str.tostring(currentPrice) + " | Market Cap: $" + marketCapStr, style=label.style_label_down, color=color.white, textcolor=color.black, size=size.small)
3. Performance Optimization
Efficient Calculation: Optimize the script to ensure minimal performance impact, even with frequent updates.
Caching Data: Implement data caching for outstanding shares to reduce API calls and improve performance.
Benefits and Impact
Enhanced Decision-Making: Traders can quickly assess the market value of an asset alongside its price, aiding in more informed decisions.
User Convenience: Eliminates the need for external tools or manual calculations to determine market cap, streamlining the trading process.
Increased Engagement: Providing additional value through real-time financial metrics can enhance user satisfaction and platform engagement.
Implementation Roadmap
Research & Planning: Identify and integrate with reliable data sources for outstanding shares.
Development: Enhance Pine Script capabilities and user interface components to support the new feature.
Testing: Conduct thorough testing to ensure accuracy and performance across various market conditions and asset types.
User Feedback: Roll out the feature to a subset of users for feedback and iterative improvements.
Full Deployment: Implement the feature across the platform with user guides and support.
This feature will empower TradingView users by providing immediate access to market capitalization data directly on the charts, facilitating better trading strategies and market insights.
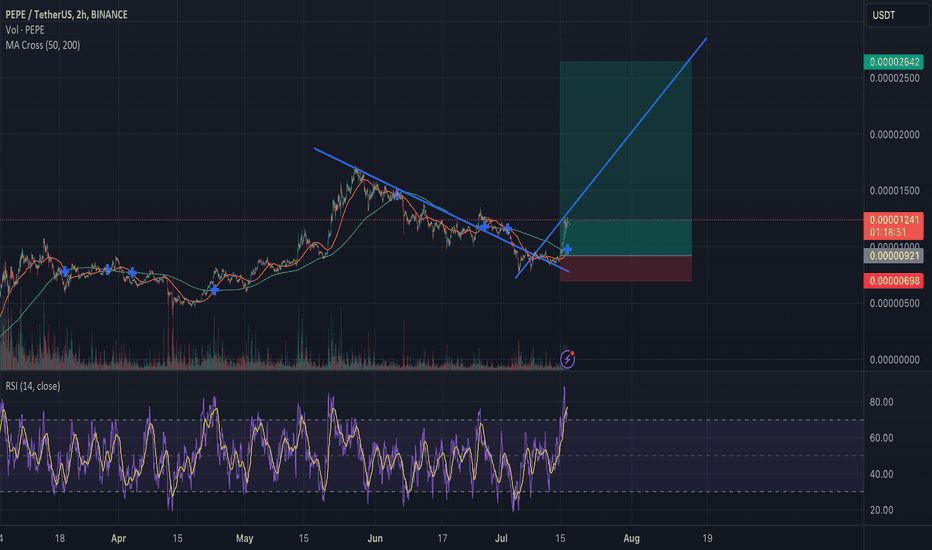
$PEPE trollololing from 0.00000920 to 0.0000260-270 price 185%upAfter hitting a low post-correction we are very much still in a bull market with BINANCE:PEPEUSDT after the correction from 0.00001600 happened. Majority selling volume sitting at 0.00002642.
Invest smart, invest hard.
Boost my post if you like this idea 💡
Also follow and subscribe for more uproars. Let's spread the word together.
Roaring Puppy 🐶 out.
BINANCE:PEPEUSDT
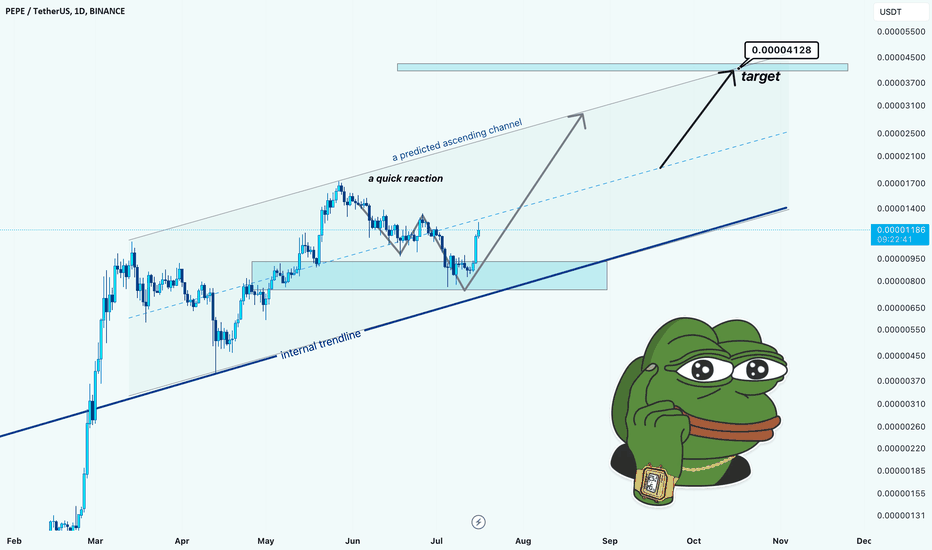
PEPE Rockets Upward: Eyeing Explosive Gains!hello guys.
let's analyze PEPE!
- Current Price: The current price of PEPE is $0.00001177, showing a 3.98% increase.
- Support and Resistance:
- Support Level: The price has recently bounced off an internal trendline, acting as a significant support level.
- Resistance Level: The target price is set at $0.00004128, indicating a potential resistance point in the future.
- Trend Analysis:
- Ascending Channel: The chart predicts an ascending channel, suggesting that the price might continue to rise if it stays within this channel.
- Internal Trendline: The price has reacted quickly to the internal trendline, indicating strong buying interest at this level.
- Pattern Formation:
- Double Bottom: The recent bounce could be seen as a double bottom pattern, which is typically a bullish reversal signal.
- Quick Reaction: The quick reaction to the trendline suggests strong momentum and buyer confidence.
- Predicted Movement:
- If the price continues to follow the predicted ascending channel, it is expected to reach the target of $0.00004128.
- The price might face some resistance along the way, particularly around the mid-line of the channel, but overall, the momentum seems bullish.
- Market Sentiment: The increase in price and the strong reaction at support levels indicate a positive market sentiment. Traders seem optimistic about the future price movement of PEPE.
Key Points to Watch:
- Trendline Support: Ensure the price remains above the internal trendline for the bullish trend to continue.
- Mid-channel Resistance: Monitor price action as it approaches the mid-line of the predicted ascending channel for potential resistance.
- Volume: Increasing trading volume would further confirm the bullish trend and provide additional confidence in reaching the target price.
___________________________
✓✓✓ Always do your research.
❒❒❒ If you have any questions, you can write them in the comments below, and I will answer them.
❤︎ ❤︎ ❤︎And please don't forget to support this idea with your likes and comment
PEPE COIN PRICE ANALYSIS AND NEXT POSSIBLE MOVES !!CRYPTOCAP:PEPE Coin Update !!
• in Last 3 days we see 45% move in PEPE Coin Price !!
• Now incase its price reach 0.00001331-1350$ OR 0.00001386$ then i will look for instant future short trade setup with Tight Stoploss🫡
• Short term spot traders that buy it in a dip few days ago should take profit upto 70% & move SL AT Entry Point.
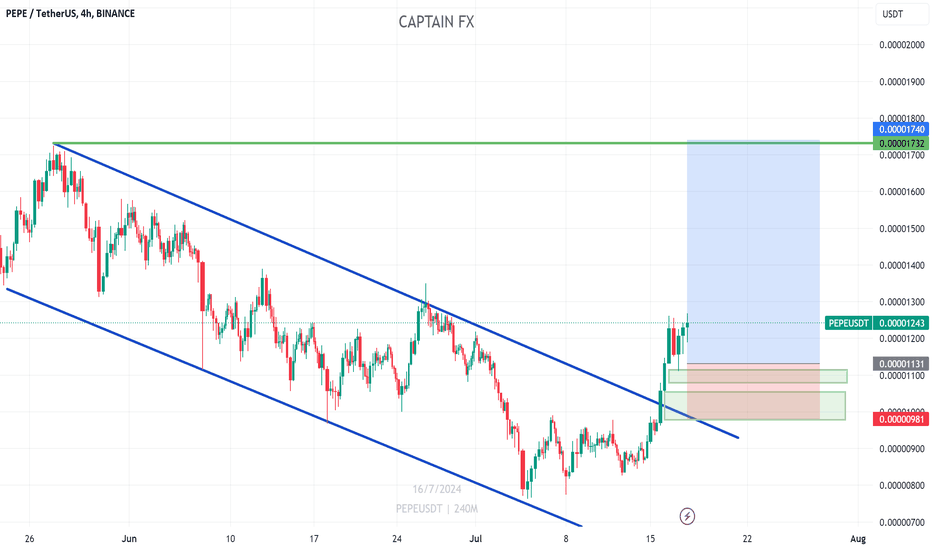
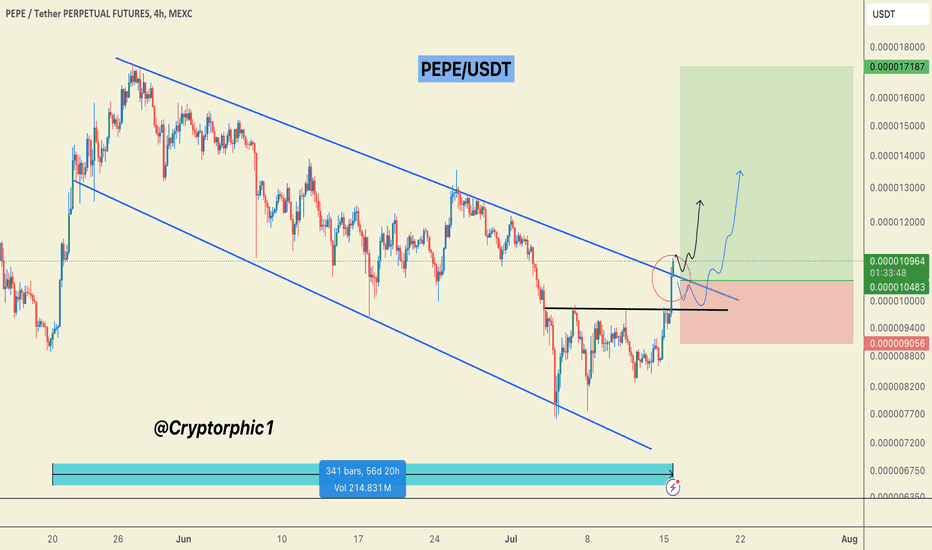
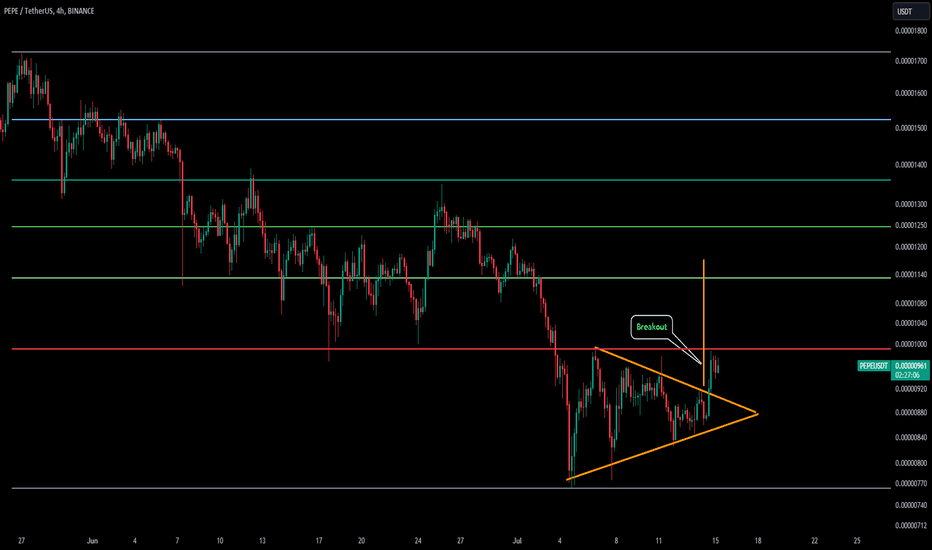
#PEPE/USDT Breaking out, Trade Setup here.#PEPEUSDT is breaking out of a 2-month descending channel. Two potential scenarios:
1️⃣ Immediate breakout continuation.
2️⃣ Retest the breakout level before a potential upward move.
For those looking to go long, consider waiting for the retest for a better entry point. 📈
ETH looks dumpy in the short term too, this can cause some pullback before further continuation.
Do hit the like button and share your views in the comment section.
Thank you
Follow for more.
#PEPE
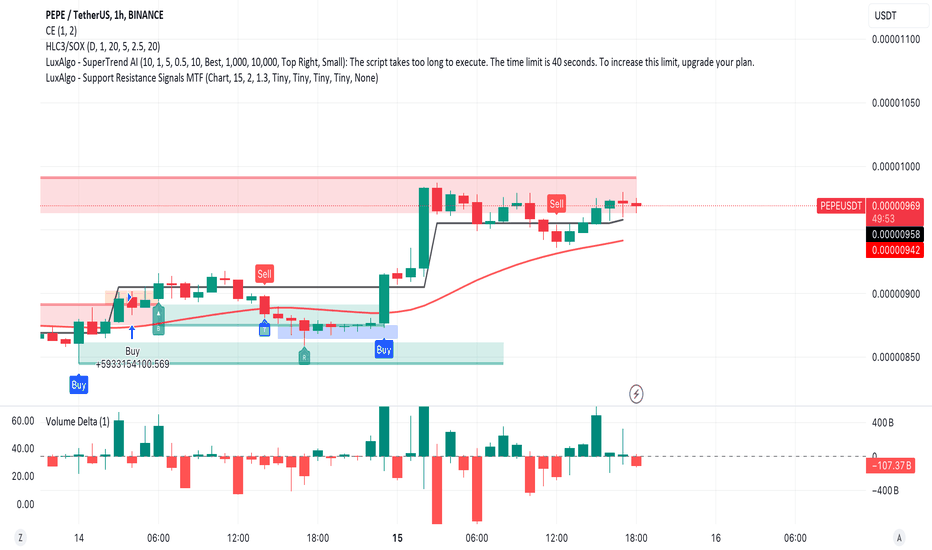
PEPEUSDT UpdatePEPE flashed a bullish EMA Crossover signal on the 4H chart. The signal is similar to a MACD crossover and indicates further bullish momentum.
Additionally, PEPE is back above its crucial price level of $0.000009.
Therefore, we're at an exciting level for a long entry. Next, resistance sits at $0.000011, resulting in a profit potential of 15%. Stop loss should be placed slightly below the previous resistance level of .000009.
PEPEUSDT Bullish Momentum: 10-Day Price Forecast
BINANCE:PEPEUSDT is witnessing bullish momentum today. The meme coin has skyrocketed over 62% in its 24-hour trading volume, standing around $846.23 million. This latest surge shows that bulls are gaining control of the market as the PEPE price rebounds after the recent correction.
As of press time, PEPE coin is trading at $0.000009454. This comes after a notable jump of 5.61% in the last 24 hours. Additionally, the market cap of the coin has surged 5.59% to $3.98 billion. This makes PEPE the 25th largest coin on the market in terms of market cap.
However, it should be noted that the price of PEPE token is down 21.07% over the last 30 days. The crypto market witnessed a severe crash in previous weeks. PEPE also struggled during this time. But the good thing is that this crypto market downtrend seems to be over. Consequently, PEPE’s price is surging today to achieve a notable recovery.
Pepe price sees bullish momentum
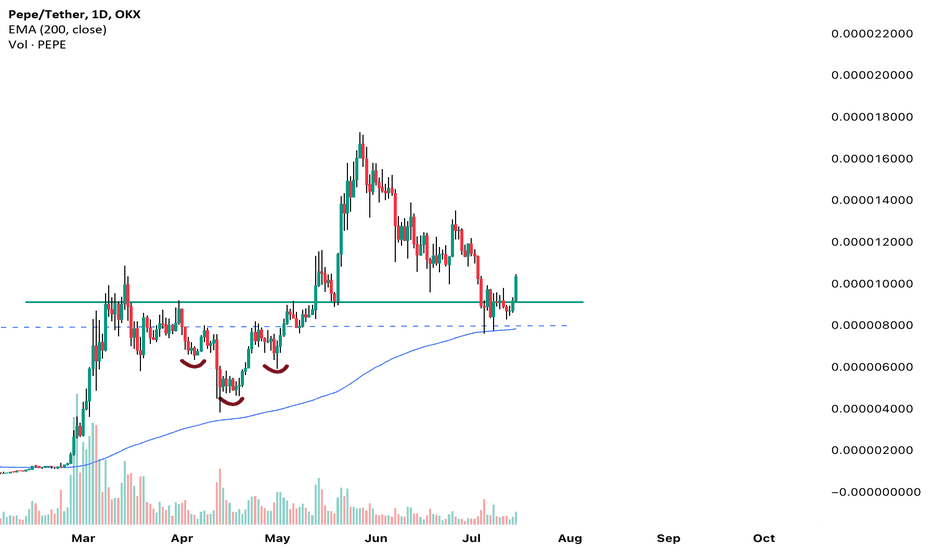
While PEPE coin has already surged 5.61% today, there are more signals of a further price rally. Per TradingView data, the meme coin is trading above its 200-day Simple Moving Average (SMA). This level acts as a support level for PEPE, and it shows that the token is bullish in the long term.
The 200-day SMA typically indicates the long-term market movement of a coin. Despite the daily basis volatility on the market, it highlights that the meme coin is in a bullish trend in the broader outlook. In addition, the RSI of PEPE supports this technical analysis.
As of now, PEPE’s RSI is at the 44.9 level. Notably, RSI in the range of 40-50 acts as a support zone for a coin. This range also shows that the coin is in a bull market despite short-term volatility. Overall, these technical indicators confirm a bull run for PEPE token.
10-Day Price Predictions for PEPE:
Given the bullish momentum and the technical indicators, here is our 10-day price prediction for PEPE:
1. Day 1: $0.000009832
2. Day 2: $0.000010225
3. Day 3: $0.000010634
4. Day 4: $0.000011060
5. Day 5: $0.000011502
6. Day 6: $0.000011962
7. Day 7: $0.000012440
8. Day 8: $0.000012938
9. Day 9: $0.000013455
10. Day 10: $0.000013993
These predictions assume that the bullish momentum will continue and that there will be no major market disruptions. Always keep in mind that the cryptocurrency market is highly volatile, and external factors can significantly influence prices.
Trade safely and consider the market dynamics before making any trading decisions.
I love pepe: 4HT candles is satisfying Personal idea: Currently pepe in 4HT frame showing finding support around 0.0000075 - 86 , also facing little resistance around 0.00000095 , in daily time frame pepe needs creating good bullish candle, any bullish candle with break out could move the pepe to middle resistance around 0.000013 , main wave of movement will be started after pullback and finding support in 0.000013 price. Good 🙂 luck 👍
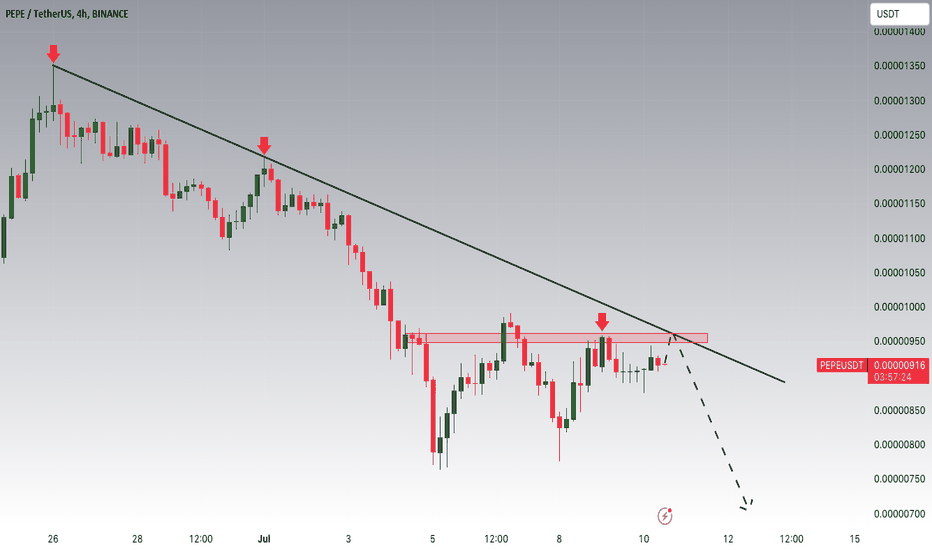
PEPE Potential DownsidesHey Traders, in today's trading session we are monitoring PEPEUSDT for a selling opportunity around 0.00000950 zone, PEPEUSDT is trading in a downtrend and currently is in a correction phase in which it is approaching the trend at 0.00000950 support and resistance area.
Trade safe, Joe.
PEPEUSDTPreferably suitable for scalping and accurate as long as you watch carefully the price action with the drawn areas.
With your likes and comments, you give me enough energy to provide the best analysis on an ongoing basis.
And if you needed any analysis that was not on the page, you can ask me with a comment or a personal message..
Enjoy Trading... ;)
