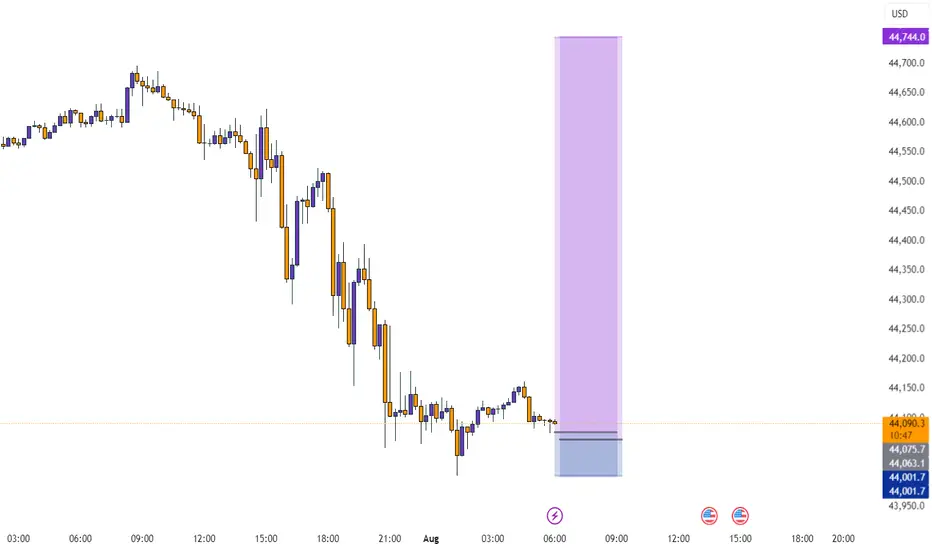
KOG - US30Moving on from the previous chart we shared on DOW you can see our red box worked well and gave us the move we wanted upside, however, we stopped just short of the ideal target level.
For that reason, and after looking at the liquidity indicator we will monitor the boxes here for a possible retrace

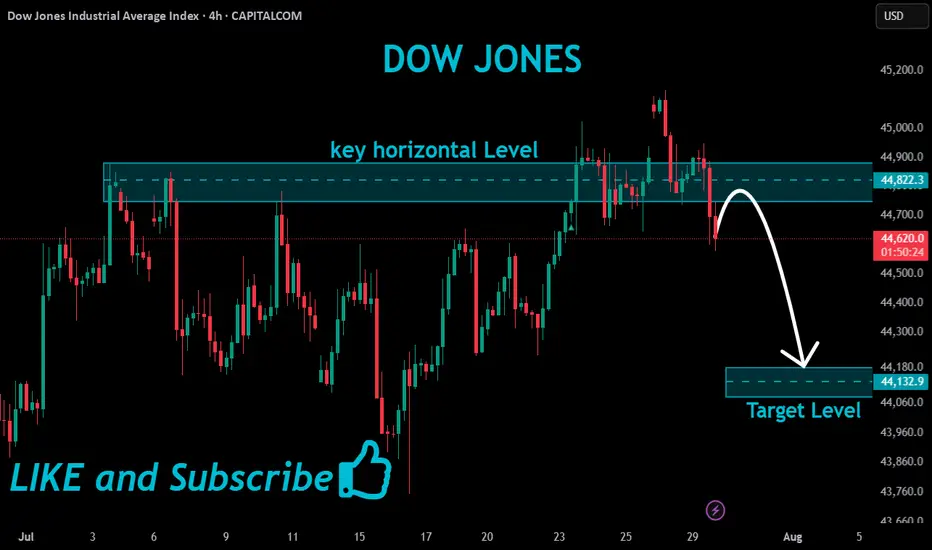
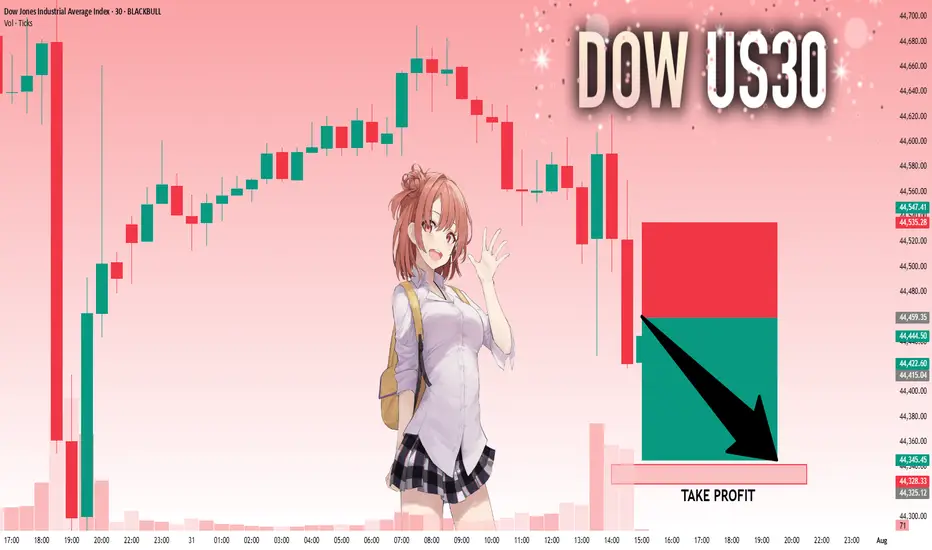
US30 Bearish Breakout!
HI,Traders !
#US30 made a bearish
Breakout of the key horizontal
Level of 44822.3which also
Seems to have been a neckline
Of the small H&S pattern so
We are locally bearish biased
And we will be expecting a
Further bearish move down !
Comment and subscribe to help us grow !
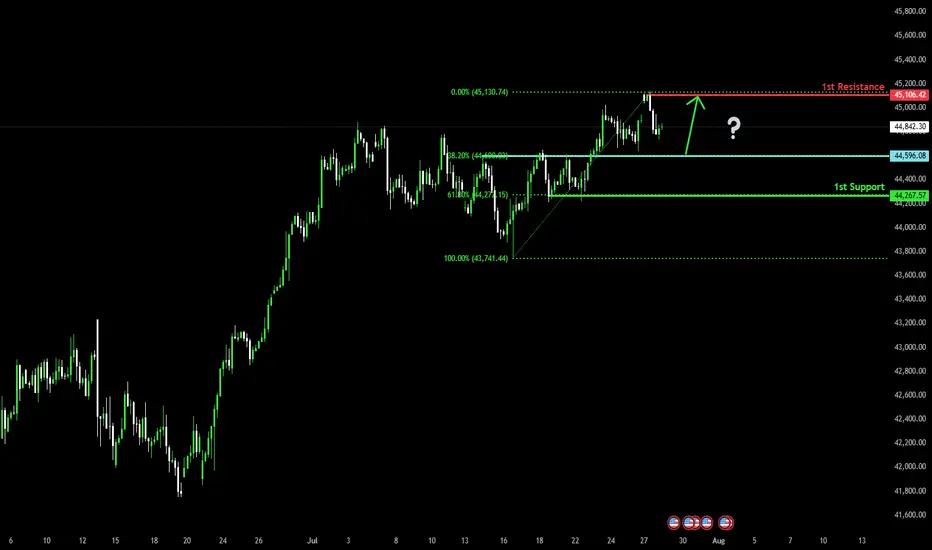
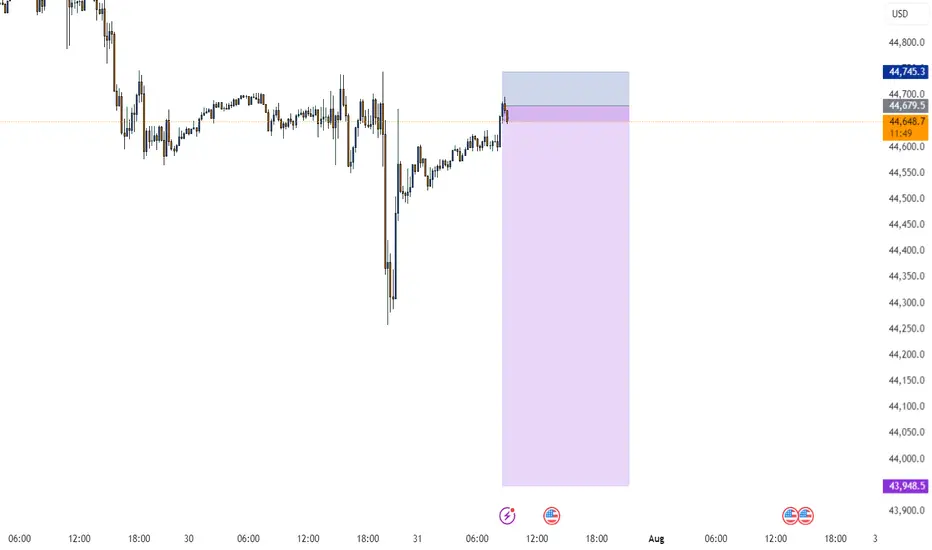
Bullish bounce off overlap support?Dow Jones (US30) is falling towards the pivot and could bounce to the 1st resistance which acts as a swing high resistance.
Pivot: 44,596.08
1st Support: 44,267.57
1st Resistance: 45,106.42
Risk Warning:
Trading Forex and CFDs carries a high level of risk to your capital and you should only trad
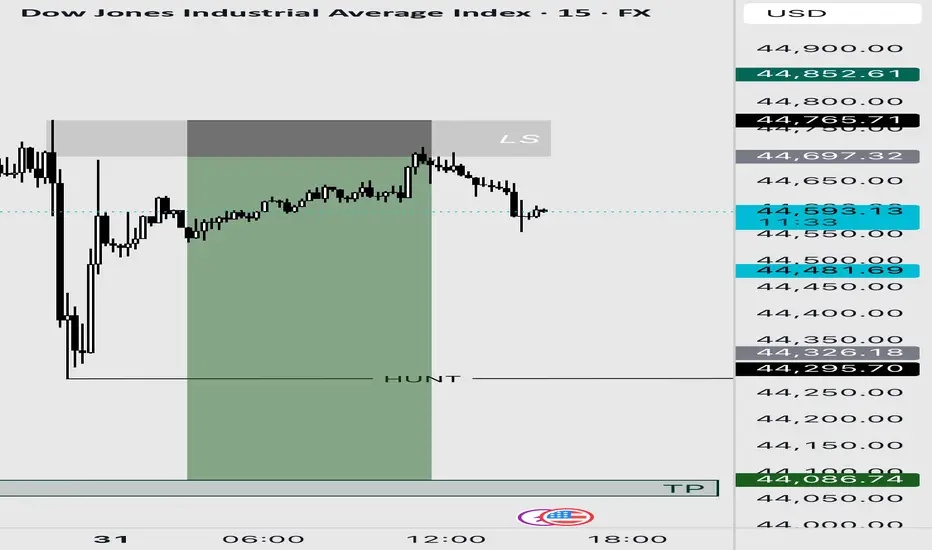
Us30usd sellI entered a sell trade from the LS zone. The PEZ zones were all used up. I set the last one as my TP.
Dow Jones Potential DownsidesHey Traders, in today's trading session we are monitoring US30 for a selling opportunity around 44,300 zone, Dow Jones is trading in a downtrend and currently is in a correction phase in which it is approaching the trend at 44,300 support and resistance area.
Trade safe, Joe.
US30: Absolute Price Collapse Ahead! Short!
My dear friends,
Today we will analyse US30 together☺️
The in-trend continuation seems likely as the current long-term trend appears to be strong, and price is holding below a key level of 44,459.35 So a bearish continuation seems plausible, targeting the next low. We should enter on confirmat
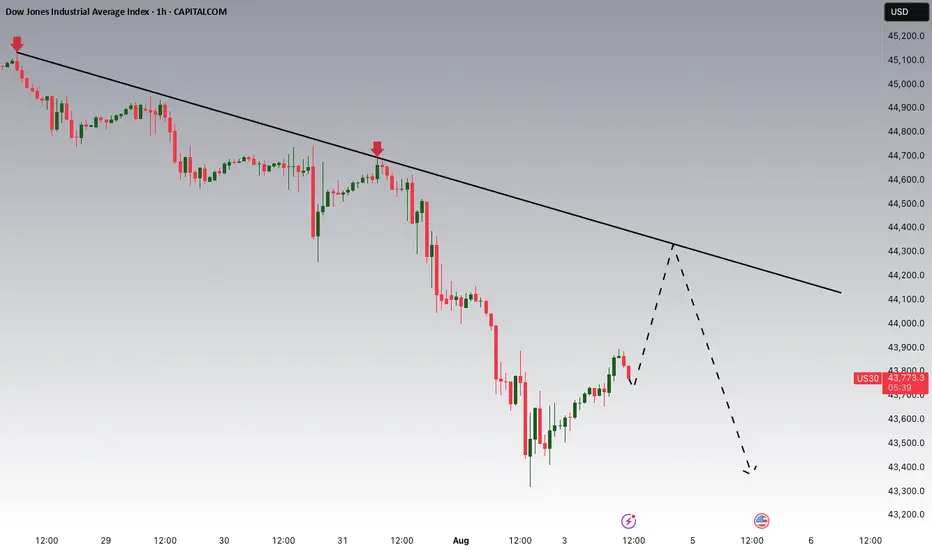
Dow Jones August GameplanNow that the first trading day of August has printed, can one reliably forecast the possible month based on just the first day? I am inclined to believe that one can with a small amount of accuracy. Not perfect.
There are two types of monthly cycles when the first traded day is a bearish cand

US30 (15M) – Bearish Reversal Setup, Short Opportunity📊 Analysis:
The US30 index on the 15-minute chart is showing signs of a bearish reversal after a recent upward push. Key technical observations:
1. Price Action & Structure
* US30 has been trading in a minor uptrend, but momentum is weakening.
* The latest 15M candles show lower highs form

See all ideas
Displays a symbol's price movements over previous years to identify recurring trends.
Frequently Asked Questions
US 30 - Forward (19 Jun - 17 Sep) reached its highest quote on Jul 28, 2025 — 45,308.6 USD. See more data on the US 30 - Forward (19 Jun - 17 Sep) chart.
The lowest ever quote of US 30 - Forward (19 Jun - 17 Sep) is 36,706.2 USD. It was reached on Apr 7, 2025. See more data on the US 30 - Forward (19 Jun - 17 Sep) chart.
US 30 - Forward (19 Jun - 17 Sep) is just a number that lets you track performance of the instruments comprising the index, so you can't invest in it directly. But you can buy US 30 - Forward (19 Jun - 17 Sep) futures or funds or invest in its components.