Index/US) Bearish trend analysis Read The caption)SMC trading point update
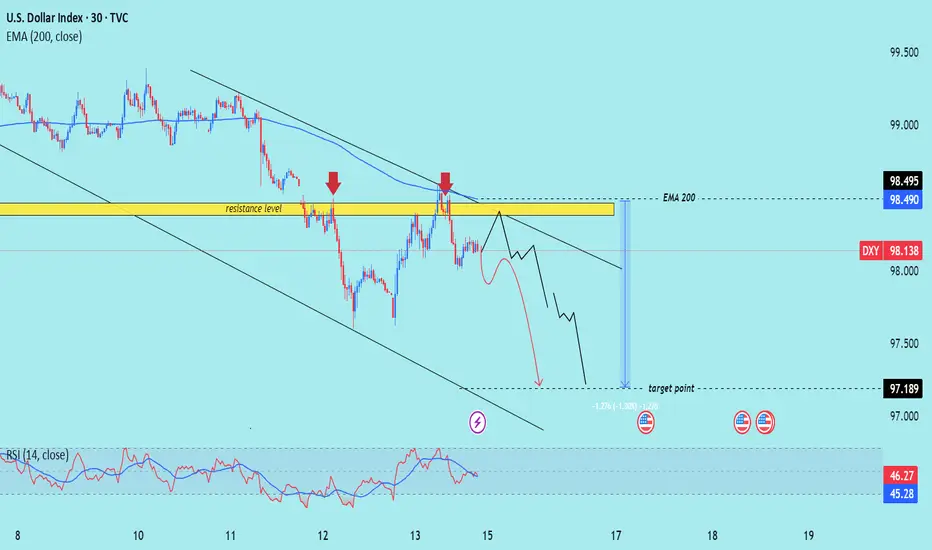
Technical analysis of U.S. Dollar Index (DXY) on the 30-minute timeframe, with the price respecting a clear downtrend and repeatedly rejecting a resistance zone near the 200 EMA.
---
Analysis Breakdown
Key Technical Elements:
1. Downtrend Structure:
The price remains within a descending channel.
Multiple lower highs and lower lows signal sustained bearish pressure.
2. Resistance Zone:
Highlighted near 98.490–98.495, aligned with the EMA 200.
Multiple rejections from this level (indicated by red arrows), confirming strong supply.
3. EMA 200 (98.490):
Acts as dynamic resistance.
Price is below it, reinforcing the bearish bias.
4. Projected Move:
Bearish price path targets the 97.189 level (target point).
A measured move of approximately -1.30% is illustrated.
5. RSI (14):
RSI currently at 46.27, below the neutral 50 mark.
This confirms bearish momentum without being oversold, leaving room for further downside.
---
Bearish Thesis:
Repeated failure to break above key resistance + downward channel + RSI weakness suggests a continuation to the downside.
Short-term consolidation expected before breakdown continuation.
---
Trade Idea Concept:
Entry: Sell on a minor pullback near resistance (~98.300–98.490), or breakdown below the recent minor support.
Target: 97.189 zone.
Stop Loss: Above 98.500 or EMA 200 to invalidate the bearish setup.
Mr SMC Trading point
Risks to Watch:
A break and strong close above 98.500 would invalidate the bearish structure and could initiate a trend reversal.
Economic events (noted by calendar icons) may trigger volatility – ideal to monitor closely around those times.
plesse support boost 🚀 this analysis)
USDX trade ideas
16.06.25 Morning ForecastPairs on Watch -
FX:NZDUSD
FX:CADJPY
OANDA:XAUUSD
FX:EURCAD
A short overview of the instruments I am looking at for today, multi-timeframe analysis down to what I will be looking at for an entry. Enjoy!

Dollar Monthly CLS I Model 1 I Reversal I DOBHey, Market Warriors, here is another outlook on this instrument
If you’ve been following me, you already know every setup you see is built around a CLS Footprint, a Key Level, Liquidity and a specific execution model.
If you haven't followed me yet, start now.
My trading system is completely mechanical — designed to remove emotions, opinions, and impulsive decisions. No messy diagonal lines. No random drawings. Just clarity, structure, and execution.
🧩 What is CLS?
CLS is real smart money — the combined power of major investment banks and central banks moving over 6.5 trillion dollars a day. Understanding their operations is key to markets.
✅ Understanding the behavior of CLS allows you to position yourself with the giants during the market manipulations — leading to buying lows and selling highs - cleaner entries, clearer exits, and consistent profits.
📍 Model 1
is right after the manipulation of the CLS candle when CIOD occurs, and we are targeting 50% of the CLS range. H4 CLS ranges supported by HTF go straight to the opposing range.
"Adapt what is useful, reject what is useless, and add what is specifically your own."
— David Perk aka Dave FX Hunter ⚔️
👍 Hit like if you find this analysis helpful, and don't hesitate to comment with your opinions, charts or any questions.
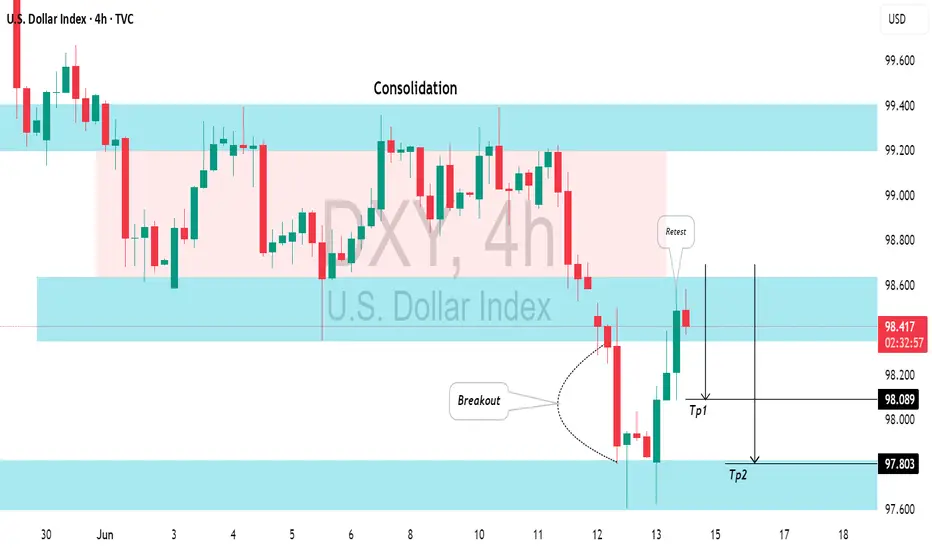
US DOLLAR INDEX(DXY): Classic Bearish SetupI believe that 📉DOLLAR INDEX has a potential to continue falling.
The market has been consolidating in a wide intraday horizontal range, and the breakout below the range support is a significant bearish indicator.
Target levels are 98.08 then 97.80 support.
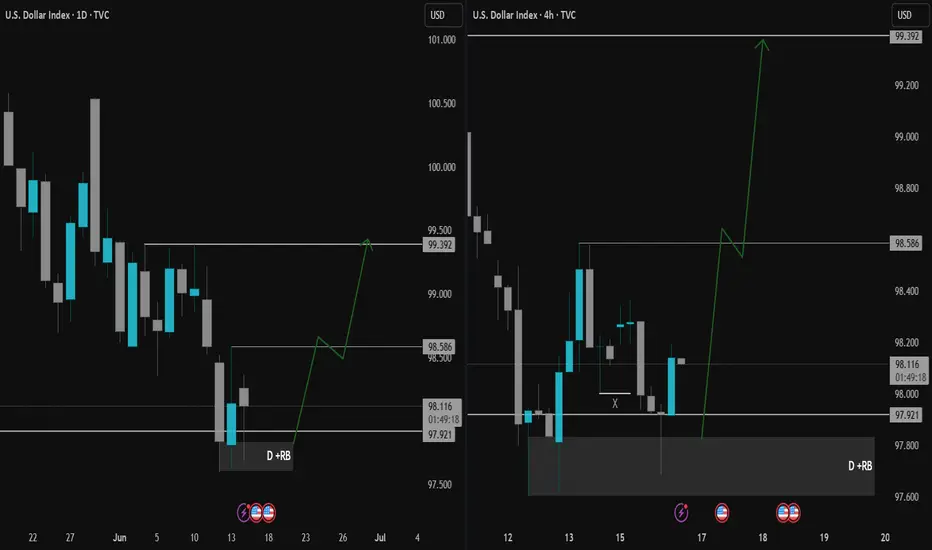
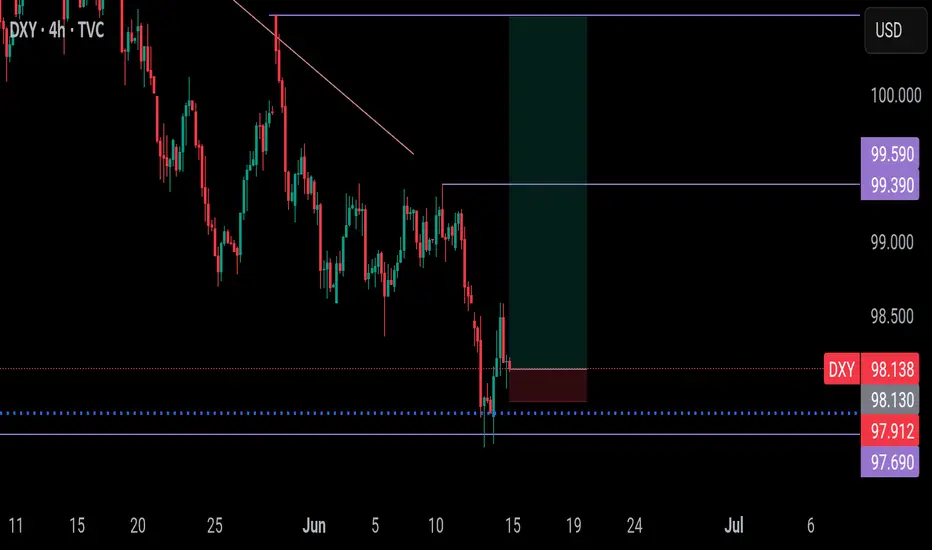
DXY Market Outlook: Eyes on 99.392Hello Traders,
DXY found buyers at the 97.921 level we tracked last week and managed to close daily candles above this level. We can now refer to this area as a rejection block (D + RB). This week, the block was retested and encountered rejection from buyers.
With this buyer reaction, our target is the peak level of the consolidation that brought the price here (99.392).
There's a minor level to watch along the way: 98.586. However, considering the key level where the price reacted and the weekly chart showing no major obstacles ahead, we believe that targeting the peak of the consolidation that initiated the last decline (99.392) is the more suitable approach.
Taking news data into account—and more importantly, geopolitical factors and unexpected developments—we still acknowledge the possibility of the price sweeping the low again. However, we don’t expect this to invalidate the overall scenario. With news catalysts, we anticipate the price reaching the target within the week.
Until the next update, wish you many pips!
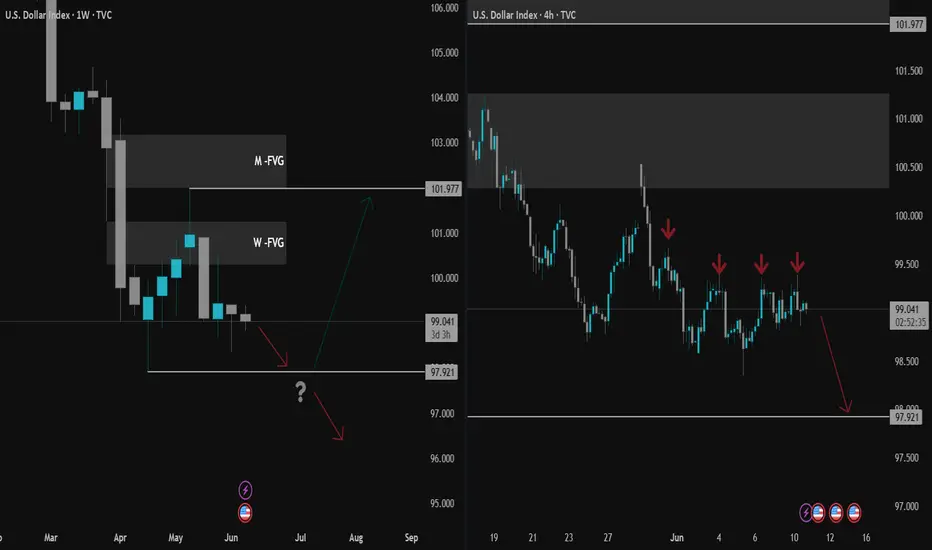
Stuck in the Zone: DXY Tests Balance Between 98 and 99Hello Traders,
After a sharp and uninterrupted decline in the DXY, price found support at the 97.921 level. Sellers then regained control from the weekly bearish Fair Value Gap (W-FVG), pushing price back into the 99 zone.
In this zone, neither sellers nor buyers have managed to assert dominance—suggesting that these levels may act as a pause or balance point. Given the extended drop, a temporary correction could follow if buyers gain traction after one last push.
For now, the bearish USD narrative remains intact. With upcoming catalysts like China/US talks and tomorrow’s CPI release, a renewed move toward 98 is likely to accelerate.
Whether this leads to further selling or a corrective phase will be assessed afterward.
DXY is turning BULLISH,I'm buying at market open, you should tooTechnically, DXY should retrace from here, range for sometimes, take out liquidity and then continue higher. My DXY post this year has a 99% accuracy. Dont take it lightly.
Now, Dxy had been following a downward trendline since the beginning of this year and I'm seeing a break out soon. Conservative traders can wait for a break and retest but I'm fairly sure we will get it. Enter and add more as the move goes in your favour, stop wasting pips. Dont hold this trade and make only 1k. Add more, compound, not when in loss but when in gain. This will change the game for you.
This means that you should be looking for sell on EURUSD, GBPUSD, AUDUSD et al.
Ya gaziere unu
TP1 @ 99.4
TP2 @ 100.5
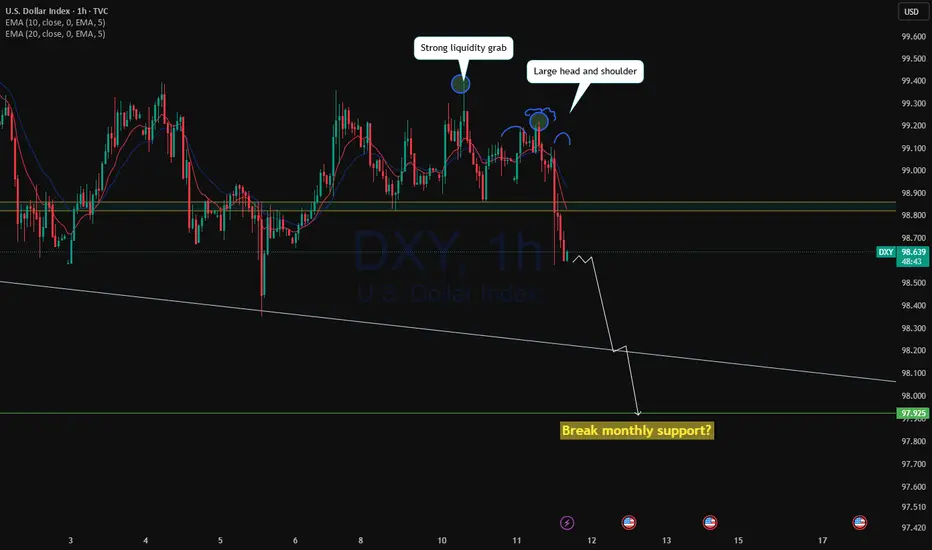
DXY ready for free fall?DXY at 99.39 strong liquidity grab then rejected back to the support level then following a head and shoulder, price completely has broker out of the support with CPI, it has finally managed break out of consolidation.
As the impulse has volume, we may see further drop to the monthly support 97.93 and may potentially break below as there is FVG which may slide the price further down.
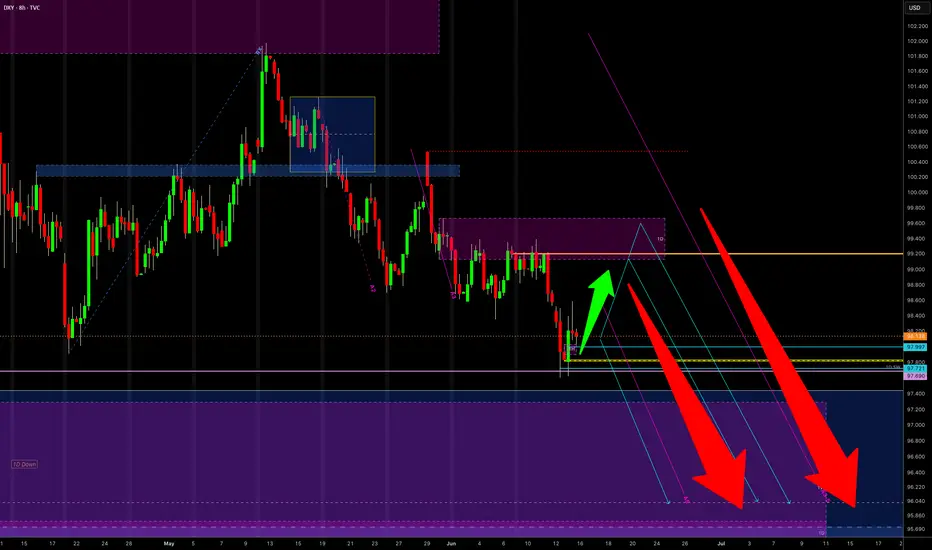
DXY Weekly ForecastDXY Weekly Forecast
- expect short term up move then dont miss the upcoming fall
- again as I said in previous forecast, in any case DXY has to come down to 96.000 level, believe it or not, that’s the target the algorithm aims for.
A Message To Traders:
I’ll be sharing high-quality trade setups for a period time. No bullshit, no fluff, no complicated nonsense — just real, actionable forecast the algorithm is executing. If you’re struggling with trading and desperate for better results, follow my posts closely.
Check out my previously posted setups and forecasts — you’ll be amazed by the high accuracy of the results.
"I Found the Code. I Trust the Algo. Believe Me, That’s It."
Dollar consolidating - Still long term bearishLets see if the Daily Volume imbalance can hold price lower here. If it breaks higher then the clean highs will be a target for a sweep then return lower again. FOMC Tomorrow!! Stay safe

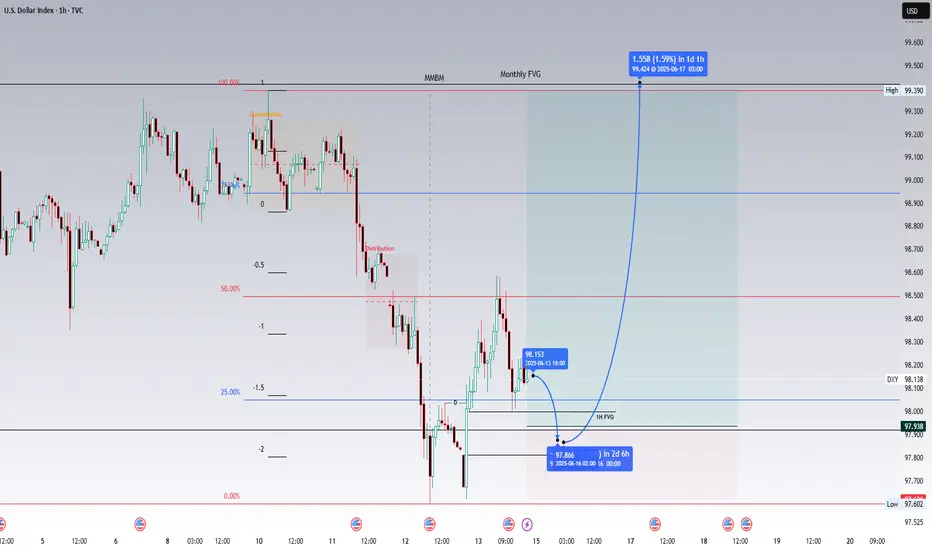
Potential bullish scenario formulating for DXY. Target: 99.418.Higher timeframe analysis
Thursday, 12 June 2025 saw the DXY take out the monthly low of 97.921. This poses the bearish monthly FVG as an immediate draw on liquidity at 99.418. Warranting a bullish bias till this level.
Intermediate timeframe analysis
This bullish bias is further confirmed by an initial consolidation identified on the 1H chart immediately below the said monthly FVG. This is a signature of the formation of a market maker buy model. Note the displacement to the updside which occurred at 21:00 EST leaving behind a bullish fair value gap on the 1H. This signals the beginning of the buyside of the curve of a market maker buy model.
Scenario
A potential long scenario could play out whereby price could respect the bullish 1H FVG at 97.999 and reprice updwards towards 99.418. I suspect that the target could be reached by Tuesday morning at 2:00 am - 3:30 am EST, though this is merely an estimation at best. This analysis is largely dependent on the reaction of price in the weekly open. Though in the event of a non-volatile market open this analysis holds decent probability.
Alternate Scenario
Should the above analysis fail the relative equal lows at 97.602 could be taken out before upside to 99.418 is seen.
Dollar Index Analysis: Compression, Divergence, Breakout?Greetings to the TradingView community, here's a detailed look at DXY where technical structure and macro context may be hinting at a shift.
Dollar Index (DXY) Approaching Key Breakout | Bullish Divergence and Macro Shifts in Focus
The U.S. Dollar Index (DXY) is currently approaching a structurally important juncture where technical compression is intersecting with potential macroeconomic shifts. Over the past several months, DXY has remained in a well defined downtrend, consistently printing lower highs and lower lows. However, the recent price action reveals signs of exhaustion in bearish momentum, opening the door for a potential trend reversal or a meaningful corrective rally.
Technically the index has been trading within a broad descending wedge pattern since late 2024. This structure, often interpreted as a bullish reversal formation, is now nearing its apex. Price has been hugging the upper boundary of the pattern a descending trendline that has acted as dynamic resistance and appears to be preparing for a possible breakout. Each subsequent test of this trendline has occurred with less momentum on the downside, a common precursor to a breakout when price compresses tightly within narrowing ranges.
More importantly, momentum indicators are beginning to diverge from price. The Relative Strength Index (RSI 14), for instance, is forming a series of higher lows while price continues to record lower lows. This bullish divergence is a classic signal that downside pressure is weakening and that buyers may be gradually absorbing supply. Divergence of this nature, especially in confluence with trendline resistance, often leads to a shift in price behavior.
A key horizontal level to monitor remains 101.75, which has historically acted as a strong resistance zone. This level marked the previous breakout rejection and coincides with the mid-range structure of the wedge. A sustained close above this zone would effectively break the prevailing lower-high formation and could signal a shift in market structure toward a more neutral or even bullish bias.
In terms of projected targets, if a breakout confirms, the logical areas to watch would be the previous swing highs from the downtrend. These include levels in the 102.50 to 104.00 range, where the market has previously paused or reversed. These prior lower highs may now act as resistance on the way up and can be used as checkpoints to gauge the strength of any bullish follow-through.
From a macroeconomic perspective, several factors could support or accelerate such a breakout. Recent U.S. inflation data has shown signs of softening, with both Consumer Price Index (CPI) and Producer Price Index (PPI) prints coming in below expectations. This has increased market speculation that the Federal Reserve may pivot toward a more accommodative stance later in the year. Although the Fed has not confirmed any immediate easing, market expectations around rate cuts are beginning to influence bond yields and, by extension, the dollar.
However, it’s also worth noting that monetary policy divergence among global central banks remains an important theme. While the Fed may lean toward caution, the European Central Bank and the Bank of England are facing their own unique inflationary challenges, which could either reinforce or limit relative dollar weakness. In such an environment, if other central banks appear more dovish than the Fed, it could provide relative strength to the dollar index.
Geopolitical uncertainty and equity market volatility are also important to consider. The dollar has historically acted as a safe-haven asset in times of global distress. If geopolitical tensions escalate or global risk sentiment weakens, capital flows into the dollar may accelerate regardless of interest rate trajectories.
In conclusion, the current DXY setup is a technically rich and macro-sensitive zone where price compression, bullish RSI divergence, and policy shifts are aligning. While confirmation is still needed, particularly via a breakout above the descending trendline and the 101.75 level, the probability of a structural shift is increasing. This setup is not a trading recommendation but rather an important chart to watch for clues about future dollar direction and its cascading impact on global FX pairs, commodities, and broader market sentiment.
Thanks for reading hope you like this publication.
Regards- Amit.

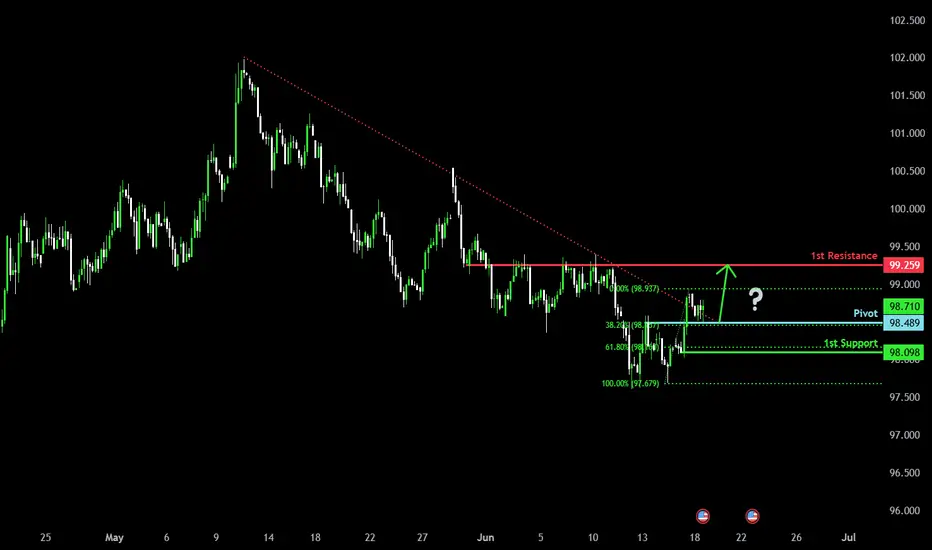
Bullish bounce?US Dollar Index (DXY) is reacting off the pivot and could rise to the 1st resistance.
Pivot: 98.48
1st Support: 98.09
1st Resistance: 99.25
Risk Warning:
Trading Forex and CFDs carries a high level of risk to your capital and you should only trade with money you can afford to lose. Trading Forex and CFDs may not be suitable for all investors, so please ensure that you fully understand the risks involved and seek independent advice if necessary.
Disclaimer:
The above opinions given constitute general market commentary, and do not constitute the opinion or advice of IC Markets or any form of personal or investment advice.
Any opinions, news, research, analyses, prices, other information, or links to third-party sites contained on this website are provided on an "as-is" basis, are intended only to be informative, is not an advice nor a recommendation, nor research, or a record of our trading prices, or an offer of, or solicitation for a transaction in any financial instrument and thus should not be treated as such. The information provided does not involve any specific investment objectives, financial situation and needs of any specific person who may receive it. Please be aware, that past performance is not a reliable indicator of future performance and/or results. Past Performance or Forward-looking scenarios based upon the reasonable beliefs of the third-party provider are not a guarantee of future performance. Actual results may differ materially from those anticipated in forward-looking or past performance statements. IC Markets makes no representation or warranty and assumes no liability as to the accuracy or completeness of the information provided, nor any loss arising from any investment based on a recommendation, forecast or any information supplied by any third-party.
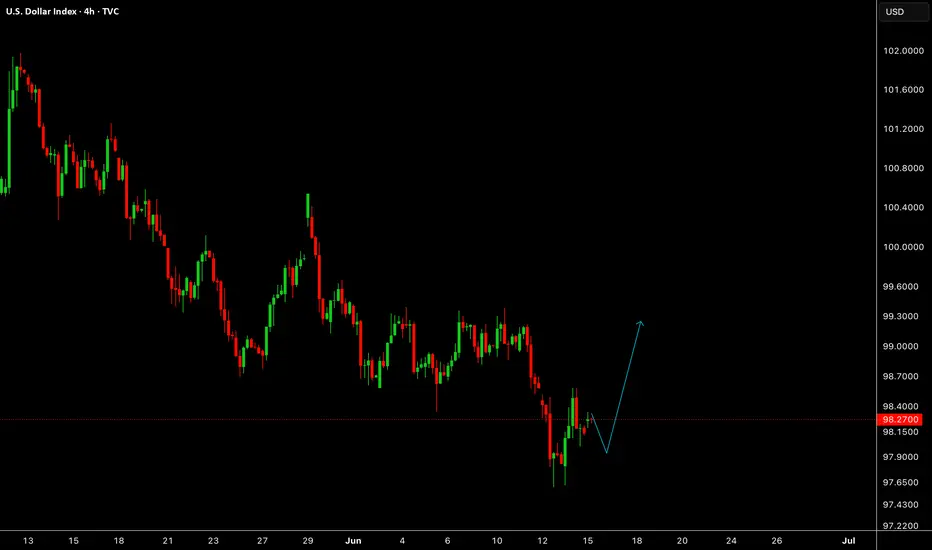
DXYWe are expecting DXY to give us bullishness in this week first.
Disclosure: We are part of Trade Nation's Influencer program and receive a monthly fee for using their TradingView charts in our analysis.
DXY ready for takeoffDXY seems to have reached the bottom for now, as planned within the marked red timezone. I expect a bullish run until October (blue timezone) with target around 111-113 USD, which corresponds to 2-2.5 stdv from this last manipulation leg lower. All areas marked in chart.

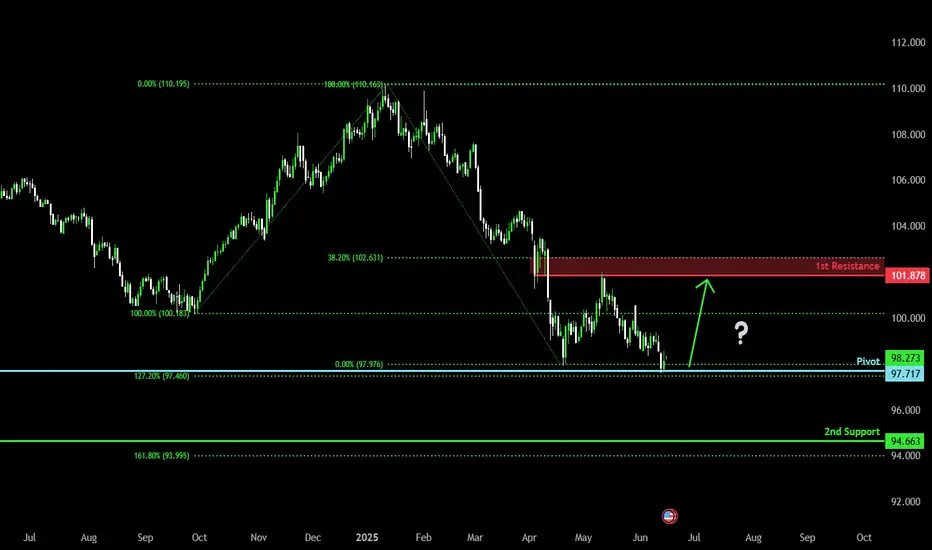
Could the DXY reverse from here?The price is reacting off the pivot and could rise to the 1st resistance which is an overlap resistance.
Pivot: 97.71
1st Support: 94.66
1st Resistance: 101.87
Risk Warning:
Trading Forex and CFDs carries a high level of risk to your capital and you should only trade with money you can afford to lose. Trading Forex and CFDs may not be suitable for all investors, so please ensure that you fully understand the risks involved and seek independent advice if necessary.
Disclaimer:
The above opinions given constitute general market commentary, and do not constitute the opinion or advice of IC Markets or any form of personal or investment advice.
Any opinions, news, research, analyses, prices, other information, or links to third-party sites contained on this website are provided on an "as-is" basis, are intended only to be informative, is not an advice nor a recommendation, nor research, or a record of our trading prices, or an offer of, or solicitation for a transaction in any financial instrument and thus should not be treated as such. The information provided does not involve any specific investment objectives, financial situation and needs of any specific person who may receive it. Please be aware, that past performance is not a reliable indicator of future performance and/or results. Past Performance or Forward-looking scenarios based upon the reasonable beliefs of the third-party provider are not a guarantee of future performance. Actual results may differ materially from those anticipated in forward-looking or past performance statements. IC Markets makes no representation or warranty and assumes no liability as to the accuracy or completeness of the information provided, nor any loss arising from any investment based on a recommendation, forecast or any information supplied by any third-party.
DXY Potential DownsidesHey Traders, in today's trading session we are monitoring DXY for a selling opportunity around 99.300 zone, DXY is trading in a downtrend and currently is in a correction phase in which it is approaching the trend at 99.300 support and resistance area.
Trade safe, Joe.

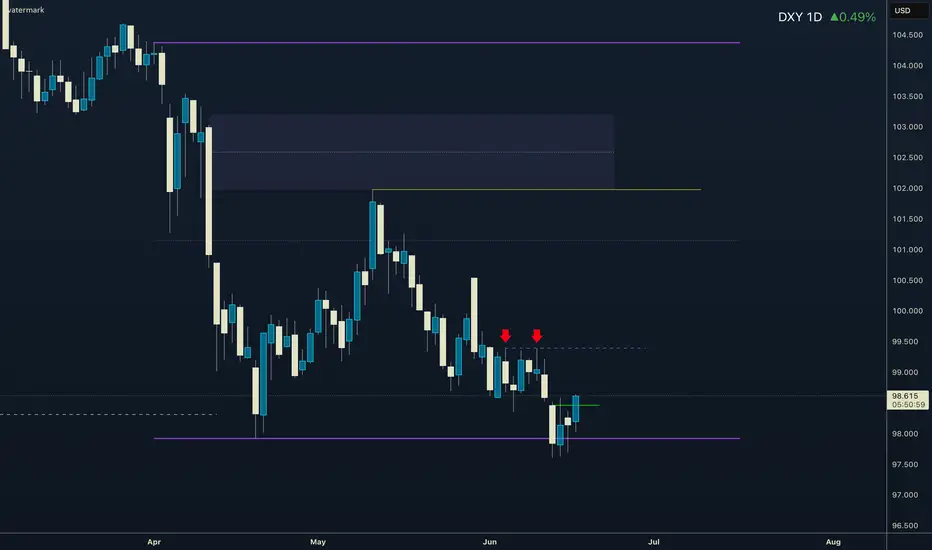
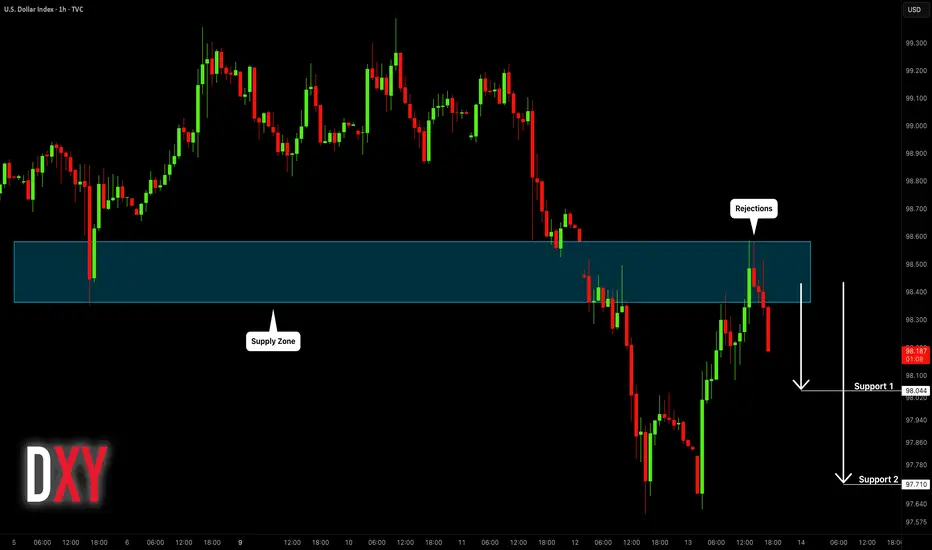
DOLLAR INDEX (DXY): Bearish Again?!
Dollar Index leaves clear bearish clues after a test
of a significant intraday/daily supply area.
I think that the market will continue falling at reach at least 98.04 level.
❤️Please, support my work with like, thank you!❤️
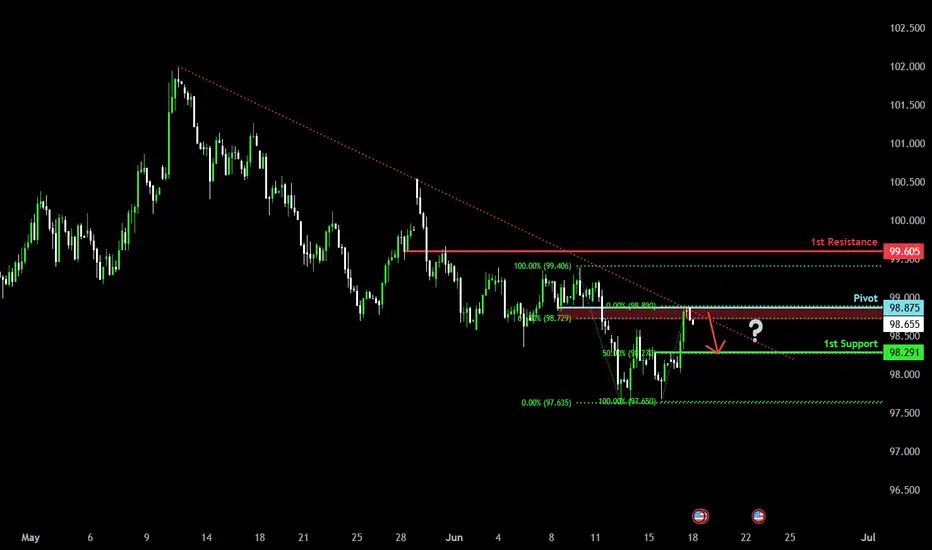
Bearish reversal?US Dollar Index (DXY) has reacted off the pivot and could drop to the 1st support.
Pivot: 98.89
1st Support: 98.29
1st Resistance: 99.60
Risk Warning:
Trading Forex and CFDs carries a high level of risk to your capital and you should only trade with money you can afford to lose. Trading Forex and CFDs may not be suitable for all investors, so please ensure that you fully understand the risks involved and seek independent advice if necessary.
Disclaimer:
The above opinions given constitute general market commentary, and do not constitute the opinion or advice of IC Markets or any form of personal or investment advice.
Any opinions, news, research, analyses, prices, other information, or links to third-party sites contained on this website are provided on an "as-is" basis, are intended only to be informative, is not an advice nor a recommendation, nor research, or a record of our trading prices, or an offer of, or solicitation for a transaction in any financial instrument and thus should not be treated as such. The information provided does not involve any specific investment objectives, financial situation and needs of any specific person who may receive it. Please be aware, that past performance is not a reliable indicator of future performance and/or results. Past Performance or Forward-looking scenarios based upon the reasonable beliefs of the third-party provider are not a guarantee of future performance. Actual results may differ materially from those anticipated in forward-looking or past performance statements. IC Markets makes no representation or warranty and assumes no liability as to the accuracy or completeness of the information provided, nor any loss arising from any investment based on a recommendation, forecast or any information supplied by any third-party.
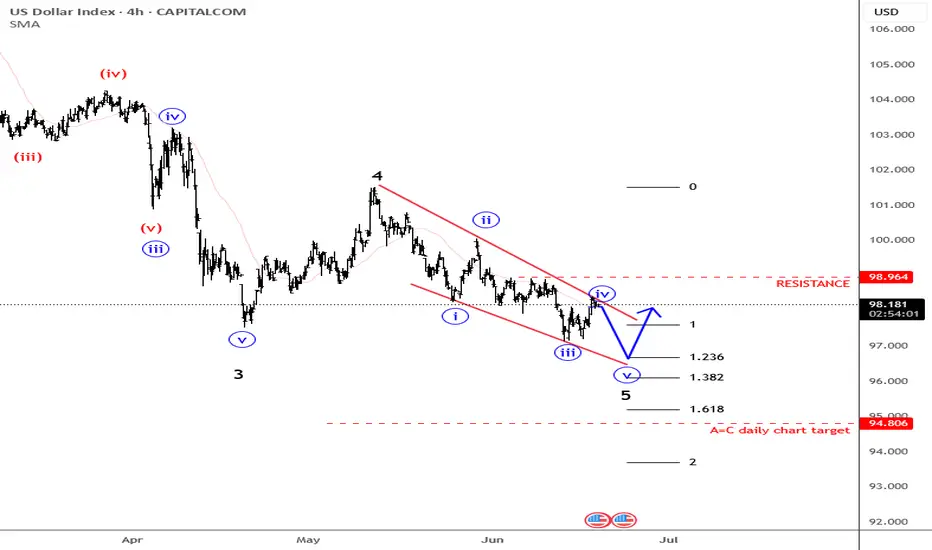
Dollar In Fifth Wave-Reversal In Trend May Not Be Far Away.The Fed will announce its latest policy decision later, and expectations are that Powell will keep rates on hold, especially after last week's slightly higher inflation print and still solid US jobs data. We can see some stabilization in the US dollar ahead of this event, but we have to keep an eye on geopolitical tensions in the Middle East, which coudl also play a key role in driving safe haven flows.
Meanwhile, the stock market continues to trade sideways, and I don't expect any major breakouts or strong moves ahead of the Fed. Also, tomorrow is a holiday in the US, so that could contribute to slower market conditions into the end of the week, unless, of course, the situation in the Middle East gets worse.
Looking at the DXY waves structure, I see athree-wave move from the most recent lows, so the fourth wave I highlighted a few days ago could now be approaching completion near this week’s key resistance around the 99 level. That’s definitely a level to watch for a potential fresh, but possibly final sell-off toward new lows around 97, maybe even 96.
That’s where the DXY could stabilize, as ending diagonal pattern signals that we are likely in the late stages of wave five, meaning this bearish cycle could soon come to an end.
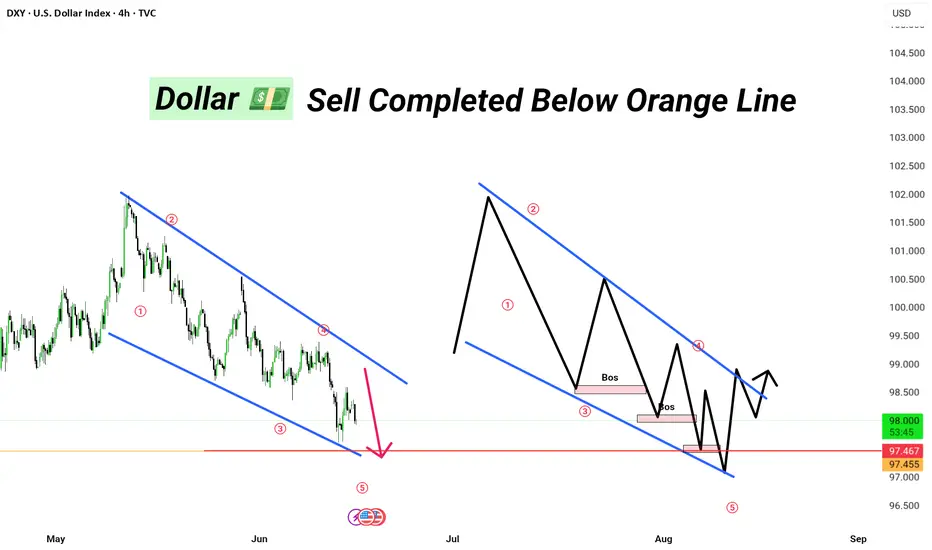
DXY ||| • Sell Completed Below Orange Line📉 Pair: GBP/USD
⏱ Timeframe: 4H
🔶 Orange Line = Major S/R Zone
📌 Confirmed Break + Retest
🎯 Profit Locked | Risk Managed
Strategy: Elliott Wave + Parallel Channel + SMC (Break of Structure)
🔶 Status:
Completed Wave 5 inside falling wedge
Sell executed after orange support break
Anticipating accumulation phase > BOS > bullish reversal
📍Key Zones:
Demand zone near 97.455
Resistance near 98.426
🎯 Next Steps: Looking for bullish structure post BOS + Wave 2 pullback.
🔁 Watch for:
Accumulation near lower trendline
Structure shift > Breakout of wedge
Long confirmations in late July – early August
🟢 Plan the trade, trade the plan.
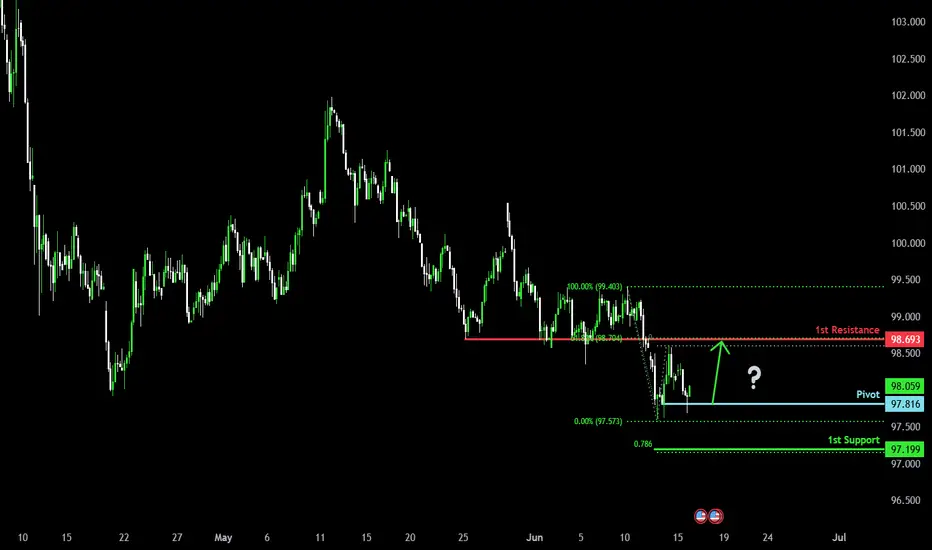
Bullish bounce?USD Dollar Index (DXY) has bounced off the pivot and could rise to the 1st resistance.
Pivot: 97.81
1st Support: 97.19
1st Resistance: 98.69
Risk Warning:
Trading Forex and CFDs carries a high level of risk to your capital and you should only trade with money you can afford to lose. Trading Forex and CFDs may not be suitable for all investors, so please ensure that you fully understand the risks involved and seek independent advice if necessary.
Disclaimer:
The above opinions given constitute general market commentary, and do not constitute the opinion or advice of IC Markets or any form of personal or investment advice.
Any opinions, news, research, analyses, prices, other information, or links to third-party sites contained on this website are provided on an "as-is" basis, are intended only to be informative, is not an advice nor a recommendation, nor research, or a record of our trading prices, or an offer of, or solicitation for a transaction in any financial instrument and thus should not be treated as such. The information provided does not involve any specific investment objectives, financial situation and needs of any specific person who may receive it. Please be aware, that past performance is not a reliable indicator of future performance and/or results. Past Performance or Forward-looking scenarios based upon the reasonable beliefs of the third-party provider are not a guarantee of future performance. Actual results may differ materially from those anticipated in forward-looking or past performance statements. IC Markets makes no representation or warranty and assumes no liability as to the accuracy or completeness of the information provided, nor any loss arising from any investment based on a recommendation, forecast or any information supplied by any third-party.
Bullish bounce?US Dollar Index (DXY) is falling towards the pivot and could bounce to the 1st resistance.
Pivot: 98.48
1st Support: 97.62
1st Resistance: 99.47
Risk Warning:
Trading Forex and CFDs carries a high level of risk to your capital and you should only trade with money you can afford to lose. Trading Forex and CFDs may not be suitable for all investors, so please ensure that you fully understand the risks involved and seek independent advice if necessary.
Disclaimer:
The above opinions given constitute general market commentary, and do not constitute the opinion or advice of IC Markets or any form of personal or investment advice.
Any opinions, news, research, analyses, prices, other information, or links to third-party sites contained on this website are provided on an "as-is" basis, are intended only to be informative, is not an advice nor a recommendation, nor research, or a record of our trading prices, or an offer of, or solicitation for a transaction in any financial instrument and thus should not be treated as such. The information provided does not involve any specific investment objectives, financial situation and needs of any specific person who may receive it. Please be aware, that past performance is not a reliable indicator of future performance and/or results. Past Performance or Forward-looking scenarios based upon the reasonable beliefs of the third-party provider are not a guarantee of future performance. Actual results may differ materially from those anticipated in forward-looking or past performance statements. IC Markets makes no representation or warranty and assumes no liability as to the accuracy or completeness of the information provided, nor any loss arising from any investment based on a recommendation, forecast or any information supplied by any third-party.
