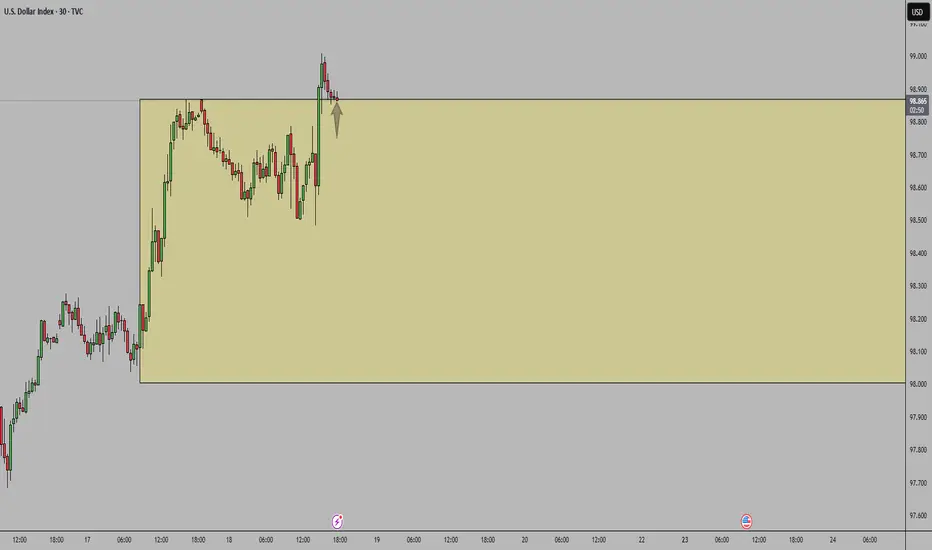
Dollar on the move now after the news - as expectedQuick follow up on other videos
Dollar is heading strong towards our target as outlined for the last few weeks. If you followed all my videos you would see where markey technicals came into play the last few weeks
Beautiful read on this
USDX trade ideas

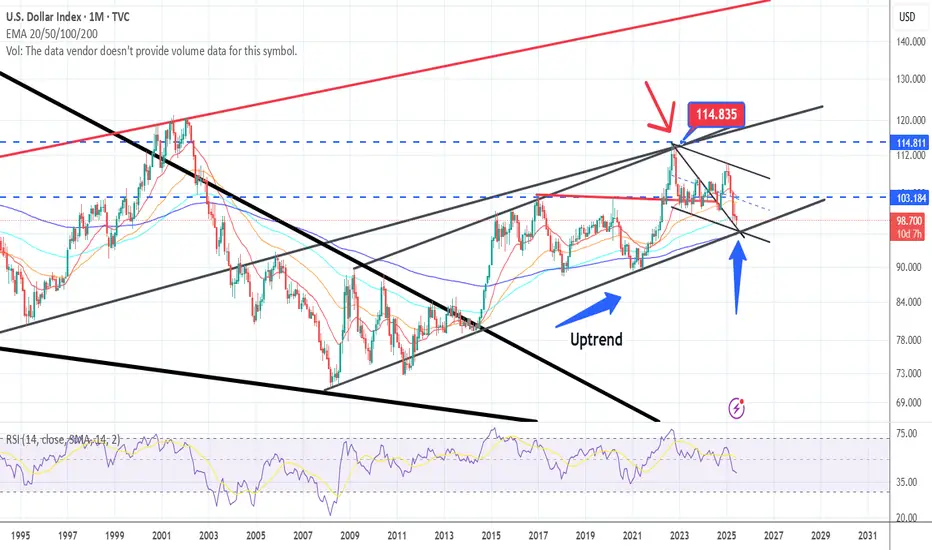
U.S. Dollar Index (DXY) Weekly 2025Summary:
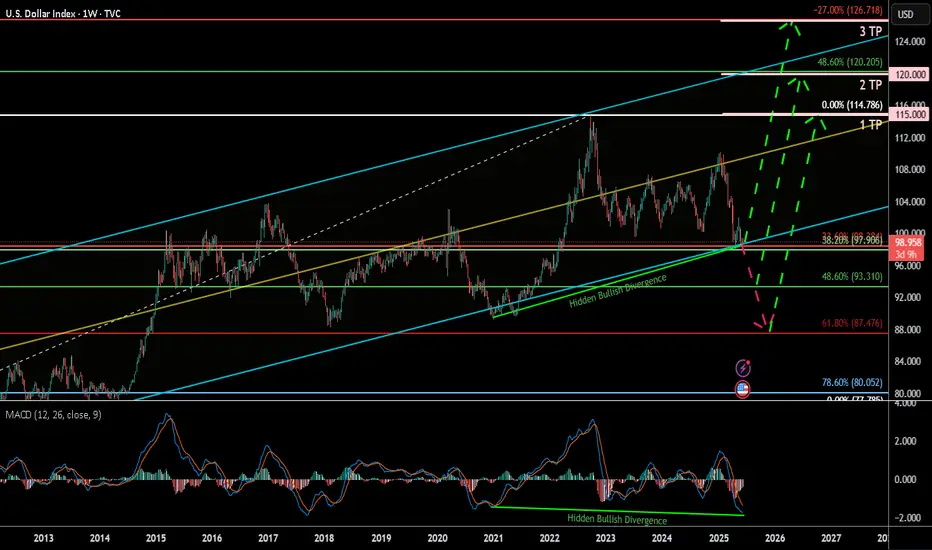
The U.S. Dollar Index (DXY) has corrected down to the key 38.60% Fibonacci retracement zone and is currently showing signs of a potential bullish reversal, bolstered by a clear hidden bullish divergence on the MACD. This may signal a renewed rally toward key upside targets, especially if the 93.3–99.9 support Zone holds.
Chart Context:
Current Price: 98.864
Key Fib Support: 38.60% @ 99.906, 48.60% @ 93.310, 61.80% @ 87.476
Support Zone: 93.3–99.9 USD
Hidden Bullish Divergence: Observed both in 2021 and now again in 2025 on the MACD
Trendline Support: Long-term ascending trendline holding since 2011
Fib Extension Targets (Trend-Based):
TP1: 115.000
TP2: 120.000
TP3: 126.666
Key Technical Observations:
Fibonacci Confluence: DXY is bouncing from a strong Fib cluster between 93.310 and 99.906, historically acting as a reversal zone.
Hidden Bullish Divergence: Suggests potential upside despite price weakness.
Downtrend Retest: Price may revisit 93.3–87.4 before confirming full reversal.
Breakout Pathway: Green dashed arrows outline the likely recovery trajectory toward 114–126 range.
Indicators:
MACD: Showing hidden bullish divergence and potential signal crossover.
Trendline Support: Holding intact from 2021 low.
Fib Levels: Used for retracement and trend-based extension.
Fundamental Context:
Interest Rate Outlook: If U.S. inflation remains controlled and Fed signals future hikes or sustained high rates, DXY strength may persist.
Global Liquidity & Recession Risk: If risk aversion returns, the dollar may rise as a safe haven.
Geopolitical Risks: Conflicts, trade tensions, or BRICS dedollarization efforts may create volatility.
Our Recent research suggests the Fed may maintain higher-for-longer rates due to resilient labor markets and sticky core inflation. This supports bullish USD bias unless macro shifts rapidly.
Why DXY Could Continue Strengthening:
Robust U.S. economic performance & monetary policy divergence
U.S. GDP growth (~2.7% in 2024) outpaces developed peers (~1.7%), supporting stronger USD
The Fed maintains restrictive rates (4.25–4.50%), while the ECB pivots to easing, widening the policy and yield gap .
Inflation resilience and Fed hawkishness
Labor markets remain tight, keeping inflation “sticky” and delaying expected rate cuts; market-implied cuts for 2025 have been pushed into 2026
Fed officials (e.g. Kugler) emphasize ongoing tariff-driven inflation, suggesting rates will stay elevated.
Safe-haven and yield-seeking capital flows
With global risks, capital favors USD-denominated assets for yield and stability
Why the Dollar Might Face Headwinds
Fiscal expansion & trade uncertainty
Ballooning U.S. deficits (~$3.3 trn new debt) and erratic tariff policy undermine confidence in USD
Wall Street’s consensus bearish position.
Major banks largely expect a weaker dollar through 2025–26. However, this crowded bearish sentiment poses a risk of a sharp rebound if data surprises occur
barons
Tariff policy risks
Trump's new tariffs could dampen dollar demand—yet if perceived as fiscal stimulus, they could unexpectedly buoy the USD .
Synthesis for Our Biases
A bullish DXY thesis is well-supported by:
Economic and policy divergence (U.S. growth + Fed vs. peers).
Hawkish Fed commentary and sticky inflation.
Safe-haven capital inflows.
Conversely, risks include:
Deteriorating fiscal/trade dynamics.
Potential Fed pivot once inflation shows clear decline.
A consensus that could trigger a short squeeze or reversal if overstretched.
Philosophical / Narrative View:
The dollar remains the world’s dominant reserve currency. Periodic dips often act as strategic re-accumulation phases for institutional capital—especially during global macro uncertainty. A return toward 120+ reflects this persistent demand for USD liquidity and safety.
Bias & Strategy Implication:
1. Primary Bias: Bullish, contingent on support at 93.3–99.9 holding.
2. Risk Scenario: Breakdown below 93.3 invalidates bullish thesis and targets 87.4–80 zones.
Impact on Crypto & Gold and its Correlation and Scenarios:
Historically, DXY has had an inverse correlation to both gold and crypto markets. When DXY strengthens, liquidity tends to rotate into dollar-denominated assets and away from risk-on trades like crypto and gold. When DXY weakens, it typically acts as a tailwind for both Bitcoin and gold.
Correlation Coefficients:
DXY vs. Gold: ≈ -0.85 (strong inverse correlation)
DXY vs. TOTAL (crypto market cap): ≈ -0.72 (moderate to strong inverse correlation)
Scenario 1: DXY Rallies toward 115–126 then, Expect gold to correct or stagnate, especially if yields rise. Crypto likely to pull back or remain suppressed unless specific bullish catalysts emerge (e.g., ETF flows or tech adoption).
Scenario 2: DXY ranges between 93–105 then Gold may consolidate or form bullish continuation patterns. Then Crypto may see selective strength, particularly altcoins, if BTC.D declines.
Scenario 3: DXY falls below 93 and toward 87 Then Gold likely to rally, possibly challenging all-time highs. Crypto could enter a major bull run, led by Bitcoin and followed by altcoins, fueled by increased liquidity and lower opportunity cost of holding non-USD assets.
Understanding DXY’s direction provides valuable insight for portfolio positioning in macro-sensitive assets.
Notes & Disclaimers:
This analysis reflects a technical interpretation of the DXY index and is not financial advice. Market conditions may change based on unexpected macroeconomic events, Fed policy, or geopolitical developments.
DXY for short *The content on this analysis is subject to change at any time without notice, and is provided for the sole purpose of assisting traders to make independent investment decisions.
DXY Weekly ForecastDXY Weekly Forecast
A Message To Traders:
I’ll be sharing high-quality trade setups for a period time. No bullshit, no fluff, no complicated nonsense — just real, actionable forecast the algorithm is executing. If you’re struggling with trading and desperate for better results, follow my posts closely.
Check out my previously posted setups and forecasts — you’ll be amazed by the high accuracy of the results.
"I Found the Code. I Trust the Algo. Believe Me, That’s It."

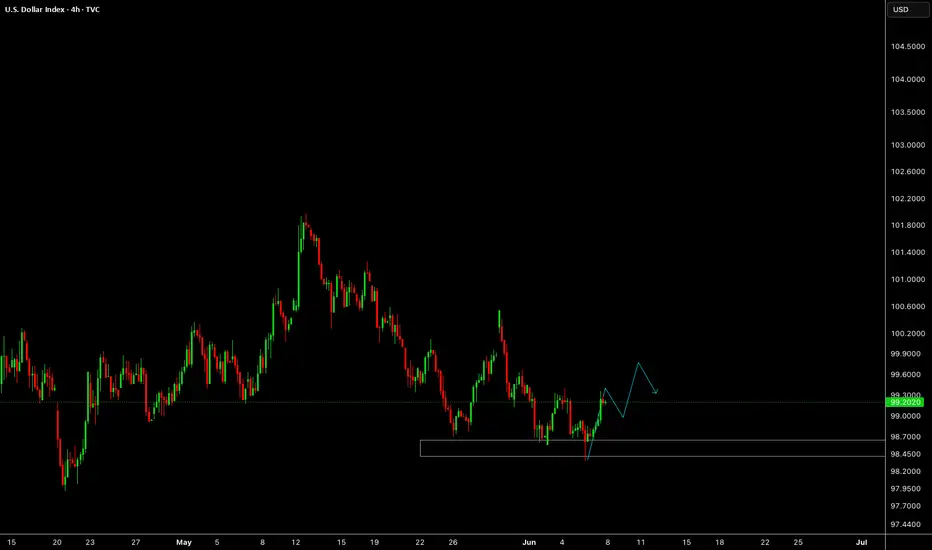
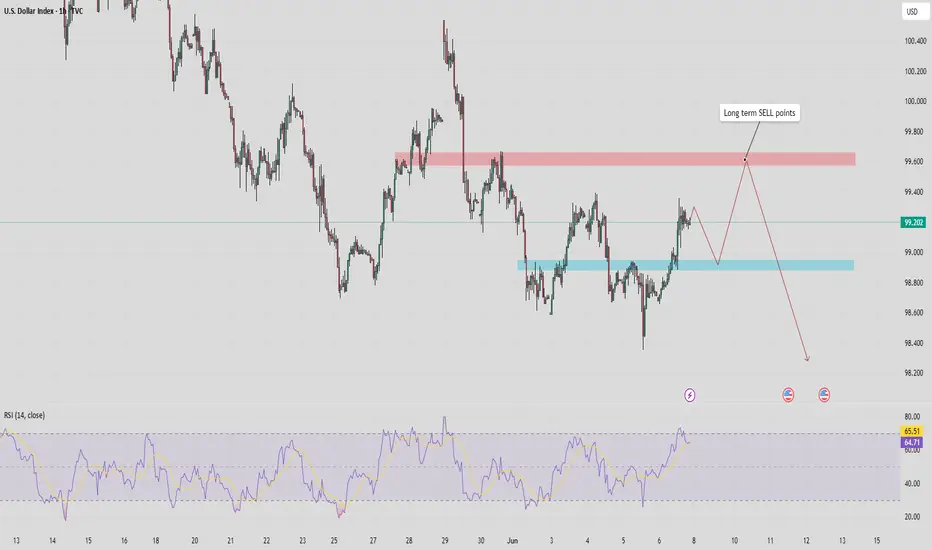
Dollar Still on TargetWe have come back to the NFP high and last weeks high again. Stabbed through them but still below the order block as higlited last week before NFP.
Looking for a run lower now on USD.

DXY reversed upDXY reversed up.
I am assuming the dxy pattern as below, if there is a strong recovery in dxy then gold will fall sharply, I think gold to fall to 3000.

DOLLARThe relationship between the US dollar (USD), the 10-year Treasury bond yield, and bond prices is tightly interconnected and crucial for global markets.
1. 10-Year Bond Yield and Bond Price
Inverse Relationship:
As the yield on the 10-year Treasury rises, the price of the bond falls, and vice versa. This is because the bond’s coupon payment is fixed; when new bonds are issued with higher yields, existing bonds with lower coupons become less attractive, so their prices drop to compensate.
Recent Movement:
In May and early June 2025, the US 10-year Treasury yield rose from 4.18% to around 4.50%, a move of over 30 basis points, driven by strong economic data and expectations that the Federal Reserve will keep rates higher for longer.
2. 10-Year Bond Yield and the Dollar (DXY)
Direct Relationship:
Generally, when the 10-year Treasury yield rises, the US dollar strengthens. Higher yields attract foreign investment into US assets, increasing demand for USD.
Recent Example:
After the stronger-than-expected May jobs report, the 10-year yield jumped to 4.50% from 4.3% on thursday and the dollar index (DXY) also rose, reflecting investor expectations of prolonged high US rates and robust economic performance.
3. Bond Price and the Dollar
When bond prices fall (and yields rise), it often signals expectations for higher interest rates or inflation, both of which tend to support a stronger dollar as investors seek higher returns in USD assets.
Conversely, when bond prices rise (and yields fall), it can indicate economic uncertainty or expectations of rate cuts, which may weaken the dollar.
Key Takeaway
Rising 10-year Treasury yields lead to falling bond prices and typically a stronger US dollar, as higher yields attract global capital seeking better returns.
This dynamic is especially pronounced when strong US economic data or hawkish Fed expectations are in play, as seen in the recent market reaction to the robust US jobs report.
#dxy#dollar #gold

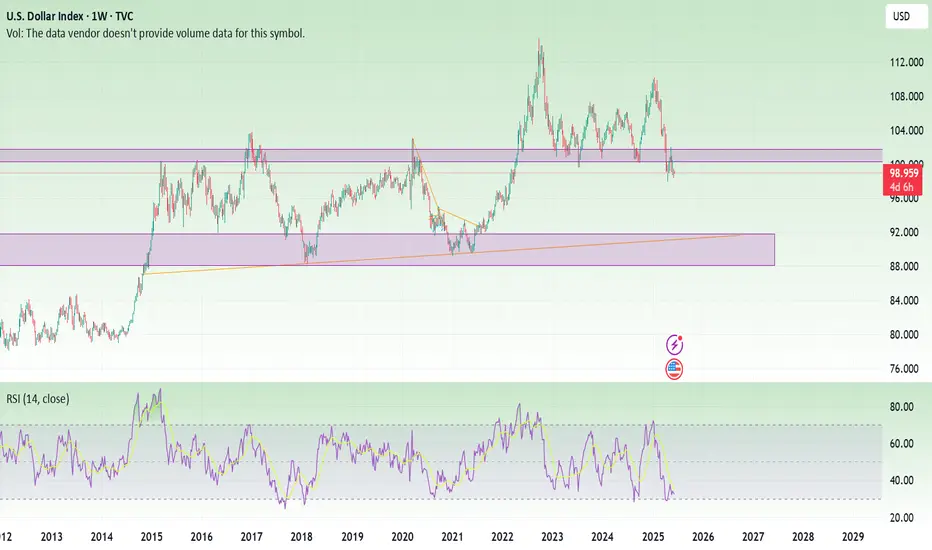
DXY DownHaven't posted here in quite awhile, however just have been following trends watching bonds, stocks and bitcoin/gold. Looking at the DXY it appears to have fallen below the 100-101 level support and has since been rejected by that region on a weekly time frame. The support/resistance levels and trends line within have been charted for years and left unchanged. RSI is in the oversold territory but that can remain low for quite a long time, especially if the trend changes. I think the DXY goes to 90 over the next 6 months to 1 year.
Bullish for stocks, bitcoin, gold etc. Who is the fastest horse?
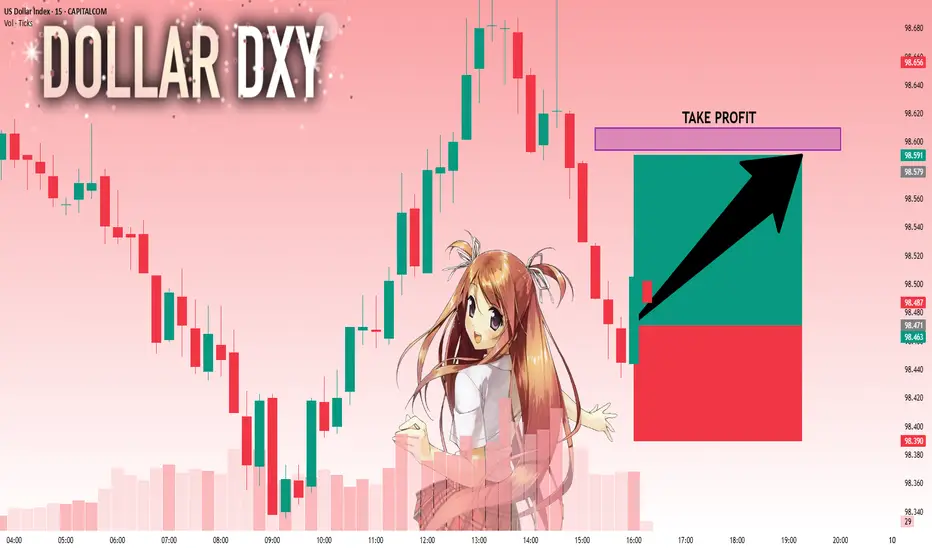
DXY: Target Is Up! Long!
My dear friends,
Today we will analyse DXY together☺️
The market is at an inflection zone and price has now reached an area around 98.471 where previous reversals or breakouts have occurred.And a price reaction that we are seeing on multiple timeframes here could signal the next move up so we can enter on confirmation, and target the next key level of 98.594.Stop-loss is recommended beyond the inflection zone.
❤️Sending you lots of Love and Hugs❤️
Is the dollar's a trend or temporary?📊Technical Analysis for:
🕒 Timeframe:
📈 General Trend:
🔍 Analysis Summary:
We are currently observing a rebound from the 98.400 level.
• Major Support Level:
• Resistance Level:
• Technical Indicators: We note that this correction is due to divergence.
🎯 Suggested Entry and Exit Points:
✅ Entry: Upon a breakout/rebound from
⛔ Stop Loss:
🎯 Targets:
• First Target:
• Second Target:
📌 Recommendation:
– It is recommended to wait for confirmation of the technical signal before making a decision.
🛑 Disclaimer:
This analysis is not considered financial advice or a direct buy or sell recommendation. Do your own research and carefully consider risk management before making any decisions.
📥 Do you agree with this analysis? Share your opinion in the comments!
🔁 Follow me for daily analysis. ICEUS:DX1! ICEUS:DX1!

US DOLLAR MARKET FORECASTA 30 minute change in price delivery bullish is within the 4 hour range.
I sense that the 4 hour higher low is in place, with price drawn to attack the high.

Monday Market Outlook Get ahead of the markets with this week’s essential macro insights! In this session, we break down the most impactful upcoming events affecting DXY, XAUUSD, and BTCUSD — including the FedWatch Tool outlook, yield curve shifts, and how to interpret changing rate expectations. If you want to understand how the macro backdrop could influence your trades, this video is a must-watch.
👉 Learn how to spot opportunities before the move happens.
📉 Rate cut? 📈 Rate hike? 📊 We’ll show you what the market is really pricing in.

DXYWe are expecting Dollar strength this week short term.
Disclosure: We are part of Trade Nation's Influencer program and receive a monthly fee for using their TradingView charts in our analysis.
DXY Analysis Next Week After Market OpenUS tariff policy is becoming a key variable affecting the Fed's interest rate policy. Current tax policies are facing negative reactions and declining support rates, creating pressure on the US government to promote trade agreements and implement tax cuts to stabilize the economy.
At the FOMC monetary policy meeting in May, the Fed kept interest rates unchanged, showing a cautious stance on inflation risks and low unemployment rates. The latest employment figures show that the possibility of the Fed keeping interest rates unchanged at the June meeting is very high.
As inventory accumulation can increase inflation, the Fed will wait for a clearer assessment of the impact of tax policies before making a decision. Accordingly, the possibility of the Fed cutting interest rates up to 3 times in the second half of the year is low.
The US dollar is expected to continue to decline to adjust
Best regards StarrOne !!!
Dollar - Slightly Bullish Short Term but overall bearishDollar
Just expressing my feel on the dollar for the coming week

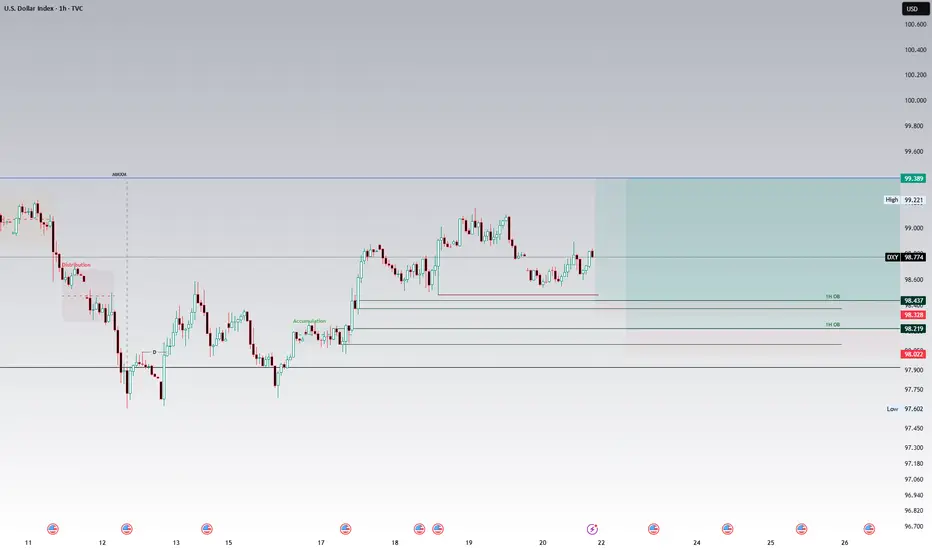
Potential Bullish Scenario for DXY, target objective is 99.392Higher timeframe analysis
As discussed in last week's analysis of the DXY, the higher timeframe draw on liquidity is the bearish monthly Fair value gap set at 101.977. This warrants a higher timeframe bullish bias until this level has been achieved.
Intermediate timeframe analysis
We note the relative equal highs on the daily and 1H chart at 99.392. This serves as a intermediate timeframe draw on liquidity and target objective.
Also note that the buyside of the curve of the market maker buy model has commenced which further fuels bullish sentiment.
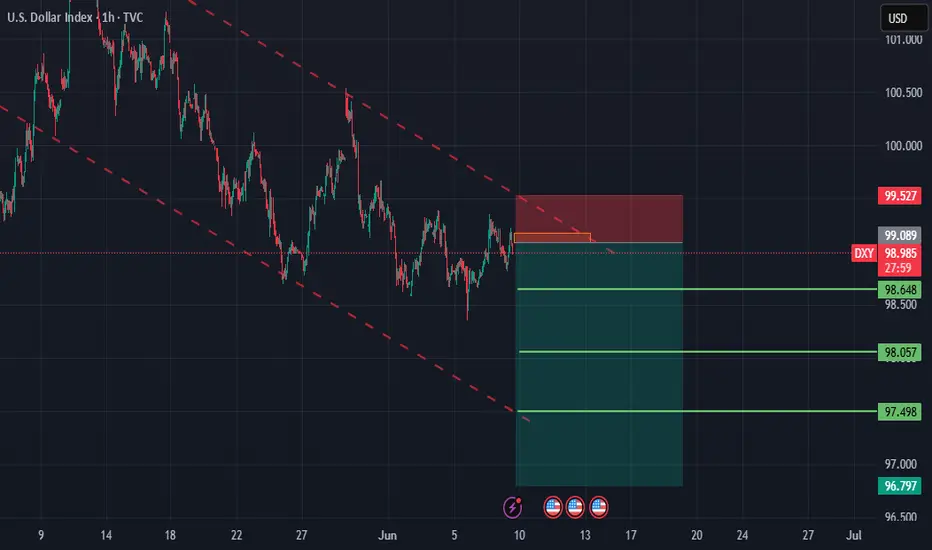
Scenario 1
On the 1H chart, note the relative equal lows at 98.482. These lows are expected to be ran to serve as a liquidity primer for the bullish 1H order block at 98.436 which is expected to be respected and held. This poses a rather handsome risk to reward ratio.
Scenario 2
Should price push past the invalidation point of the bullish 1H order block we could see it head to the bullish 1H order block at the initial accumulation at 98.219. The reward on this setup would make up for the loss of scenario 1.
Disclaimer
The above analysis is intended for educational purposes only and should not be interpreted as financial advice.
DxyWe are currently at the support zone so we have to wait and see what will happen and also consider the coming days candlestick
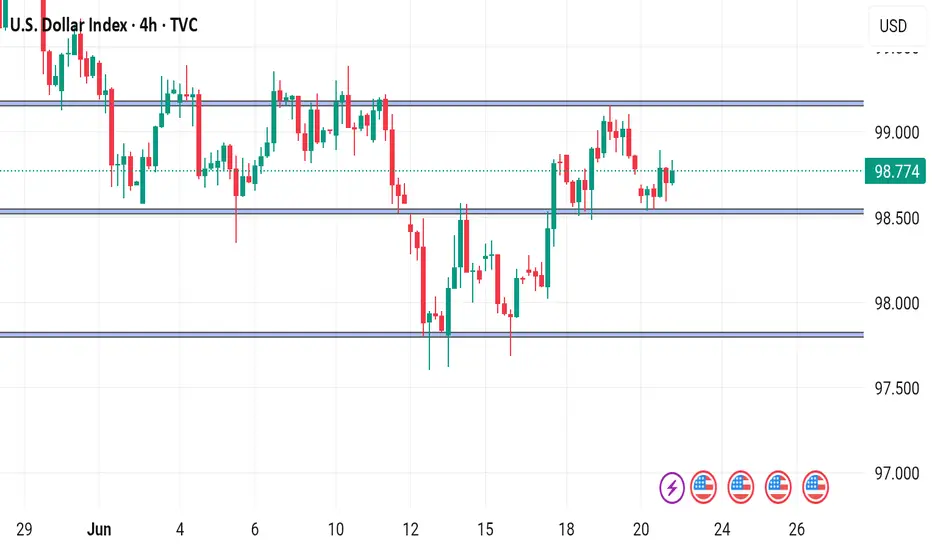
Price action DXY I failed to make a new lower currently bullish yet what it needs is a new low higher to complete the structure the we can start looking for longs

DXY Short Term longAt least that's why the tea leaves say TVC:DXY
RSI positive divergence
Fib support

DXY (bearish?)The herd is completely bearish on the dxy, but the chart is showing something else.
The herd is an amazing indicator
What do we see:
-Still in an uptrend
-the 200 ema (blue line)
-A resistance trendline becoming a support trendline?
-A bull flag, so the under part of the flag
So crossing of those 3 trendlines and the 200 ema is telling me that probably this chart is bullish.
DXYThe DXY shows strong bullish COT sentiment, with traders reducing shorts and increasing longs. It’s currently sitting on a key support level, suggesting a possible bounce.
Watch for bullish price action confirming the move.
Entry: On support hold and reversal signal.
DXY
The net long position by large speculators shows a clear bullish sentiment toward DXY. A +785 increase reflects growing confidence in the dollar, reinforcing that positive outlook continues. Overall Bias: Bullish — speculators remain positive on USD strength.

