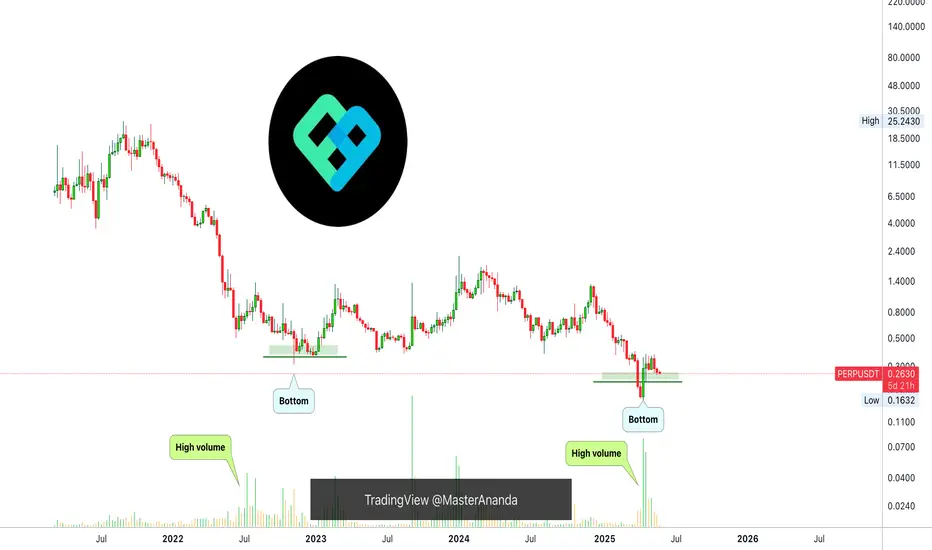
Perpetual Protocol Not Dead Yet (TAC-S7)Doesn't look good. If you follow, you know that I mention the mid-March low and the 3-Feb. low. A bullish reversal signal we've been tracking moves around these levels. When a pair recovers above one of these, or both, after the 7-April crash we take it as bullish.
PERPUSDT looks bad because it is
Long position PERP/USDT.PEntry: 0.24
TP: 0.284
SL: 0.218
R/R: 1:2
Reasons for executing long position:
• Hourly Uptrend & Bullish Market Structure
• Potentially Macd crossover
• RSI Oversold indicating reversal
• 1HR Demand Zone
• Price is located at Discount zone
• Fib OTE
Note: Win is not guaranteed, however, with these


PERPUSDT 1WPERP ~ 1W Analysis
#PERP This trade is very high risk. Buy gradually from here with a short -term target of at least 20%+. This is the lowest support for now.
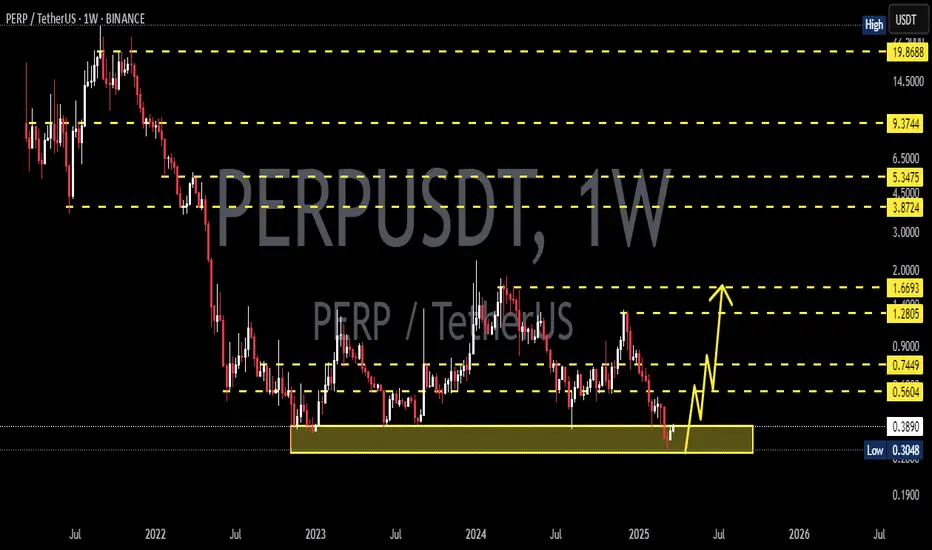
PERPUSDT Trend AnalysisIf you want to add an stoploss simply buy above 0.3 and Sell below 0.3
Perpetual Protocol is a decentralized exchange (DEX) for futures on Ethereum and xDai. Traders can go long or short with up to 10X leverage on a growing number of assets like BTC, ETH, DOT, SNX, YFI and others. Trading is non-cu

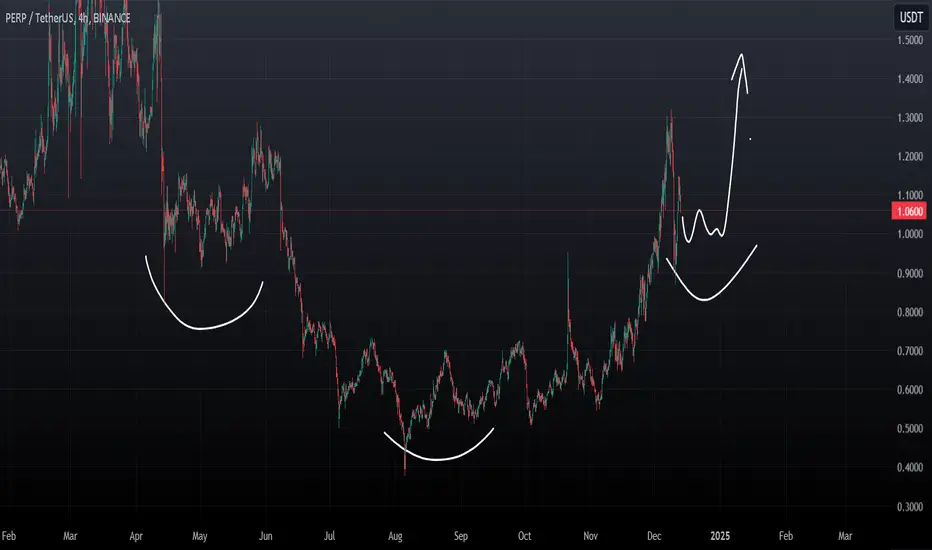
PERP Head and Shoulder PatternAs long as we hold around 0.8 or 0.9 we can see if PERP is creating last shoulder before we takeoff
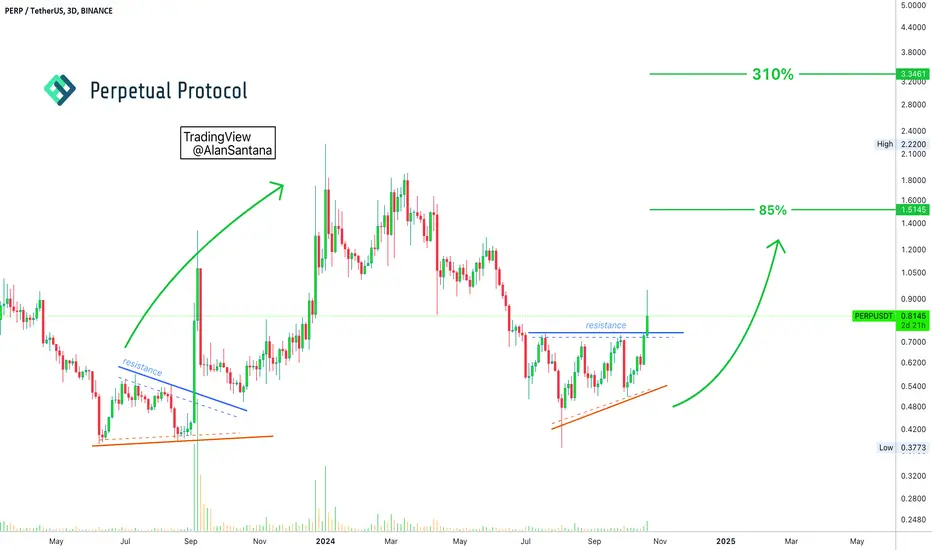
Perpetual Protocol Goes Bullish (85% - 310% Potential)You know, it has been moving for a while but it is still possible to enter. While for us this is not super early, because we tend to enter much sooner (see the PERPBTC post in the 'Related publications' below), conventional traders actually wait for a break of resistance before entering a trade, mea
PERPUSDT | Buy Now, Thank Later | Near Term (4HR)PERPUSDT | Buy Now, Thank Later | Near Term (4HR)
Money flow... BTC, then ETH, then Large Caps, Then Mids and Smalls
Additional altcoin near term and midterm chart ideas listed below
Timeline of events for the Bull Market indicated on chart
TLMUSDT | Buy Now, Thank Later | Near Term (4H

Will PERPUSDT Rebound or Dive Deeper? Critical Levels to Watch!Yello, Paradisers! Will #PERPUSDT rebound from here or continue to plunge? Let’s dive into the current setup
💎#PERP is flashing a bullish signal after breaking out of a falling wedge pattern, a historically bullish structure. The price is now testing the demand zone, and for the upward momentum to

perp in short time According to the past trends in the chart, the following goals for Prep can be concluded.
These goals are displayed in the chart. I hope you check this idea before opening any position. This forecast is just my idea, please check and open a position based on your own strategy. I would be happy to co

See all ideas
Summarizing what the indicators are suggesting.
Oscillators
Neutral
SellBuy
Strong sellStrong buy
Strong sellSellNeutralBuyStrong buy
Oscillators
Neutral
SellBuy
Strong sellStrong buy
Strong sellSellNeutralBuyStrong buy
Summary
Neutral
SellBuy
Strong sellStrong buy
Strong sellSellNeutralBuyStrong buy
Summary
Neutral
SellBuy
Strong sellStrong buy
Strong sellSellNeutralBuyStrong buy
Summary
Neutral
SellBuy
Strong sellStrong buy
Strong sellSellNeutralBuyStrong buy
Moving Averages
Neutral
SellBuy
Strong sellStrong buy
Strong sellSellNeutralBuyStrong buy
Moving Averages
Neutral
SellBuy
Strong sellStrong buy
Strong sellSellNeutralBuyStrong buy
Displays a symbol's price movements over previous years to identify recurring trends.