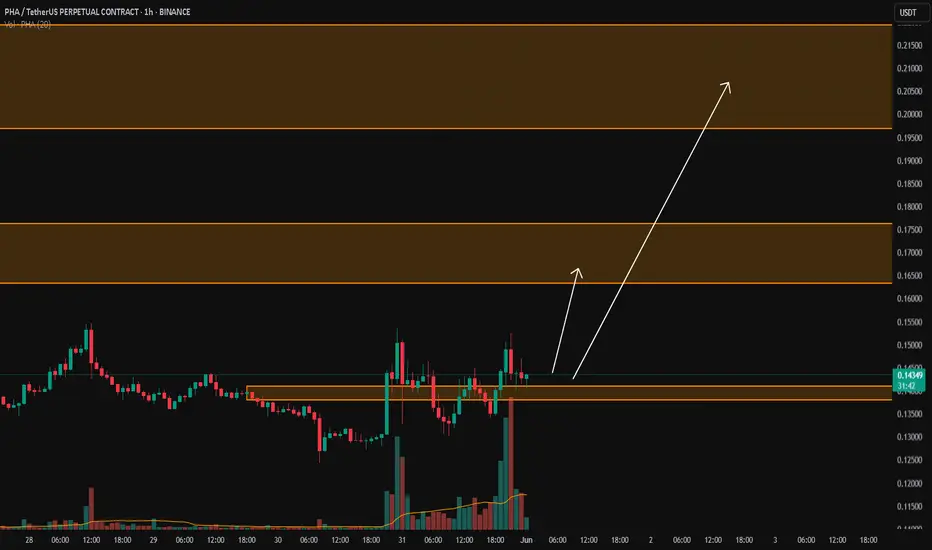
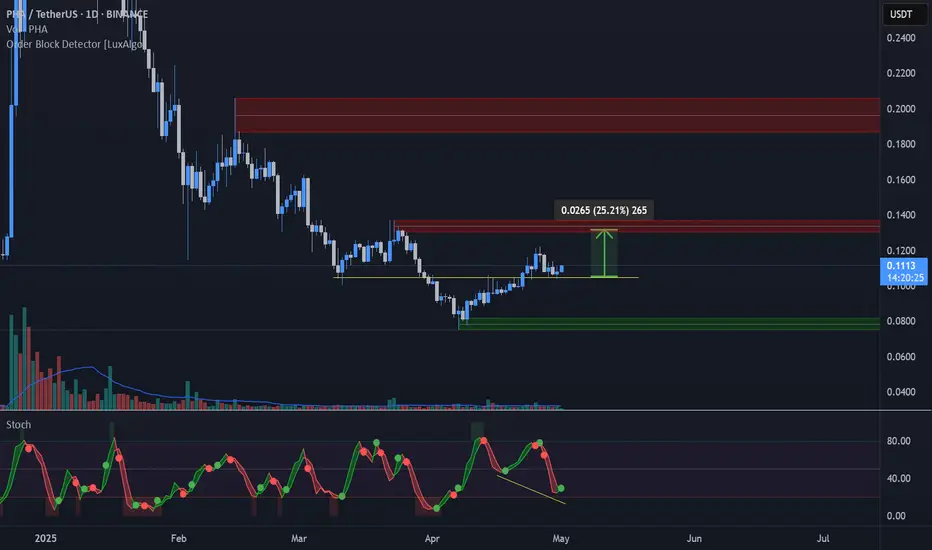
PHA/USDTKey Level Zone: 0.13800 - 0.14100
HMT v8.1 detected. The setup looks promising, supported by a previous upward/downward trend with increasing volume and momentum, presenting an excellent reward-to-risk opportunity.
HMT (High Momentum Trending):
HMT is based on trend, momentum, volume, and market s
PHAUSDT Forming a Bullish Flag PatternPHAUSDT is currently displaying a classic bullish flag pattern on the daily chart, which is often considered a strong continuation signal in technical analysis. After a sharp upward move, the price has entered a consolidation phase within a descending channel—forming the "flag" portion of the patter
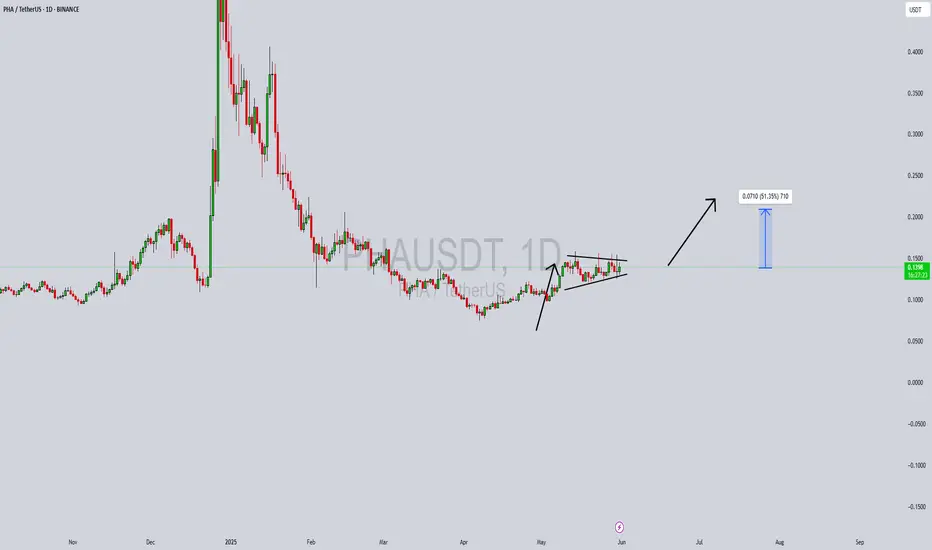
$PHA Buy ideaif it breaks 0.124 levels, we might see 3x from there.
add it to your watch list and monitor.
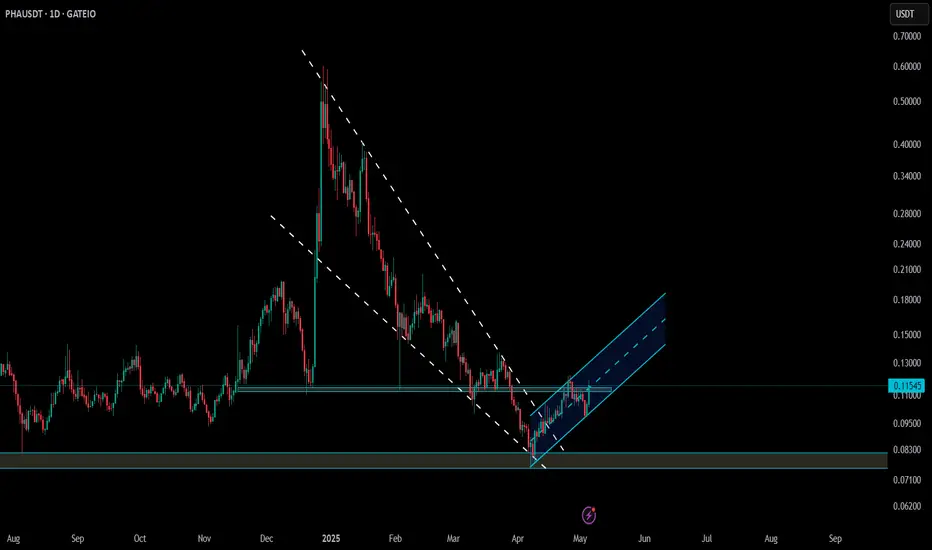
PHA Multi-Timeframe Setup – Reversal in Progress?🚨 PHA Update Across Weekly & Daily Charts!
🧱 Weekly Chart: Price recently bounced from a strong support zone, showing signs of a potential reversal from this critical level.
📈 Daily TF: After breaking out of a falling wedge, PHA is now trending within an ascending parallel channel—a bullish co
PHAUSDT 1D AnalysisPHA ~ 1D Analysis
#PHA Buy when re -testing this support block with a short -term target of at least 10%+ from here.

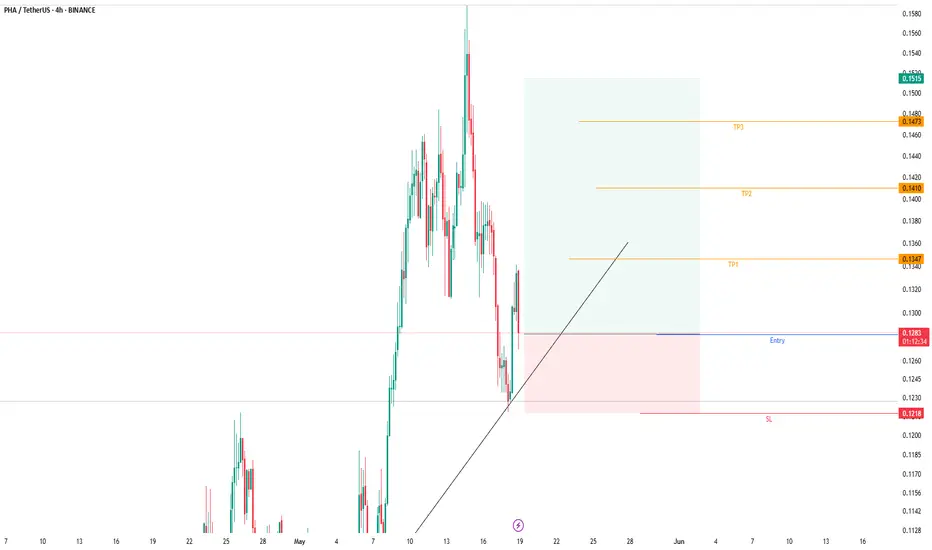
PHA USDTHere is a good and simple setup for PHA. Prioritize preserve your capital and avoid over expectation. It's been awhile since the last I posted. Many invalid calls in my profile. Crypto market moved unexpected to the downside and I was unable to anticipate. All market got liquidated. Cheers to those
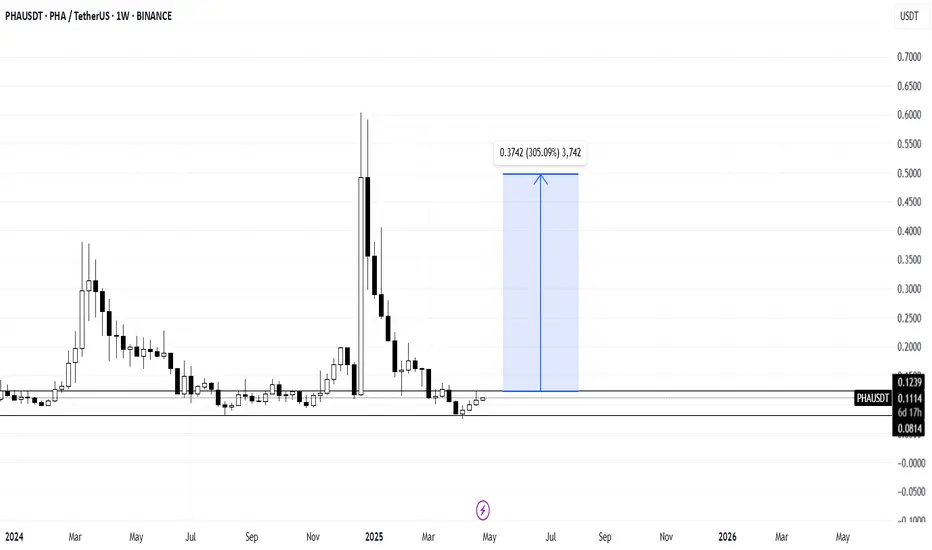
Phala Network 2,400% Profits Potential Target & 2025 Bull MarketThe steepest decline ever for Phala Network just happened between late December '24 and April 2025. This was a really strong correction and broke two long-term support levels, August 2024 and August 2023, just to recover the next week.
This drop activated the market's All-Time Low. A price that was

PHAUSDT 1WPHA ~ 1W Analysis
#PHA Buy back gradually from here with a short -term target of at least 20%+.
This is the lowest support for now.

PHALA : Bullish Momentum can be here soon...Very likely to sweep the low into the OTE + VAL. It will be the ideal scenario though.
LTF structure shift after the sweep of low and I'll be a buyer.

See all ideas
Summarizing what the indicators are suggesting.
Oscillators
Neutral
SellBuy
Strong sellStrong buy
Strong sellSellNeutralBuyStrong buy
Oscillators
Neutral
SellBuy
Strong sellStrong buy
Strong sellSellNeutralBuyStrong buy
Summary
Neutral
SellBuy
Strong sellStrong buy
Strong sellSellNeutralBuyStrong buy
Summary
Neutral
SellBuy
Strong sellStrong buy
Strong sellSellNeutralBuyStrong buy
Summary
Neutral
SellBuy
Strong sellStrong buy
Strong sellSellNeutralBuyStrong buy
Moving Averages
Neutral
SellBuy
Strong sellStrong buy
Strong sellSellNeutralBuyStrong buy
Moving Averages
Neutral
SellBuy
Strong sellStrong buy
Strong sellSellNeutralBuyStrong buy
Displays a symbol's price movements over previous years to identify recurring trends.