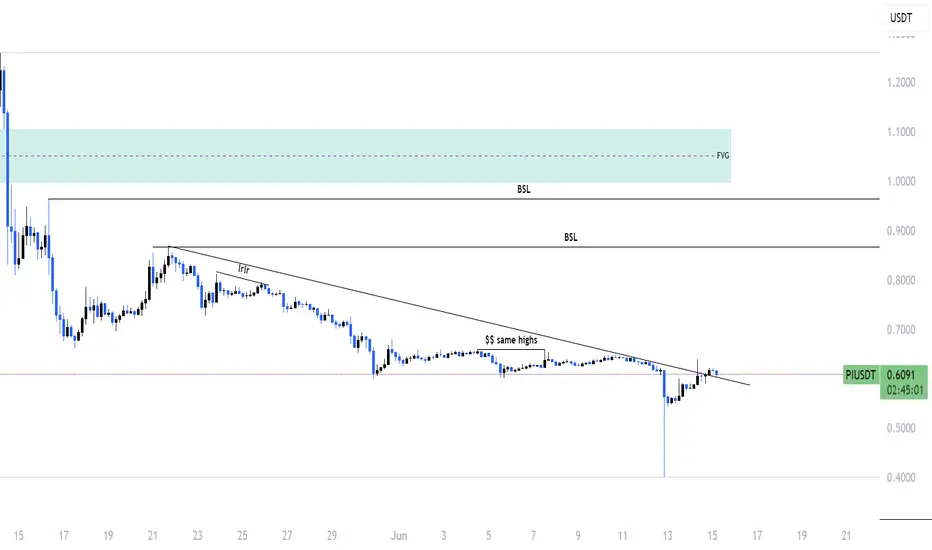
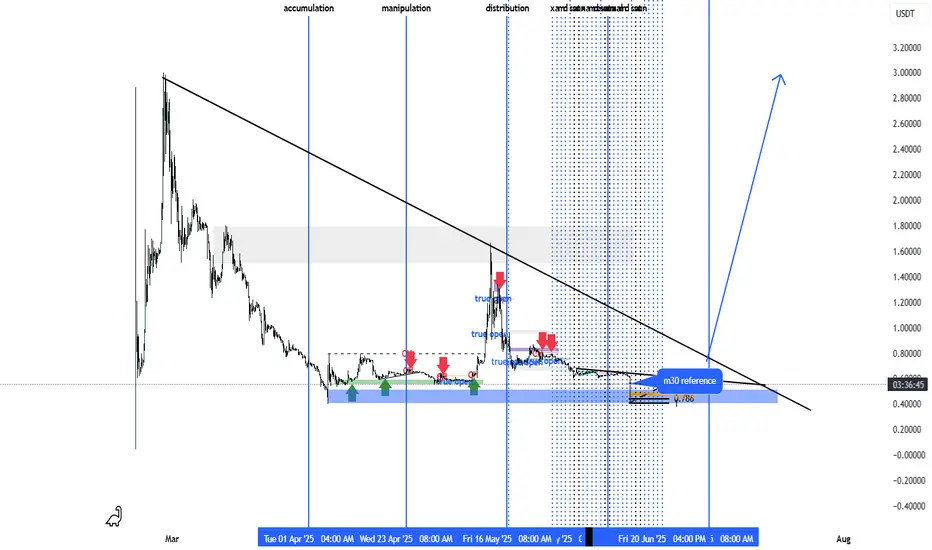
PI breakout !!Trendline Break:
Price has broken above a descending trendline — often a bullish signal.
A small retest is visible, indicating confirmation of the breakout.
Equal Highs (Liquidity Pool):
Labelled “$$ same highs” — this suggests buy-side liquidity is resting above that level.
Price often targets
Piusdt I love the massive rejection from the candle stick we were expecting price to get to the zone den buy up and price didn't just get to the zone it brought out a sweet rejection so we are waiting for pi to change direction on the 4h then we buy

PI/USDT potential entry before flying to the next galaxyCould this be the zone?
Either we will make profit or be liquidated.
Good luck babies!
Pi Network at the cliff edge ?SInce there a lots of speculation about Pi coin, people are still doubt about it and beliving that Pi coin will bankrupt. No real CGV price USD 314,159 will be done somewhare 10 years ahead, the cummunity of Pi pioneers getting more weaker and no trust with the project.. Eventually Pi coin end like

Pi long !! proper risk management Hello traders, keeping a close eye on NASDAQ:PI — forming a solid pattern.
Strong wick indicates a potential buy zone in this area.
We do have some untapped downside liquidity below.
However, with CRT in play, a bullish move is likely.
We’ve already completed CISD confirmation on the 3H timeframe.

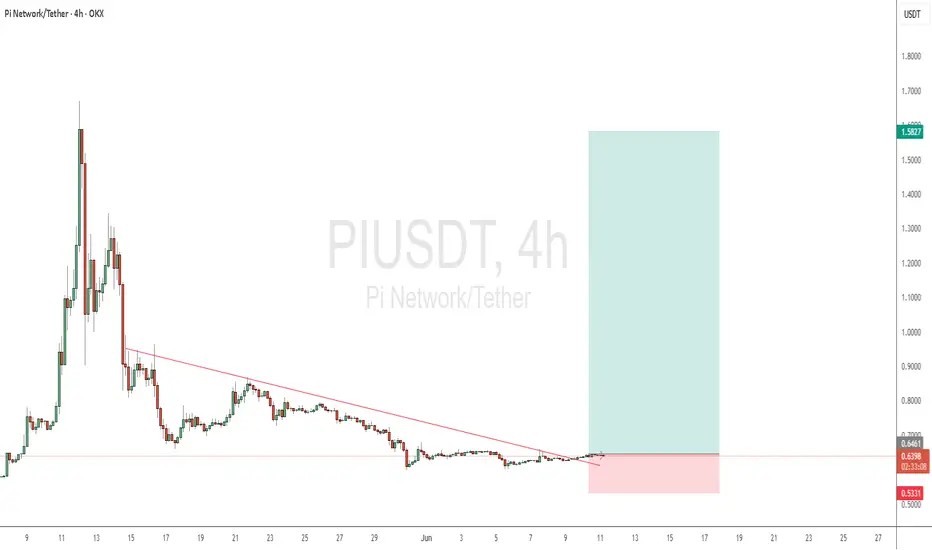
PI to 1.5$ ? :)Folks
Pi broke a major trendline on the 4H timeframe, and it's been crawling for a while.
This could be a preparation for a big rise!!
Buckle up, let's warm up the engines ;)
Good luck <3
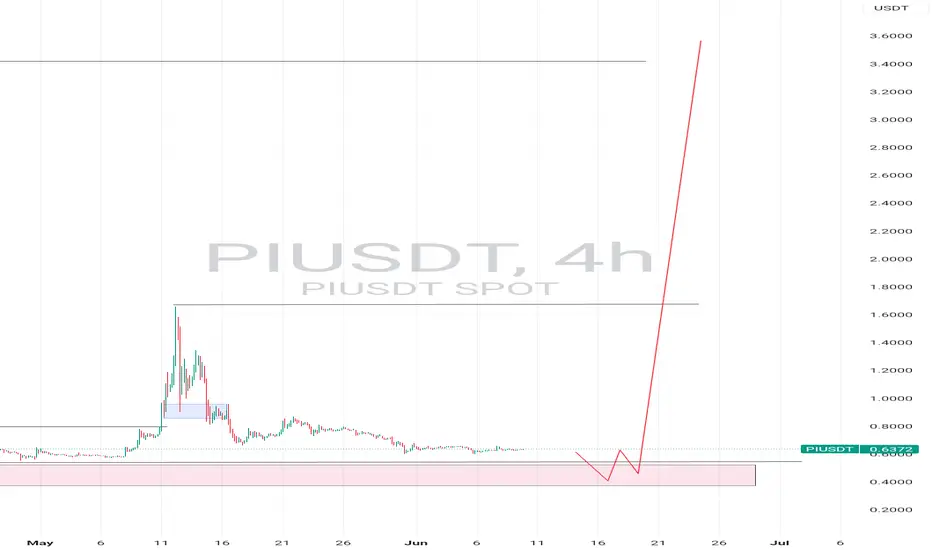
PI/USDT will fly to the next galaxy soonThis pair in the next couple of weeks will fly soon.
Good luck with the entries and leverage.
Cha-ching!!
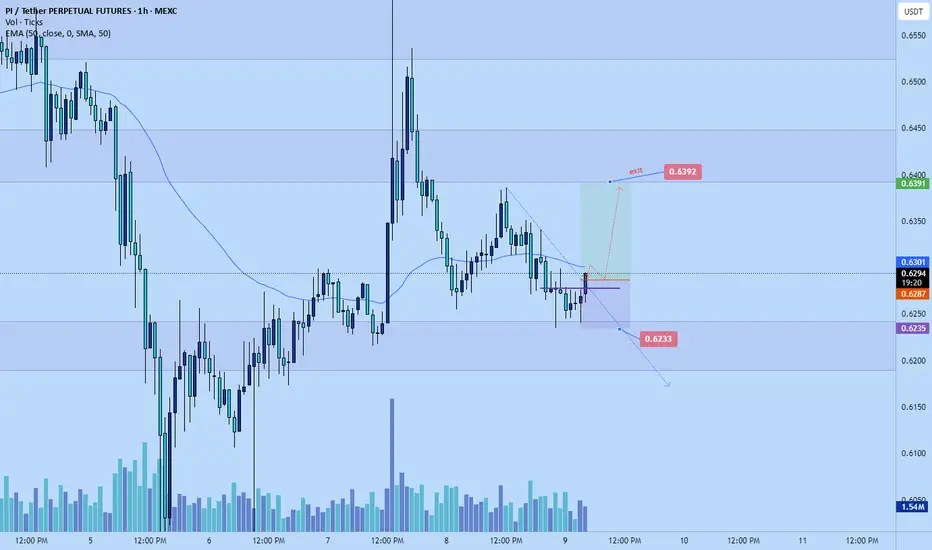
Picoin scalp long to $0.6392Entered a picoin scalp long a while ago. TP $0.6393
Stop: $0.6233
Time sensitive
2RR
Market likely to retest internal 4hr HH point
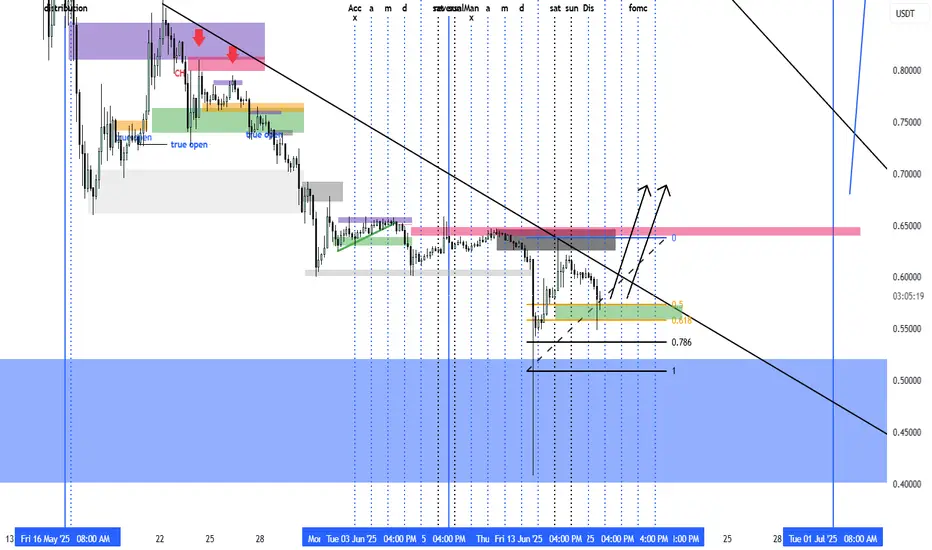
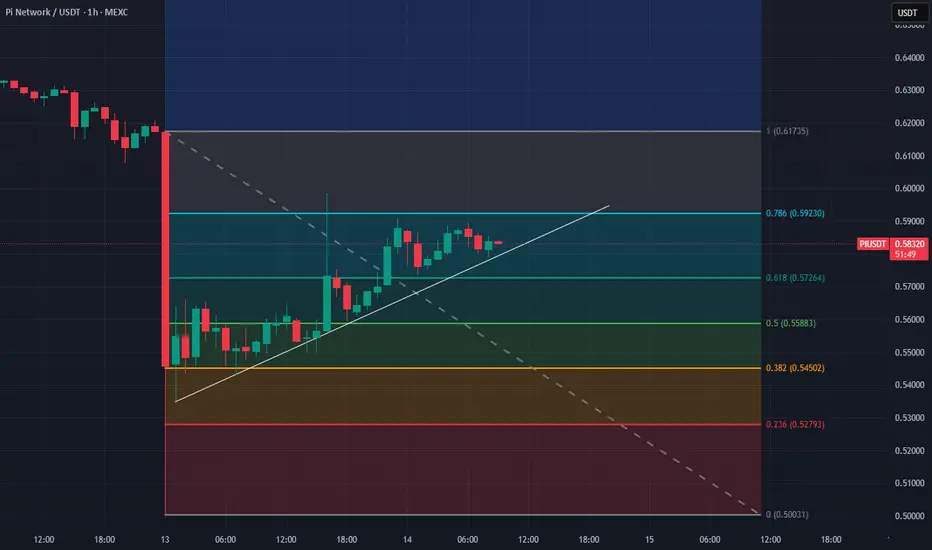
Building Momentum After the Dump🧠 Idea Summary:
After a sharp drop, PIUSDT is showing signs of stabilization and recovery. Price is climbing along a short-term ascending trendline, supported by key Fibonacci retracement levels. Buyers are attempting to regain control above the $0.58–$0.59 zone.
🔍 Technical Highlights:
Current pri
See all ideas
Summarizing what the indicators are suggesting.
Oscillators
Neutral
SellBuy
Strong sellStrong buy
Strong sellSellNeutralBuyStrong buy
Oscillators
Neutral
SellBuy
Strong sellStrong buy
Strong sellSellNeutralBuyStrong buy
Summary
Neutral
SellBuy
Strong sellStrong buy
Strong sellSellNeutralBuyStrong buy
Summary
Neutral
SellBuy
Strong sellStrong buy
Strong sellSellNeutralBuyStrong buy
Summary
Neutral
SellBuy
Strong sellStrong buy
Strong sellSellNeutralBuyStrong buy
Moving Averages
Neutral
SellBuy
Strong sellStrong buy
Strong sellSellNeutralBuyStrong buy
Moving Averages
Neutral
SellBuy
Strong sellStrong buy
Strong sellSellNeutralBuyStrong buy