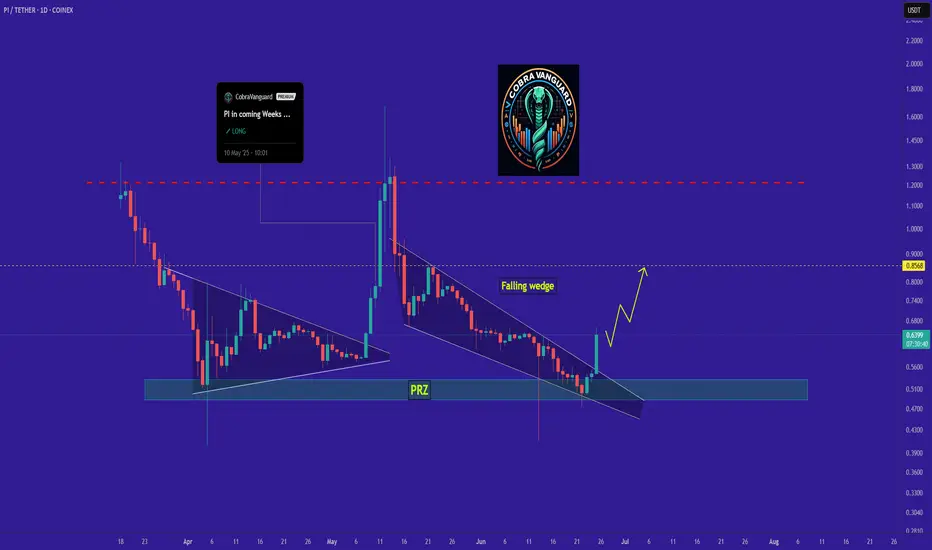
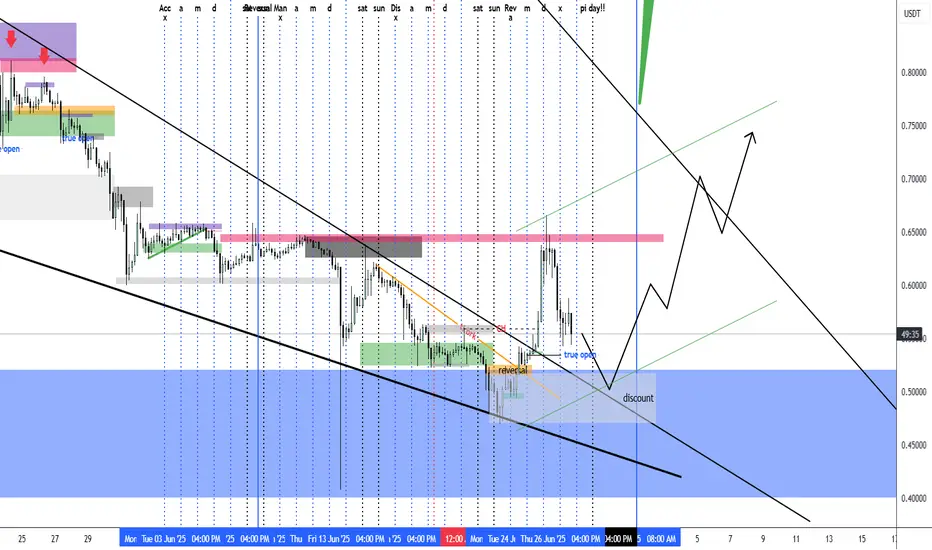
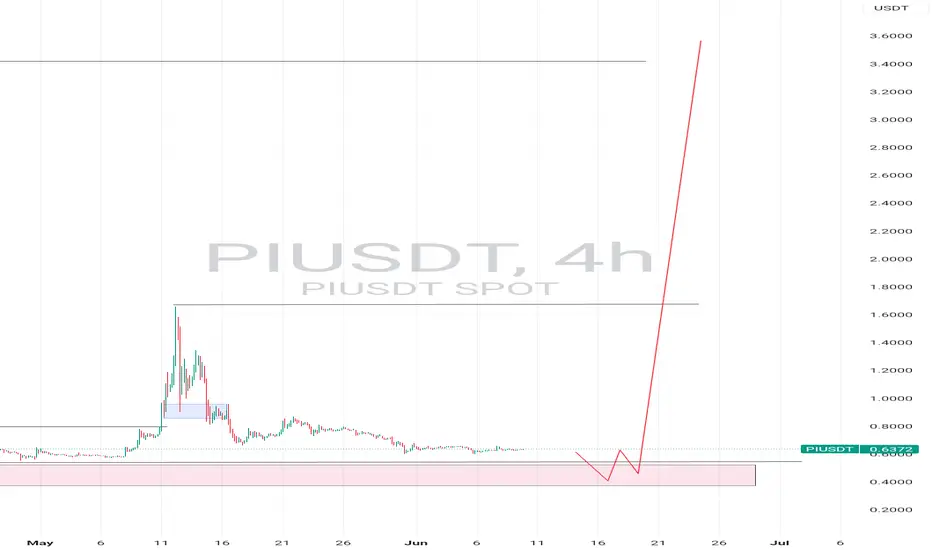
PI's situation+ Target PredictionThe price has broken the ascending wedge, and this could push it toward the middle of the channel, potentially happening very quickly.
Best regards CobraVanguard.💚
PIUSDT.P trade ideas
PIUSDT falling wedge breakout 🚨 Hello Traders!
PIUSDT has successfully broken out of a falling wedge — a strong bullish pattern.
This breakout may indicate the start of an upward move.
Watch for a retest of the breakout zone for potential entries.
Volume confirmation will add confidence to the setup.
Stay alert and always apply proper risk management. 📊
The falling wedge of Pi Coin?Falling wedge Pi network pattern?The Pi Network (PI) token is currently showing signs of forming a falling wedge pattern, which is often interpreted as a bullish reversal signal in technical analysis. This pattern is characterized by two downward-sloping trendlines that converge, indicating a slowdown in bearish momentum.
One week to go.. just wait what will happen next.
PIUsdti dont see any reason for pi to go above a dollar for now. in as much pi team is still in control of billions of token, the investors will always go short. so am still expect pi team to release community token after the price drop below 0.07

Pi long !! proper risk management Hello traders, keeping a close eye on NASDAQ:PI — forming a solid pattern.
Strong wick indicates a potential buy zone in this area.
We do have some untapped downside liquidity below.
However, with CRT in play, a bullish move is likely.
We’ve already completed CISD confirmation on the 3H timeframe.
Looks like a good opportunity to position for the upside.

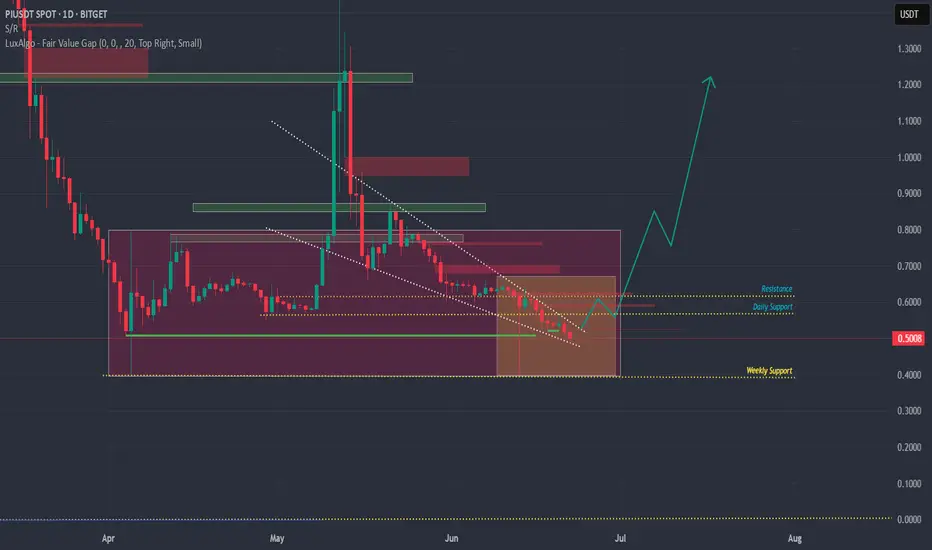
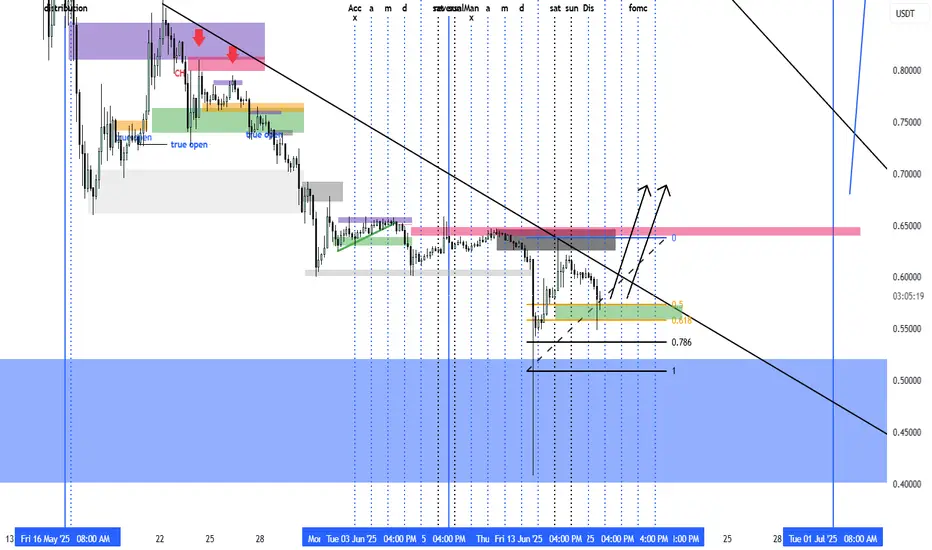
PI/USDT Final Call before it flies to the next galaxyWe see so many bullish signs.
Price could potentially tap into the discount zone
before it soars.
Good luck!
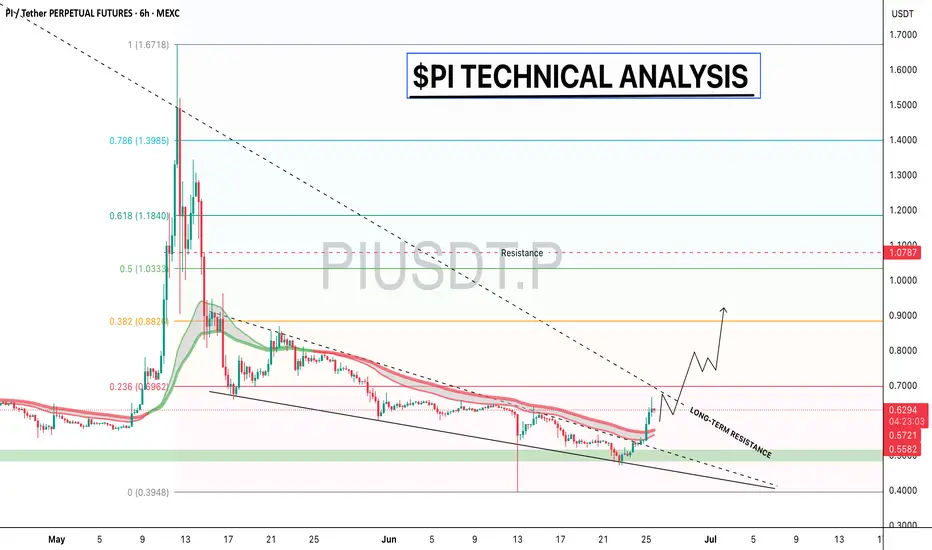
$PI TECHNICAL ANALYSIS ! !NASDAQ:PI is finally breaking out of the long-term downtrend and showing early signs of strength.
Price has reclaimed the falling wedge resistance and is now pushing toward the 0.236 Fib zone around $0.69 that we need to break to move further up.
If bulls hold momentum, the next target could be $0.88 (0.382 Fib), with $1+ in sight if the trend continues.
The structure looks bullish, but watch for a clean breakout and retest, and continuation.
DYOR, NFA
PI/USDT potential entry before flying to the next galaxyCould this be the zone?
Either we will make profit or be liquidated.
Good luck babies!
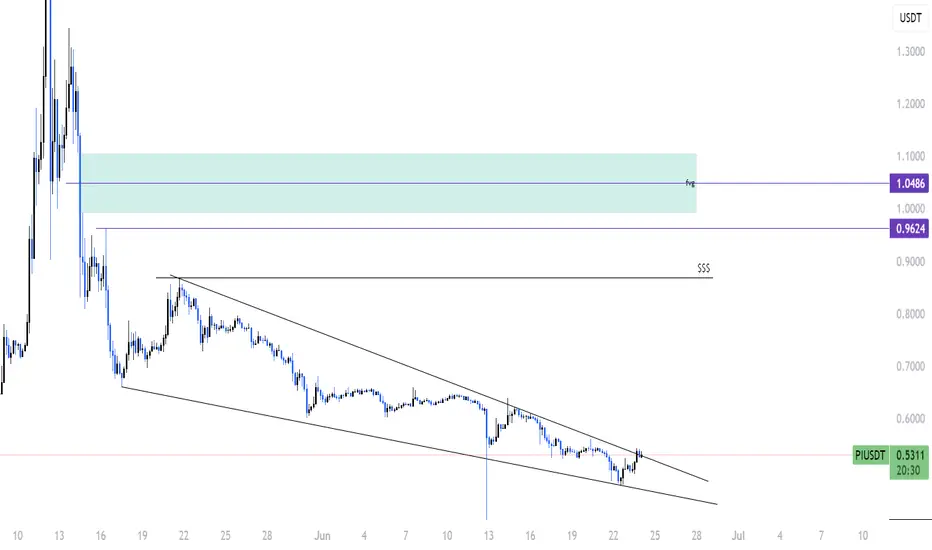
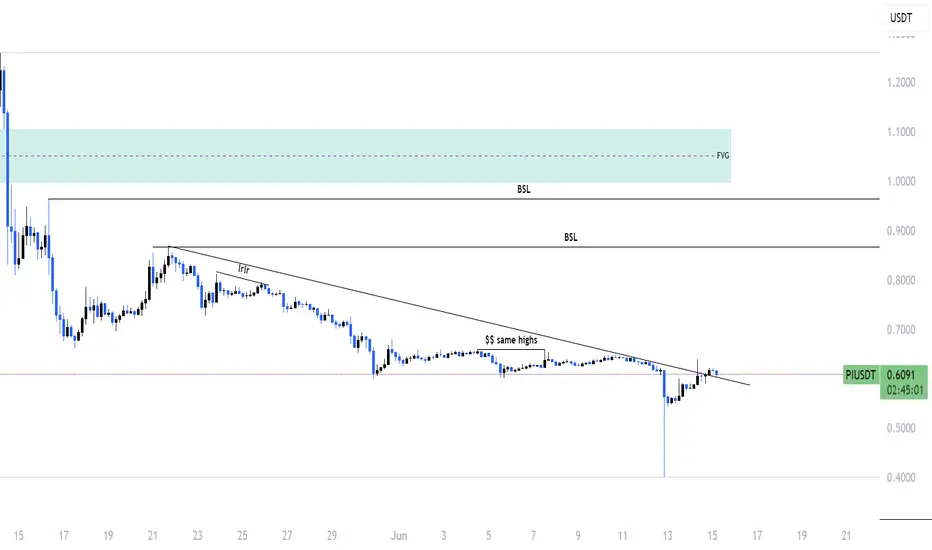
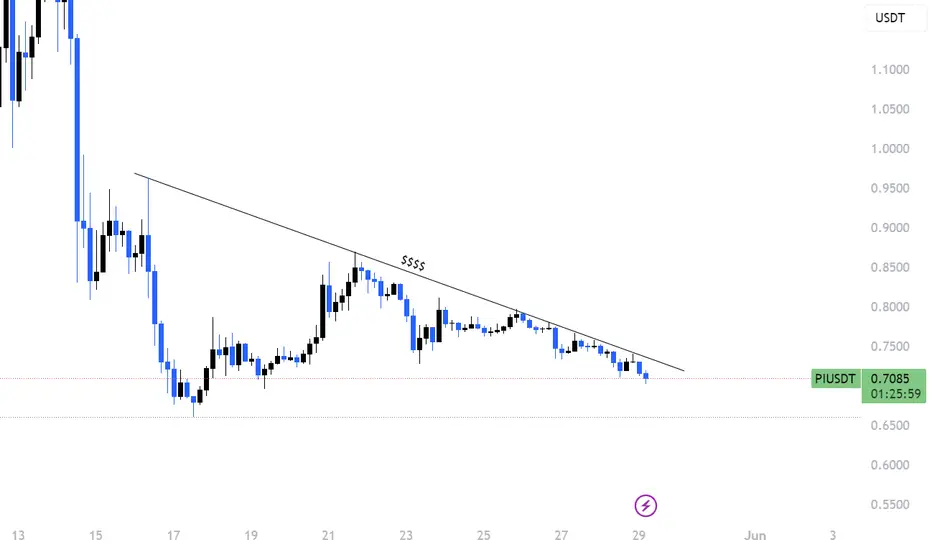
PI breakout !!Trendline Break:
Price has broken above a descending trendline — often a bullish signal.
A small retest is visible, indicating confirmation of the breakout.
Equal Highs (Liquidity Pool):
Labelled “$$ same highs” — this suggests buy-side liquidity is resting above that level.
Price often targets these highs to grab liquidity before a reversal or continuation.
BSL (Buy-Side Liquidity):
Two BSL levels marked; price may aim for these as upside targets.
FVG (Fair Value Gap):
The green shaded zone above represents an imbalance (FVG), usually a magnet for price.
Price may fill this area, targeting between 0.95 – 1.10 USDT.
📈 Expected Move (Bullish Bias):
Short-term: Move above the “$$ same highs” to run liquidity.
Mid-term: Push towards first BSL (~0.75 USDT).
Long-term: Potential fill of the FVG zone around 1.00 USDT.
⚠️ Watch for:
“same highs” area (could be a stop hunt).
PI/USDT will fly to the next galaxy soonThis pair in the next couple of weeks will fly soon.
Good luck with the entries and leverage.
Cha-ching!!
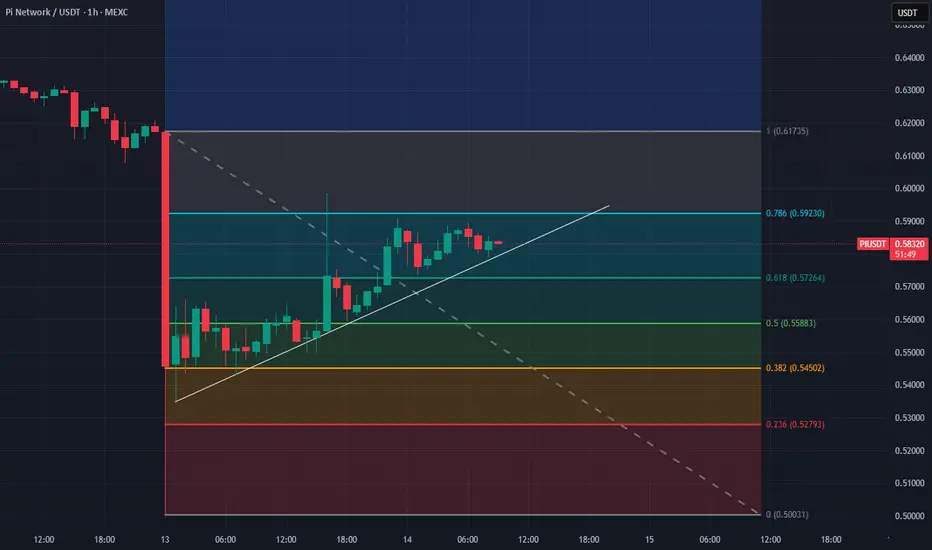
Building Momentum After the Dump🧠 Idea Summary:
After a sharp drop, PIUSDT is showing signs of stabilization and recovery. Price is climbing along a short-term ascending trendline, supported by key Fibonacci retracement levels. Buyers are attempting to regain control above the $0.58–$0.59 zone.
🔍 Technical Highlights:
Current price: ~$0.583
Recent structure: V-shaped bounce from ~$0.50 lows
Key Fibonacci retracement levels:
0.382 – $0.545
0.5 – $0.558
0.618 – $0.572
0.786 – $0.592
Resistance to reclaim: $0.592 (Fib 0.786) and $0.617 (Fib 1.0)
Price is currently moving within a bullish ascending channel, showing higher lows.
🟢 Bullish Scenario:
If price holds the ascending trendline and breaks above $0.592, a move toward the full recovery zone at $0.617+ is likely. Sustained buying pressure above this level could lead to a trend reversal.
🔴 Bearish Scenario:
A breakdown below the trendline and $0.572 (0.618 Fib) would invalidate the current bullish structure. In that case, watch for support at $0.558 and $0.545.
📌 Conclusion:
PIUSDT is at a decision point. Holding above the trendline and reclaiming $0.592 would signal bullish continuation. This setup could offer a low-risk entry with a clear invalidation point below $0.572.
Pi Network at the cliff edge ?SInce there a lots of speculation about Pi coin, people are still doubt about it and beliving that Pi coin will bankrupt. No real CGV price USD 314,159 will be done somewhare 10 years ahead, the cummunity of Pi pioneers getting more weaker and no trust with the project.. Eventually Pi coin end like a shit coin dies in the blockchain space with no value. Floating in the space with tears and no hope.....
BUT !!
The awaitting news this 28th June 2025, will it change on more again? Or just a pity small news that no changes at all, like the Pi core team does when 6 years past, the project phase. Lies with lies.. and more lies ahead ? Just stay tune, keep mining, and no body realy knows what in the future.. Baba Vanga never told about Pi Coin, only the Simpson was telling about the Pi.

Piusdt I love the massive rejection from the candle stick we were expecting price to get to the zone den buy up and price didn't just get to the zone it brought out a sweet rejection so we are waiting for pi to change direction on the 4h then we buy

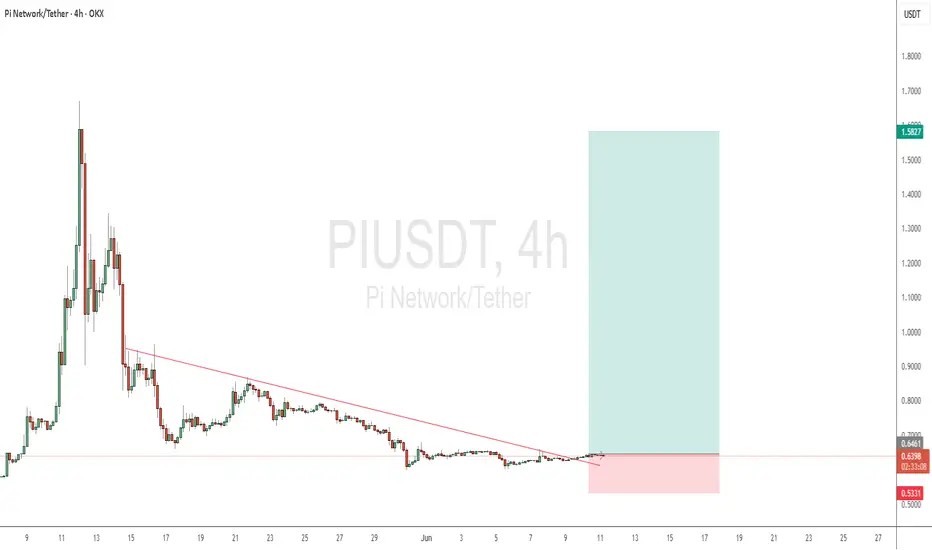
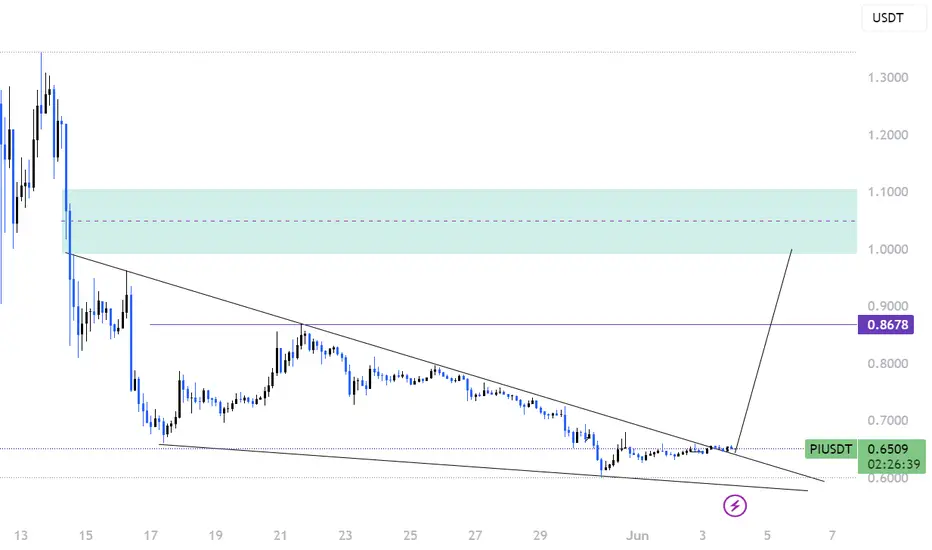
PI to 1.5$ ? :)Folks
Pi broke a major trendline on the 4H timeframe, and it's been crawling for a while.
This could be a preparation for a big rise!!
Buckle up, let's warm up the engines ;)
Good luck <3
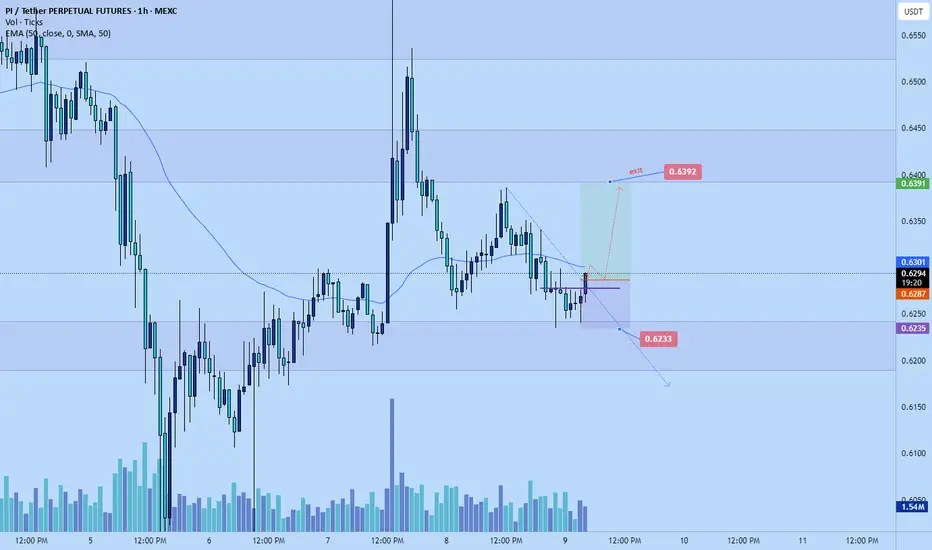
Picoin scalp long to $0.6392Entered a picoin scalp long a while ago. TP $0.6393
Stop: $0.6233
Time sensitive
2RR
Market likely to retest internal 4hr HH point
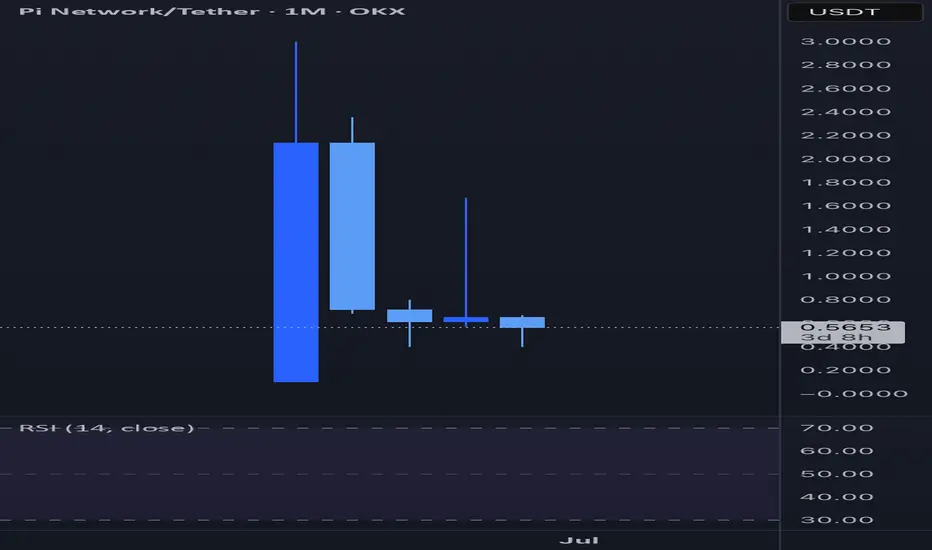
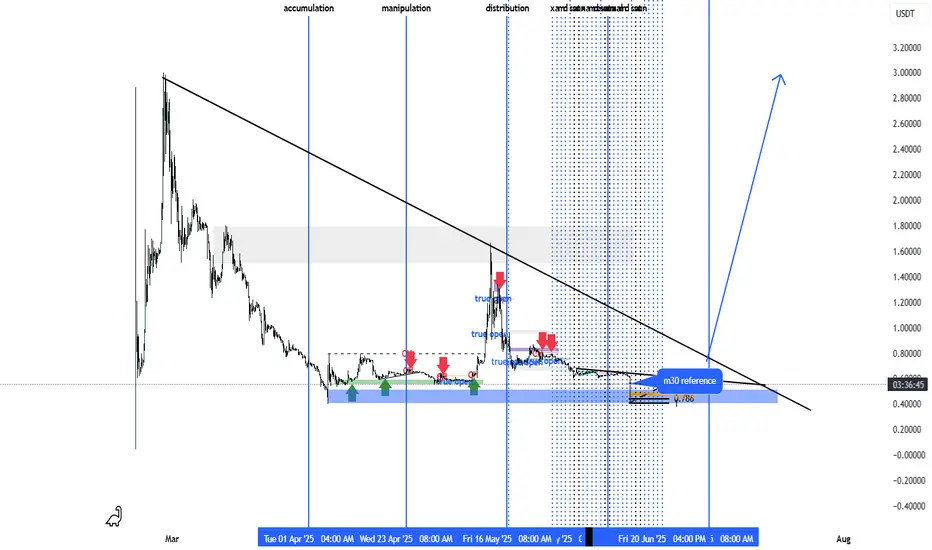
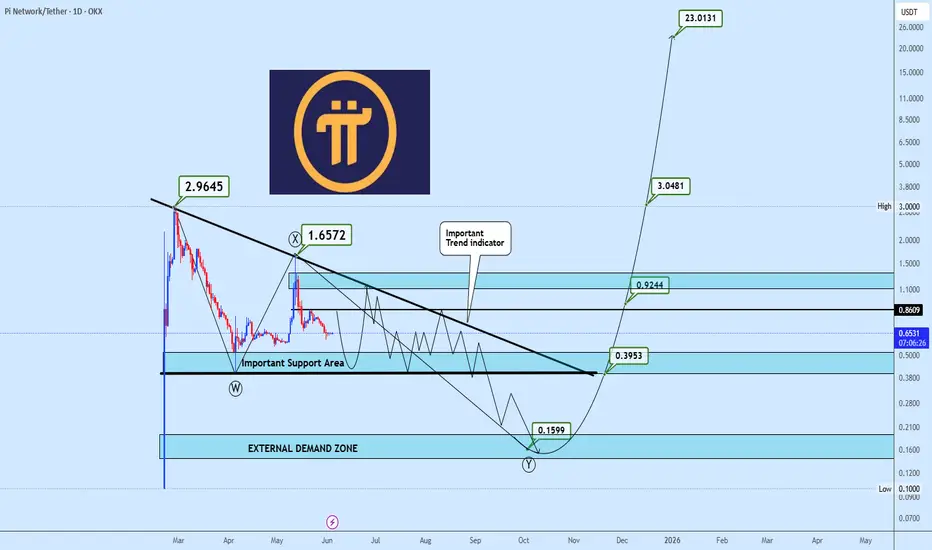
PIUSDT Range Play Within a Potential Descending TriangleAfter reaching a high of $2.9645, PIUSDT has experienced a sharp decline, establishing a base near the $0.38 zone. This base continues to hold, suggesting the formation of a potential descending triangle.
For now, the strategy is to trade the range while the structure matures. A break below $0.38 would likely trigger further downside toward $0.16, where a strong external demand zone aligns with the completion of a possible WXY corrective formation.
On the flip side, a breakout above the upper trendline of the triangle would be a strong bullish signal, potentially igniting a significant rally. Upside targets are already projected on the chart.
As the structure develops, all eyes remain on the key levels that will determine the next major move.
PI bullish Breakout!! BUY BUYHello traders i hope you are doing as we can see Market done breakout from falling wedge as well as we are having liquidity and FVG which is not metigated yet so i am expecting market back to FVG
buy buy!!
Pi usdtI gave a update on pi be4 but the levels I was expecting a possible bullish but the zone didn't hold but we are still on a uptrend on piusdt so I will advise you buy more pi cause the 1w and 1day is on a uptrend waiting for 4h to change direction on the support zone den boom to the up side but pi to 10$ soon
Pi just making Strong trendline liquidity targeting 0.96-0.99Hello traders PI is technically bearish but having strong trendline luqiidity as you can see on chart clean targeting 0.96-0.99
always enter after risk management
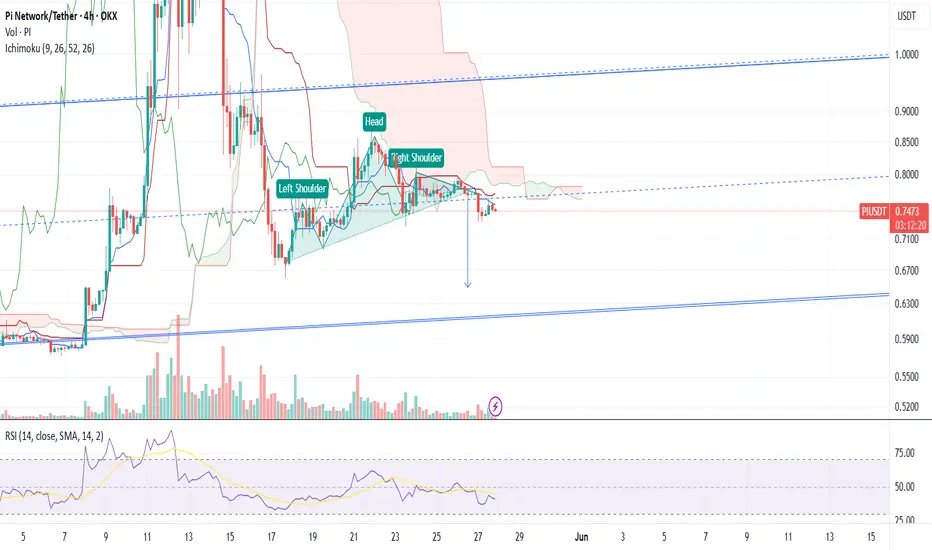
We are going to see the lower support line againAs can be seen there is a head and shoulder pattern and hence, We are going to see the lower support line again
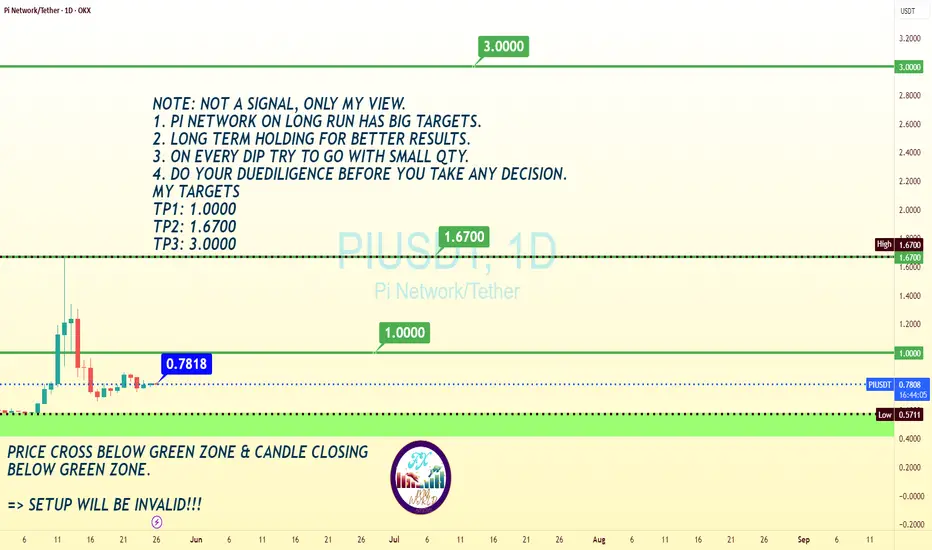
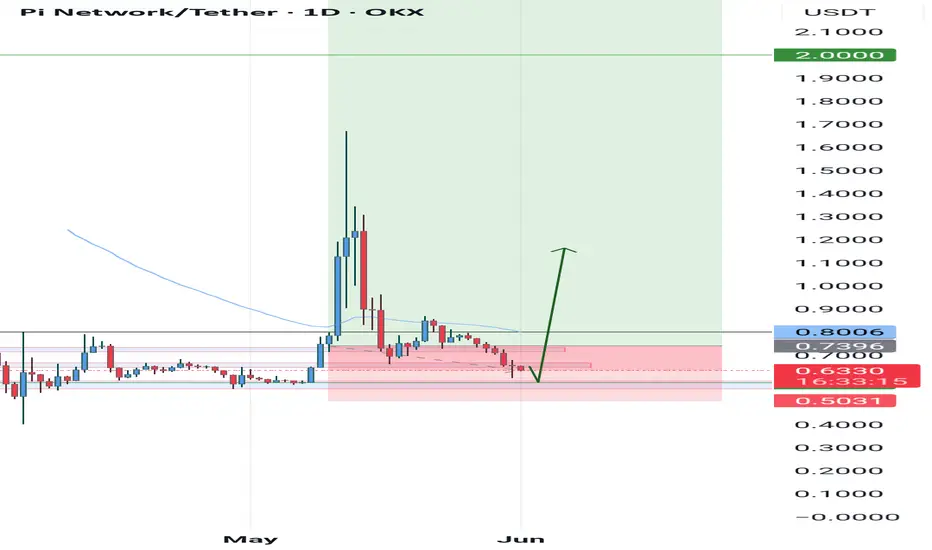
Pi Network Price Prediction DAY Chart BUY AnalysisThe Pi Network (PI/USDT) is attracting increased attention from crypto traders and long-term investors alike, with growing speculation about its future price potential.
Based on the current technical chart dated May 26, 2025, several critical insights and projections can be drawn for those considering investment in this digital asset.
This analysis reflects personal views and does not constitute financial advice.
At the time of analysis, PI/USDT is trading at **$0.7812**, with visible consolidation just above the key support zone.
The chart displays three major **Take Profit (TP)** targets, reflecting potential bullish momentum in the medium to long term:
TP1: $1.0000
TP2: $1.6700
TP3: $3.0000