Pi Coin Holders Exit Amid Altcoin's Shift from BitcoinAt present, Pi Coin is priced at $0.40, attempting to hold above this level as support. While the price is distancing itself from its ATL, it remains trapped in a persistent downtrend. Unless there is a significant shift in investor sentiment, Pi Coin may struggle to break free from this ongoing decline.
Pi Coin's correlation with Bitcoin has been declining, now standing at just 0.52. This reduction in correlation is especially troubling given Bitcoin’s recent surge, which saw the cryptocurrency form a new all-time high (ATH) within the last 24 hours.
Given the continued bearish behavior from investors, Pi Coin’s price may drop further towards the next support level at $0.36. If this support level fails to hold, Pi Coin could head back toward its ATL of $0.32, erasing recent gains and possibly setting the stage for further losses.
However, if Pi Coin can successfully bounce off the $0.40 support, there may be a chance for a rebound. A rise above this level could break the downtrend and push Pi Coin toward $0.44. This move would be crucial for Pi Coin’s recovery, but it would require significant investor confidence and buying pressure to materialize.
PIUSDT trade ideas
Flat top bottom ending?Where is the Pi price will go.?
If the resistance is broken, it maybe go to $0.90
Amd if the supports is broken again, the bearish will dominate more downside momentum.

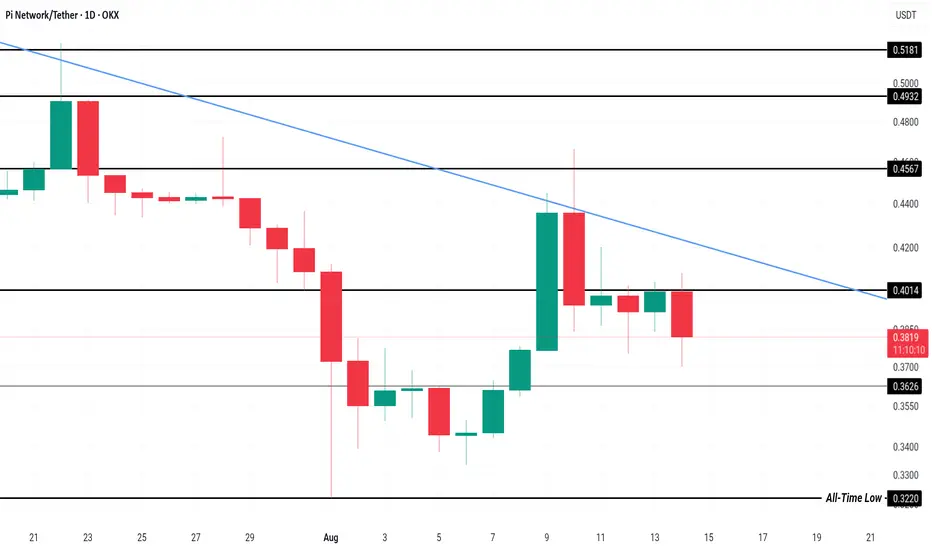
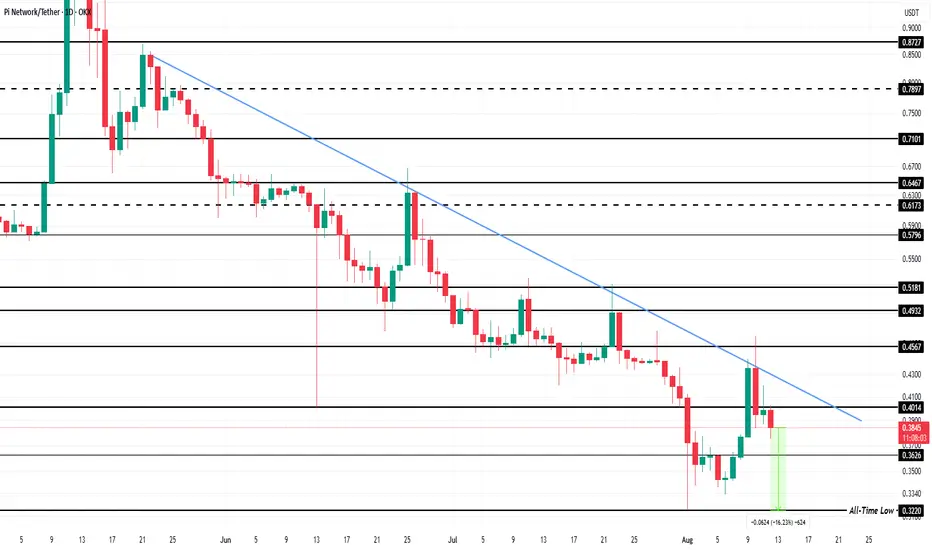
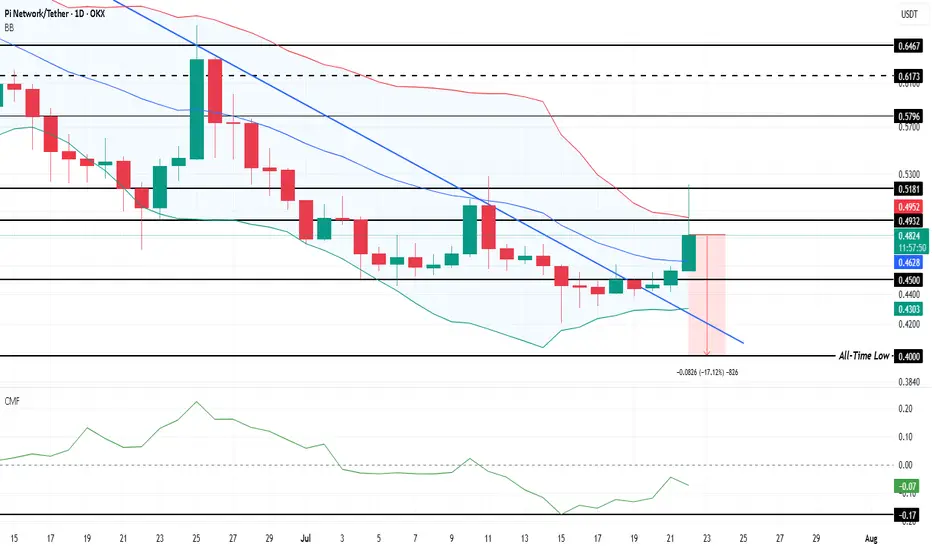
Pi Coin Price Fails 3-Month Downtrend Breakout; What’s Next?Currently, OKX:PIUSDT is trading at $0.385 , having failed to breach a crucial resistance at $0.440. This resulted in a 12% decline over the last three days , solidifying the ongoing three-month downtrend. The inability to break through key resistance levels has left Pi Coin vulnerable to further losses.
OKX:PIUSDT price is now just 16% away from its ATL of $0.322 , and mixed sentiment from technical indicators suggests that it may not hit this level in the immediate future. The altcoin is likely to attempt a bounce from its current support at $0.362.
However, if the broader market conditions worsen or investor sentiment turns more pessimistic, a drawdown could be imminent. This may lead OKX:PIUSDT to breach its support and fall to $0.322 , invalidating the current bullish-neutral outlook. In this case, Pi Coin could form a new ATL, pushing its price even lower and intensifying the downtrend.
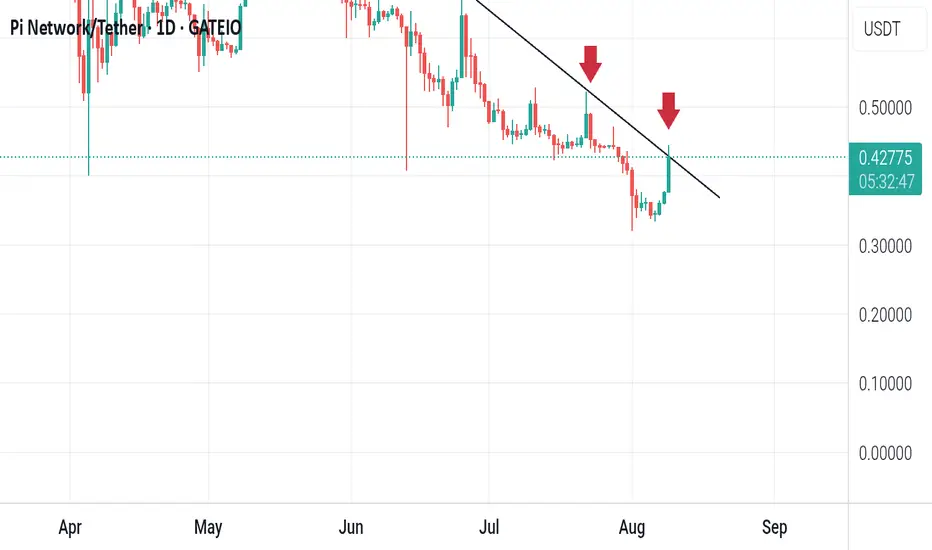
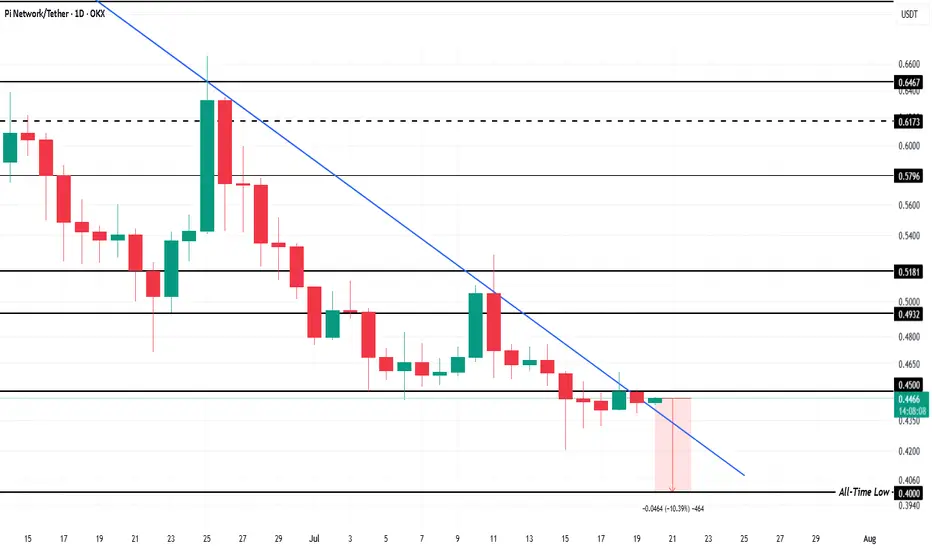
Pi price analysis Daily time frame currently we have 4 trendline rejection will there be a break or we wait for the 5th touches?
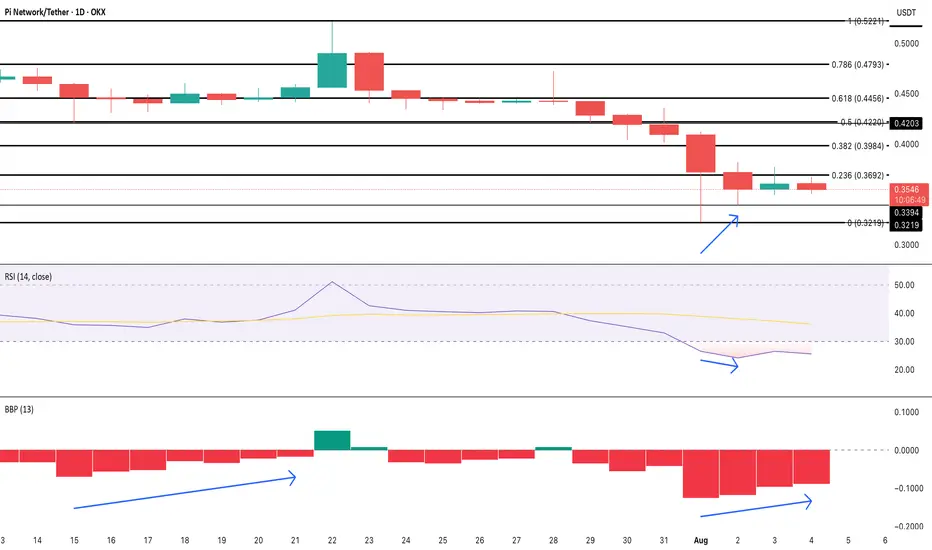
Pi Coin Bulls Whisper Comeback as Bears Ease OffOKX:PIUSDT has been in free fall, losing 25% over the past month and hitting fresh all-time lows. As of now, the OKX:PIUSDT price is holding around $0.35, hovering just above its recent bottom at $0.32. Despite the pressure, there’s a flicker of optimism on the charts.
The first encouraging sign comes from the Bull-Bear Power (BBP) indicator. This tool tracks the strength of bulls vs. bears by comparing price extremes with a moving average. Since August 1, BBP has been rising, flipping from a deeply negative zone to a softer print. That same behavior last occurred in mid-July, just before a bounce from $0.45 to $0.52. It’s not a confirmation, but it’s not nothing.
Backing this up is the RSI (Relative Strength Index), which has formed a hidden bullish divergence on the 4-hour chart. While the RSI dipped lower, price held a higher low; a classic setup that often appears right before continuation moves in an uptrend. RSI is still at 23, deep in oversold territory, but this divergence hints that sellers may be tiring.
There’s a sentiment twist too. OKX:PIUSDT ’s social dominance, its share of overall crypto discussion, has jumped three sessions in a row. This mirrors the chatter spike seen before the last short-term rally, suggesting that market attention is returning at a potentially pivotal moment.
Still, nothing breaks unless the price does. OKX:PIUSDT must close above $0.36 to even test resistance at $0.39. These levels are drawn from the Fibonacci retracement anchored from $0.52 to $0.32. Only above $0.39 can bulls breathe easier. Below $0.32? That invalidates the whole setup and leaves the door open for lower lows.
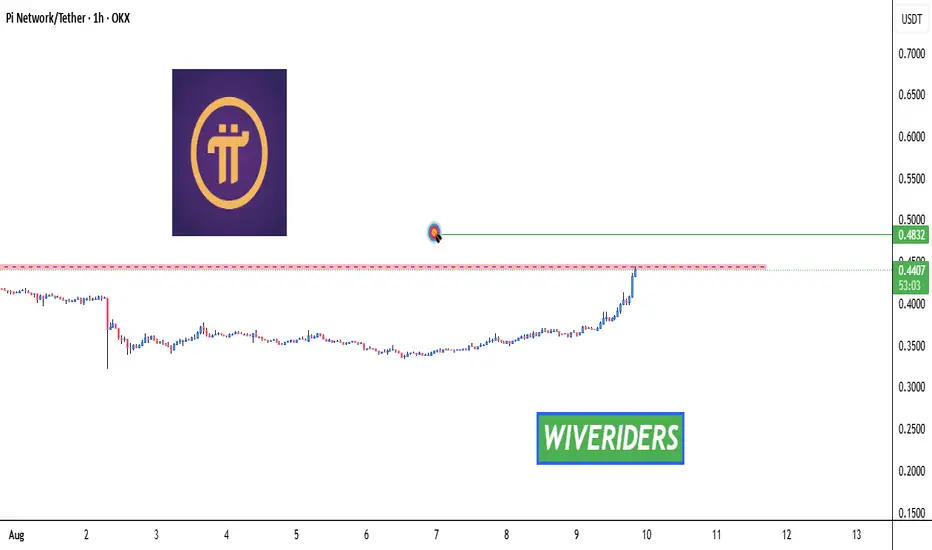
PI Breakout Watch – Red Resistance Being Tested!🚨 NASDAQ:PI Breakout Watch – Red Resistance Being Tested! 🔴⏳
NASDAQ:PI is testing the red resistance zone.
📊 If breakout confirms, next move could target:
🎯 First Target → Green line level
A breakout could trigger bullish continuation and upside momentum.
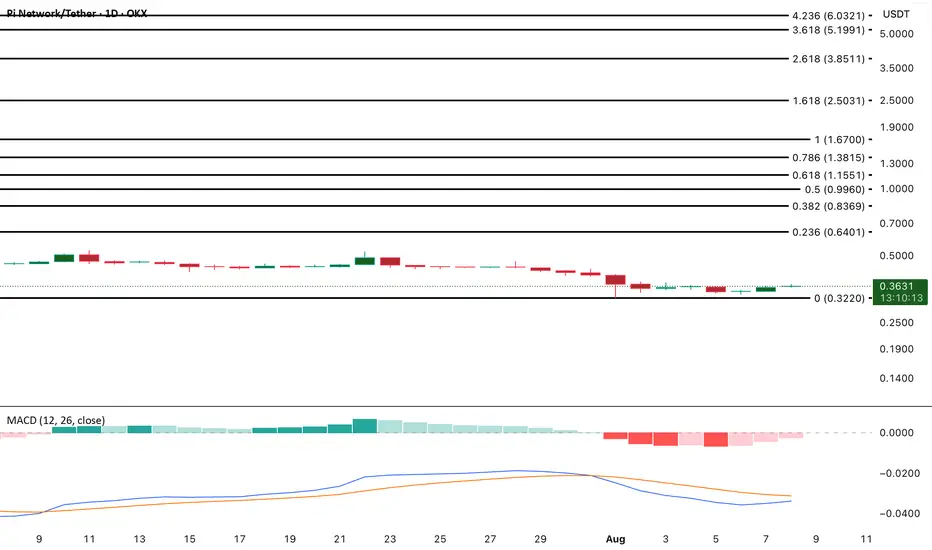
PI Token Eyes Bullish Momentum as MACD Crossover NearsPI is showing signs of bullish momentum on the daily chart as its Moving Average Convergence Divergence (MACD) indicator approaches a positive crossover. This setup occurs when the MACD line moves above the signal line, suggesting that short-term momentum is strengthening against the longer-term trend.
A positive MACD crossover is widely viewed as a buy signal, indicating a potential shift from selling pressure to buying strength.
For PI, this development points to rising investor interest, which could drive prices higher in the near term if the momentum sustains.
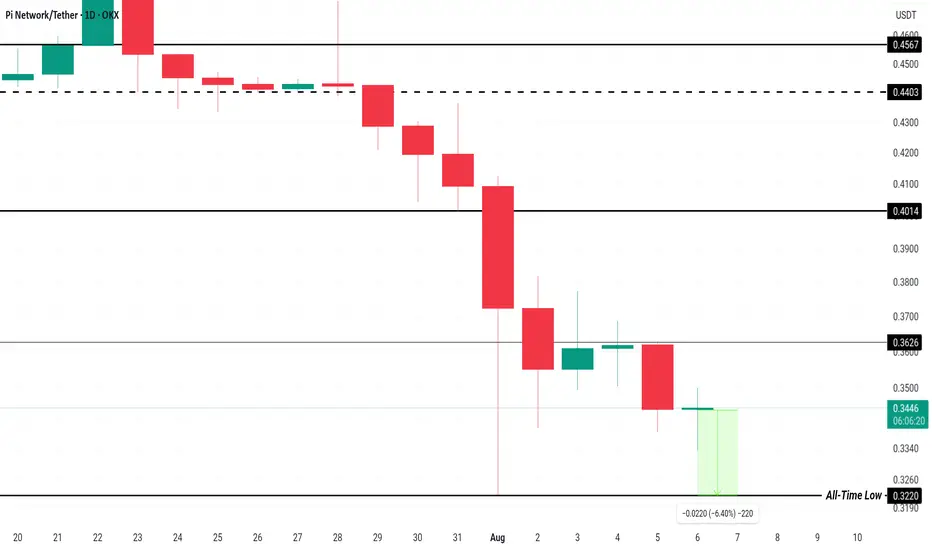
Pi Coin’s All-Time Low Price Journey: What’s Driving the DeclineOKX:PIUSDT price is currently at $0.343, just 6.4% away from revisiting its recent ATL of $0.322. Given the current market conditions, Pi Coin remains under significant pressure, making it likely that the price will continue to decline. A new ATL below the current $0.310 could be in the near future.
Given the ongoing outflows and the rising correlation with Bitcoin’s price movements, OKX:PIUSDT price trajectory appears bleak. It’s expected that the price will maintain its downtrend unless a shift in investor sentiment occurs. A decline through the support levels is highly probable , pushing the price toward further losses.
However, in the unlikely scenario that OKX:PIUSDT experiences a reversal, it would need to secure $0.362 as a support floor to initiate a rally. If the price manages to break this barrier, it could rise to $0.401 , invalidating the current bearish outlook and offering hope for a price recovery.
PI/USD: Consolidation Tightens as Volatility FadesPI/USD remains locked in a sideways trend, with technical indicators on the daily chart signaling market indecision. The Relative Strength Index (RSI) has moved flatly since the consolidation began, reflecting a balance between buying and selling pressure.
An RSI reading above 70 typically signals overbought conditions, while readings below 30 indicate oversold territory — but PI’s current range shows neither extreme, suggesting traders are hesitant to take strong positions.
Similarly, the Average True Range (ATR) has been trending downward since August 2, now sitting at 0.03. This drop in volatility signals smaller, less frequent price changes.
Such ATR behavior often occurs during consolidation phases or periods of uncertainty, as market participants await a catalyst for a decisive breakout. Until then, PI’s price remains trapped between fear and hope.

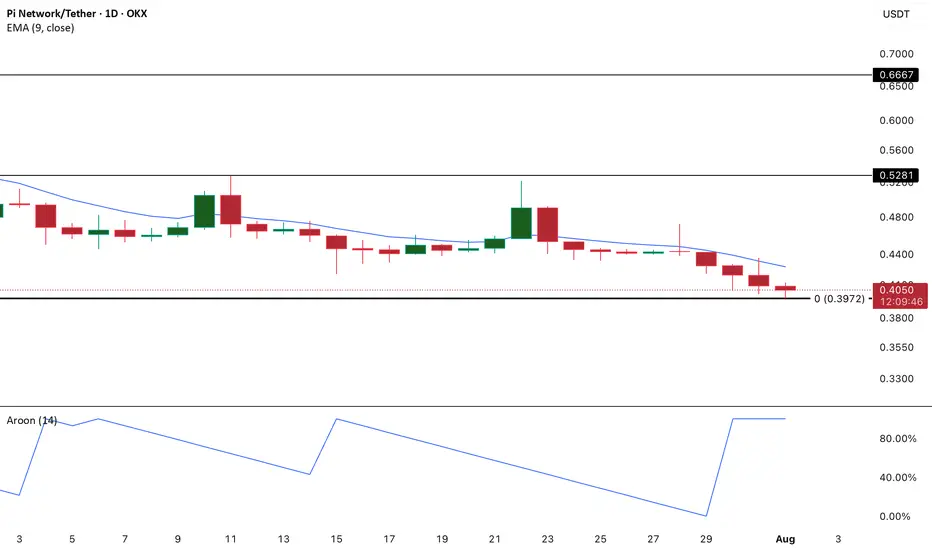
PI in Full Bear Control as Aroon Down Hits 100%PI continues to flash warning signs as technical indicators lean heavily bearish. Most notably, the Aroon Down Line on the daily chart has surged to a reading of 100%.
For context, the Aroon indicator is designed to identify the strength and duration of a trend, and when the Down Line reaches the 100% mark, it typically signals that a recent low was recorded very recently — often within the past day or two.
This kind of reading reflects an aggressive downtrend, where bearish momentum dominates and sellers are in full control.
PI NETWORK : Will it finally be pumped?Hello friends🙌
👀According to the decline we had, you can see that the price has reached an important area and has formed a floor in this area. Considering the classic ego that is forming on support, you can enter the trade by breaking the resistance, of course, by managing risk and capital and moving with it to the specified goals.
🔥Follow us for more signals🔥
*Trade safely with us*
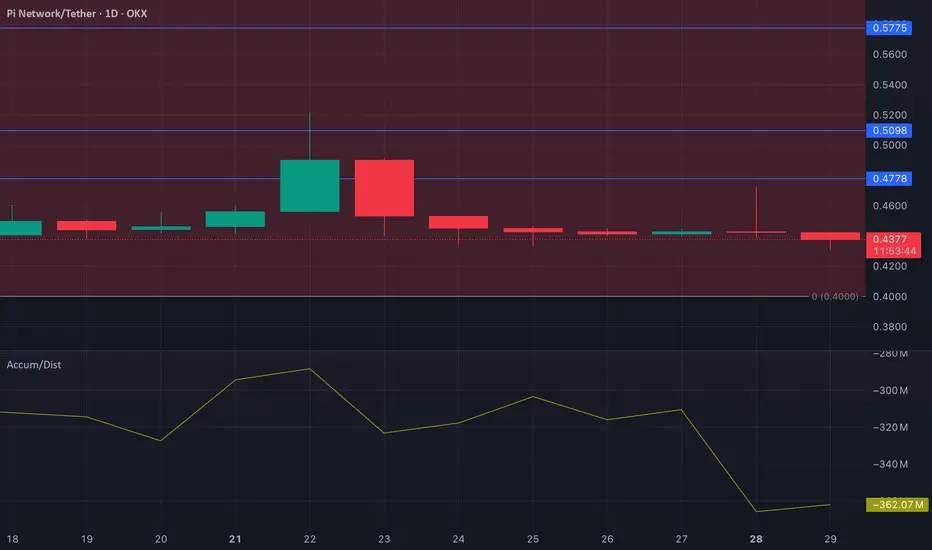
PI – Bearish Pressure Mounting as A/D Line CollapsesPI’s daily chart paints a bearish picture, with technical indicators showing no signs of a recovery. A standout signal is the Accumulation/Distribution (A/D) line, which has been on a sharp downtrend since June 26.
This steep decline in the A/D line signals that sellers have been dominating the market, outweighing any attempts at accumulation. With demand visibly weakening, PI faces growing downside risk through August unless bullish momentum reemerges.
PI / Usdt OKX:PIUSDT
### **📊 Chart Overview – PIUSDT (1H):** -----Scam Coin remember -----
* **Current Price:** \$0.4484
* **Recent Move:** Sharp spike toward **\$0.48**, followed by an immediate rejection and retracement.
* **Volume Spike:** Notable surge in volume during the recent breakout, indicating possible **whale activity or manipulation**.
---
### **🔍 Technical Breakdown:**
1. **Fakeout Alert:**
* Price spiked above **\$0.4617** and got rejected hard.
* Classic **bull trap** pattern with a return below resistance, signaling caution.
2. **Support Zone:**
* Immediate support near **\$0.4470**, currently being tested.
* If this level fails, potential pullback to **\$0.4400 – \$0.4350 zone**.
3. **Resistance to Watch:**
* **\$0.4617** is now strong resistance.
* Bulls need to reclaim this level for continuation toward **\$0.48+**.
---
### **📌 Summary:**
PIUSDT showed **short-term bullish momentum** but faced **strong rejection at key resistance**. A breakdown of \$0.4470 may confirm further downside. Stay cautious of **fakeout spikes**.
---
⚠️ **Disclaimer:**
*This analysis is for educational purposes only and does not constitute financial advice. Always do your own research before making investment decisions.*

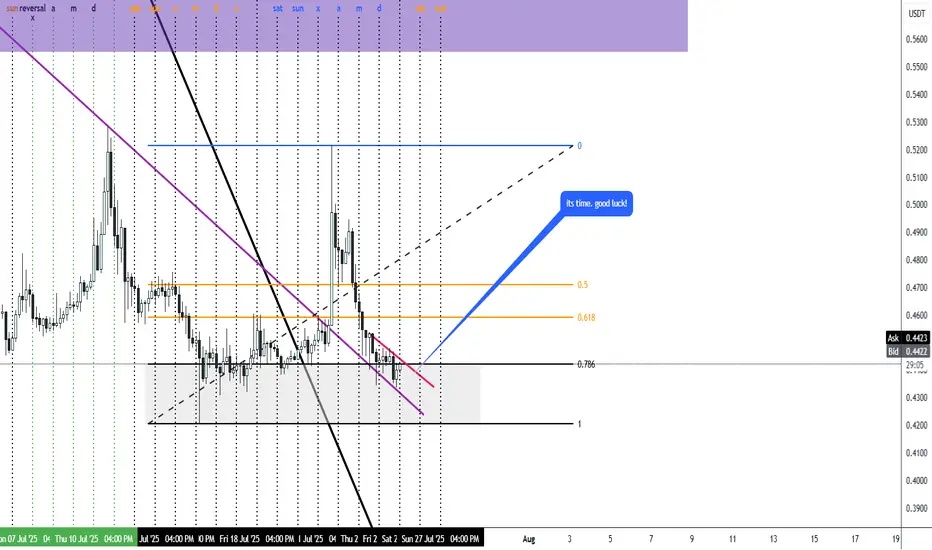
PIUSDT Time is NOW - BullishWe saw change of character.
i think It is now time to get in.
good luck to all!
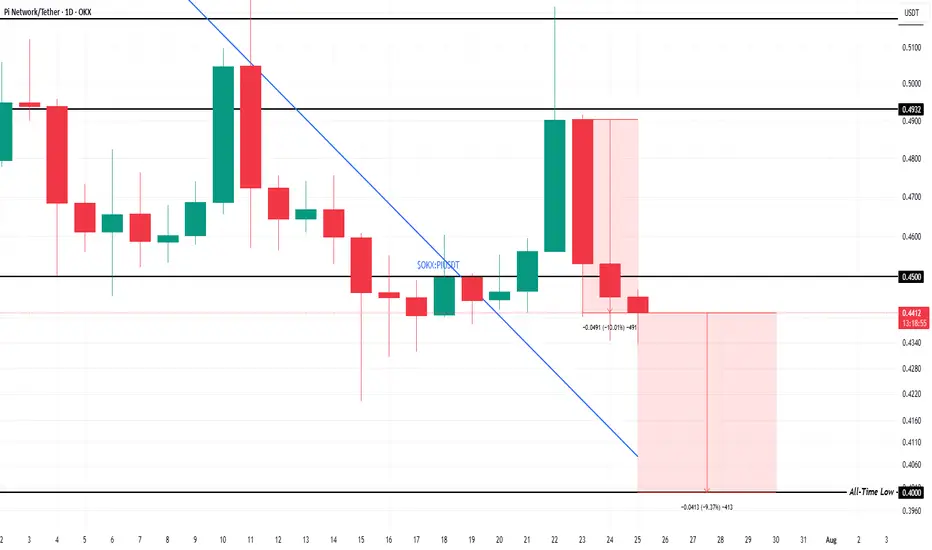
Pi Coin Price Falls 10%, All-Time Low Now Just 9% AwayOKX:PIUSDT price is currently hovering at $0.44, just 9% away from its all-time low of $0.40 . The recent decline has pushed the altcoin below the support of $0.45, indicating a weak position. The next support level for Pi Coin is crucial as it attempts to hold above its current levels.
With Pi Coin already down 10% in the past two days , the outlook appears grim. Should the selling pressure continue, the altcoin may easily slide to its all-time low, forming a new ATL (all-time low). This would mark a new low in OKX:PIUSDT short history, potentially signaling a longer-term bearish phase.
However, if OKX:PIUSDT manages to reverse its course, there is hope for recovery. If it can secure $0.45 as a reliable support floor, the altcoin may push past $0.49 and even reach $0.51 . If these levels are reclaimed, the bearish thesis could be invalidated, and a new upward momentum may be formed.
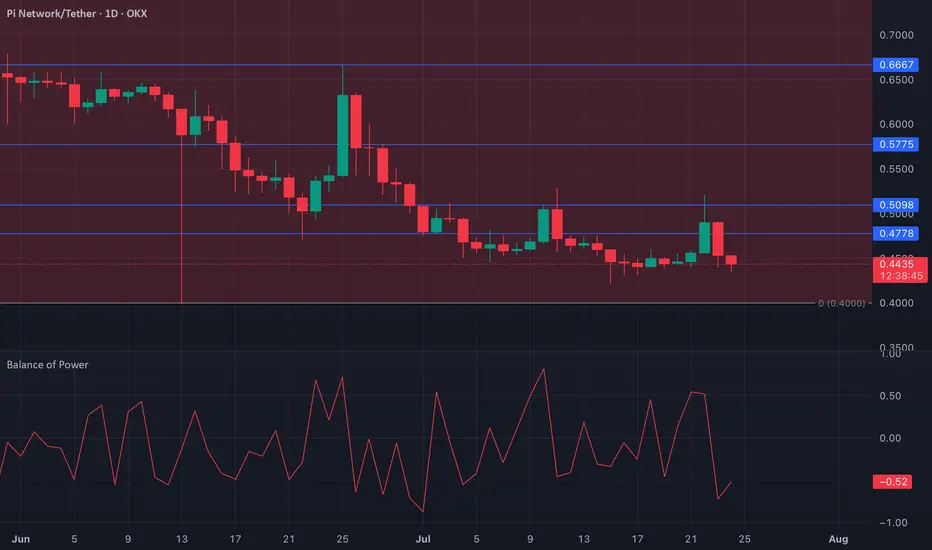
PI Faces Continued Sell Pressure as BoP Turns NegativePI continues to exhibit a bearish structure, with momentum indicators reinforcing the downtrend. The Balance of Power (BoP) indicator currently reads -0.49, signaling that sellers remain firmly in control. This negative reading reflects a market dominated by sell-side pressure, with minimal resistance from buyers.
As the BoP measures the strength between buying and selling forces, a sustained negative value implies continued bearish momentum. Unless new demand emerges to offset this trend, PI could see further downside in the short term. Traders should watch for any signs of reversal or increasing buy-side strength before considering long entries.
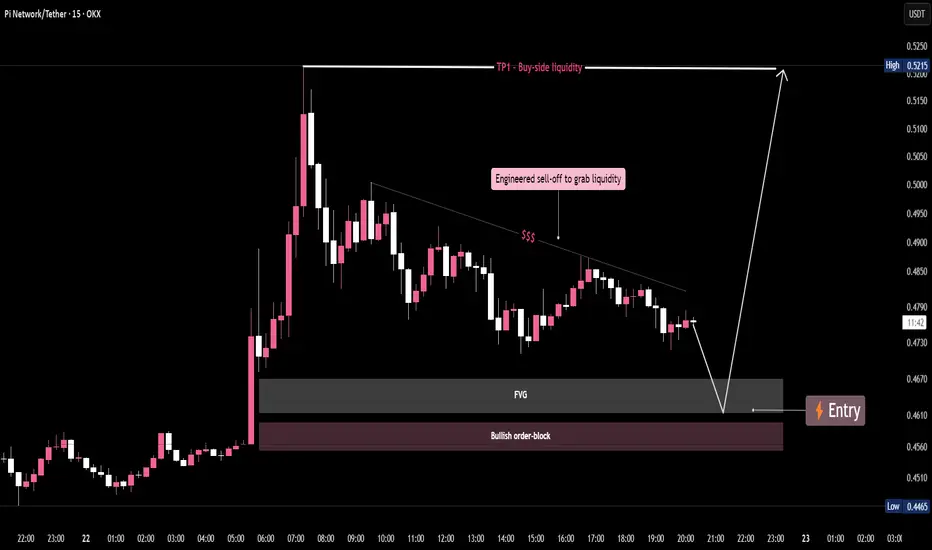
PI/USDT- Liquidity Grab Loading.....Price is sweeping trendline stops before tapping into a key FVG + bullish order block.
Smart money is accumulating below—next stop: buy-side liquidity above $0.52.
A textbook SMC play unfolding. Are you ready?
What does the future hold for Pi Network?Pi Network Coin (PI) is the native cryptocurrency of the Pi Network, a decentralized blockchain project designed to make cryptocurrency mining and usage accessible to everyday people via mobile devices. Unlike traditional cryptocurrencies like Bitcoin that rely on energy-intensive mining hardware, Pi Network allows users to mine PI coins on their smartphones using a lightweight, mobile-friendly process that does not drain battery life or require costly equipment.
What Could make Pi Network Grow (Factors affecting price)
Short-term price is highly volatile, influenced by token unlock schedules, exchange trading volumes, and speculative sentiment.
Medium-to-long term potential depends on the speed and success of Mainnet open trading launch, exchange listings on major platforms, and real-world PI ecosystem adoption including DeFi and decentralized applications.
Risks stem from regulatory uncertainties, possible high selling pressure from early miners, and slow token utility development.
Positive catalysts include expanding app ecosystem, mainstream exchange listings, and growing merchant/payment acceptance.
As of late July 2025, the PI price is subject to these dynamic factors, with market price hovering around $0.0006–$0.73 depending on exchange and trading pair, showing both significant upside if adoption accelerates and downside from current bearish technical pressures.
Is Pi Coin Set To Repeat History With a 114% Price Surge?OKX:PIUSDT is currently trading at $0.48 after consolidating sideways for several days. This consolidation has worked in its favor, helping the altcoin escape its two-month downtrend. Investors are now watching closely for the next resistance to be broken.
OKX:PIUSDT Bollinger Bands are converging, signaling potential volatility ahead . This technical pattern, seen previously in May when Pi Coin saw a 114% price surge , suggests that the altcoin could experience a similar breakout if market conditions remain favorable. With BINANCE:BTCUSDT consolidating and BINANCE:ETHUSDT leading altcoins, sentiment leans bullish, increasing the likelihood of Pi Coin's upward movement.
Macro indicators also align with this bullish outlook, as the Chaikin Money Flow (CMF) shows rising capital inflows into $OKX:PIUSDT. This suggests that investors are growing more confident and positioning themselves for a potential altcoin rally. As money flows into the market, Pi Coin is poised to benefit from increased demand , setting the stage for a possible price breakout.
Despite being only 17% above its all-time low of $0.40, the technical indicators suggest this support will hold. If OKX:PIUSDT can flip $0.45 into a reliable support level, it could initiate a rally toward $0.51 and beyond, especially if the altcoin season intensifies.
However, if holders begin to exit their positions prematurely, OKX:PIUSDT could slip back toward $0.40 . Such a move would invalidate the bullish scenario and place the altcoin at risk of retesting its historical low.
PI – Bearish Momentum Builds as Key Support Faces PressurePI continues to slide deeper into bearish territory, with technical indicators signaling mounting selling pressure. The Elder-Ray Index on the daily chart has remained negative since July 12, reflecting consistent dominance by bears and a clear lack of bullish momentum.
With sentiment firmly tilted to the downside, the $0.43 support level is now under threat. A breakdown below this threshold could pave the way for a retest of PI’s all-time low at $0.40. Traders should watch this zone closely, as it may serve as a critical pivot for price direction.
That said, any resurgence in buying volume could spark a short-term recovery and shift momentum. Until then, caution is warranted.

Pi Coin is Now 10% From an All-Time Low; Any Chance of Recovery?OKX:PIUSDT current price of $0.44 is holding just below the resistance of $0.45, a critical level for the altcoin. However, with the ongoing downtrend, this resistance is proving difficult to breach. The altcoin has faced continuous declines for the past two months, and without significant support, it remains susceptible to further drops.
OKX:PIUSDT is only 10% away from reaching its all-time low of $0.40. Given the current market conditions and Pi Coin's negative correlation with Bitcoin, the chances of the altcoin falling to this level are growing.
However, if investors increase buying pressure, OKX:PIUSDT may experience a rebound . A successful breach of $0.45 as support could lead to a recovery, pushing the price to $0.49. If this happens, the current downtrend could be invalidated, providing a potential window of opportunity for OKX:PIUSDT to reverse its fortunes.
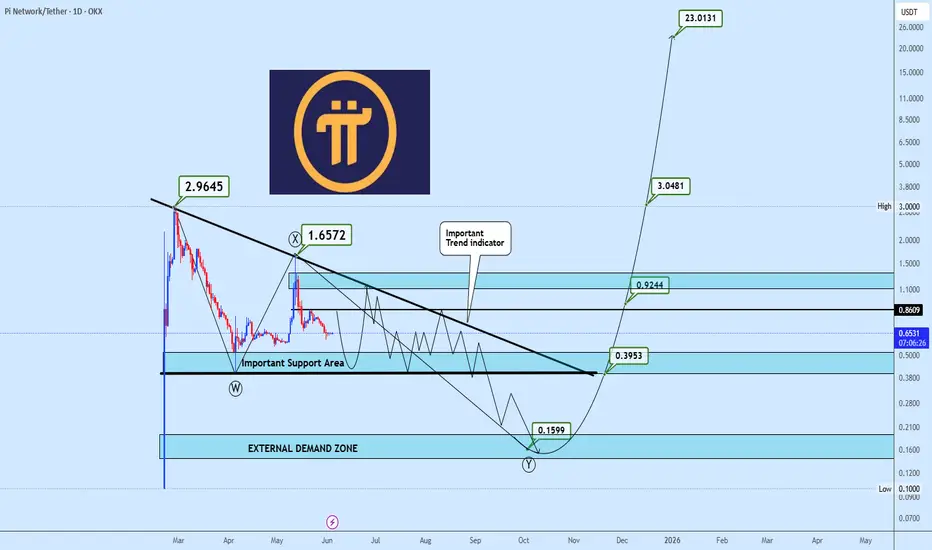
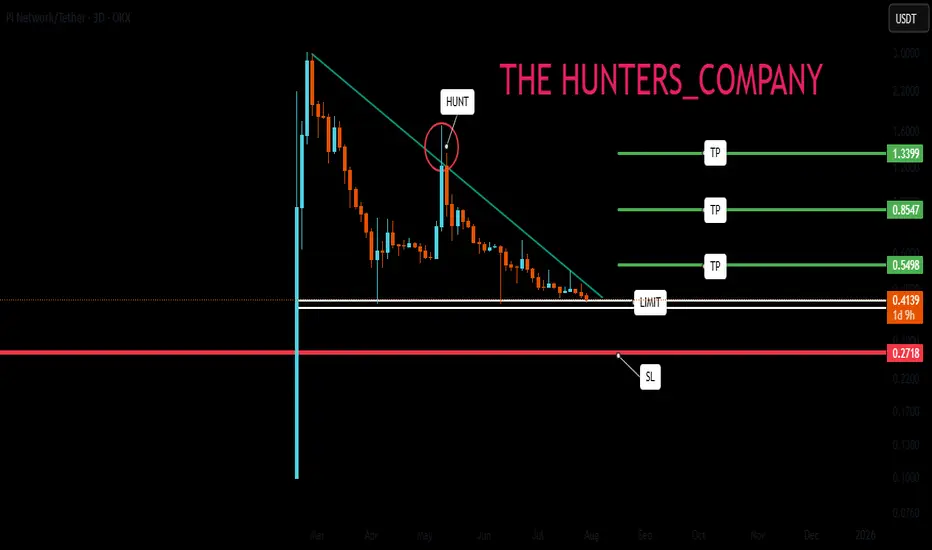
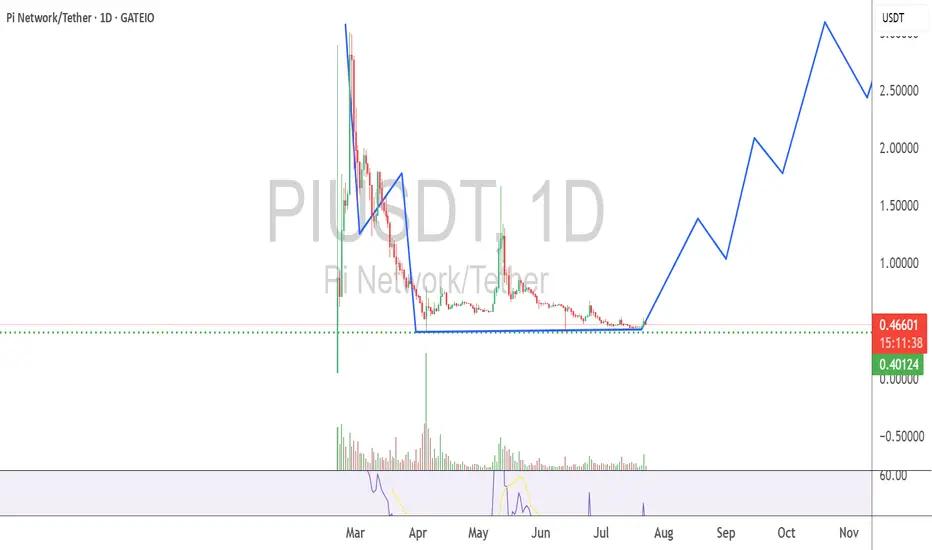
PIUSDT Range Play Within a Potential Descending TriangleAfter reaching a high of $2.9645, PIUSDT has experienced a sharp decline, establishing a base near the $0.38 zone. This base continues to hold, suggesting the formation of a potential descending triangle.
For now, the strategy is to trade the range while the structure matures. A break below $0.38 would likely trigger further downside toward $0.16, where a strong external demand zone aligns with the completion of a possible WXY corrective formation.
On the flip side, a breakout above the upper trendline of the triangle would be a strong bullish signal, potentially igniting a significant rally. Upside targets are already projected on the chart.
As the structure develops, all eyes remain on the key levels that will determine the next major move.