XPT/USD 1DAY CHART SETUPHi everyone this is my trade set up for the XPT/USD for the new week ahead
we had a very nice push last week and i feel it still has the legs to to make the push higher
XPT/USD is still pushing up so i am expecting a pullback to the order block zones and will be looking for a BUY trade
look for pullback to zones lined off on chart then if it meets your criteria for a trade then execute
This is my analysis only please trade with caution and risk management in place
good luck for this weeks trading
please like and comment both are welcome
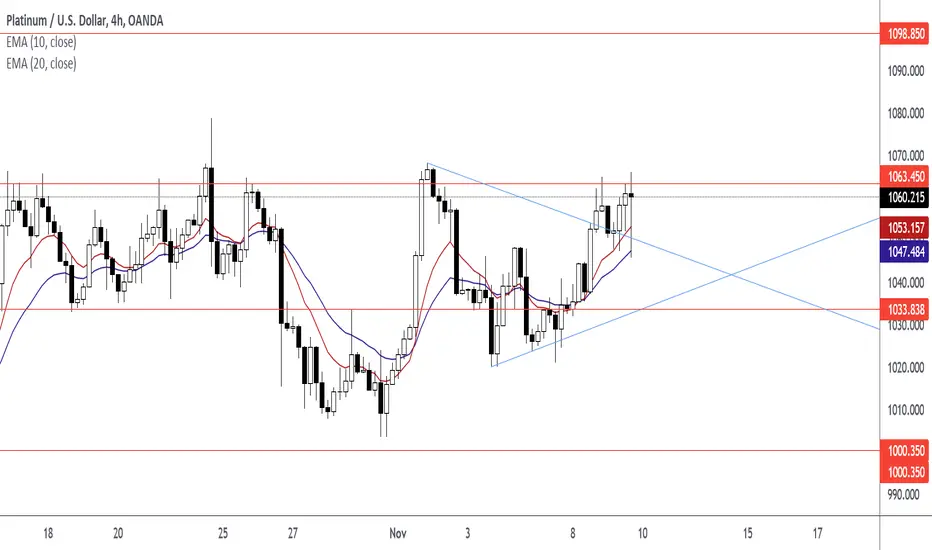
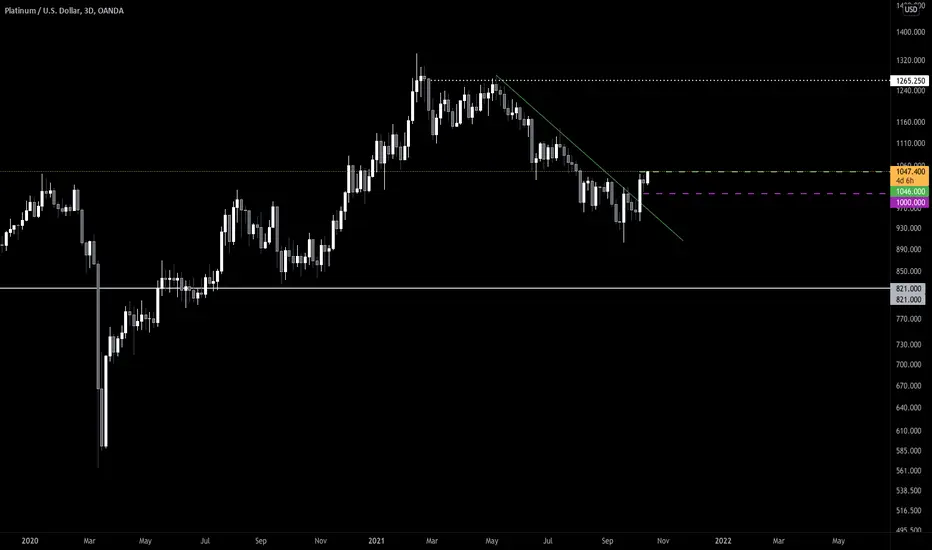
PLATINUM trade ideas

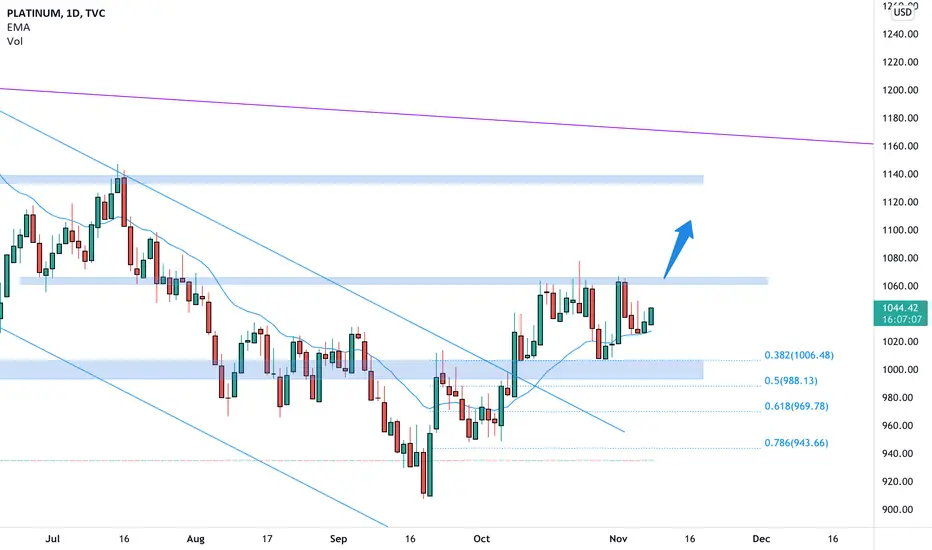
PLATINUM moving higher 🦐PLATINUM on the daily chart broke the perfect descending channel tried to break above the 1060 resistance structure without success.
The price tested then the 0.382 Fibonacci level over a support and we can expect a new attempt of a break to the upside during this week.
According to Plancton's strategy if the price will break and close above we can set a nice long order.
–––––
Follow the Shrimp 🦐
Keep in mind.
🟣 Purple structure -> Monthly structure.
🔴 Red structure -> Weekly structure.
🔵 Blue structure -> Daily structure.
🟡 Yellow structure -> 4h structure.
⚫️ Black structure -> <4h structure.
Here is the Plancton0618 technical analysis , please comment below if you have any question.
The ENTRY in the market will be taken only if the condition of the Plancton0618 strategy will trigger.
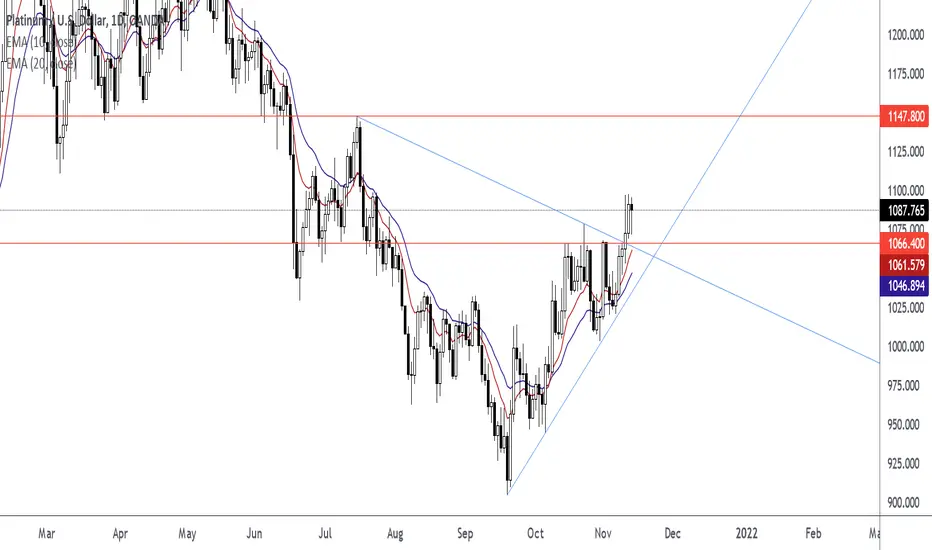
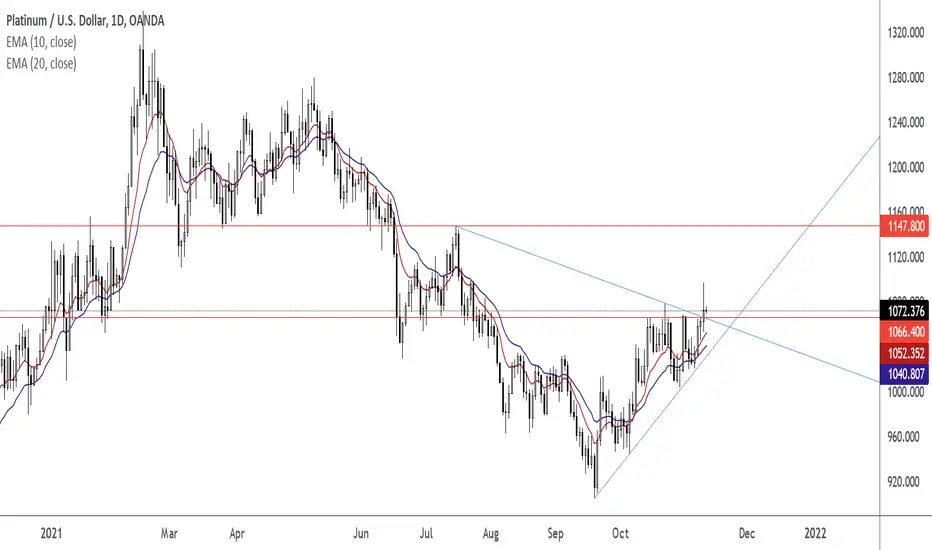
XPTUSD (Platinum) Entry 1066.400 Take Profit 1147.800XPTUSD (Platinum)
Diagonal Trend Line
Horizontal Support Resistance Line
EMA 10
EMA 20
XPTUSD and Metal Markets Are BullishXPTUSD. My Outlook for Platinum is currently bullish. I have open long positions. See October 25th, October 31st, and November 5th initial entries.
(Time Wave Analysis) PLATINUM updateIf you want to buy, you will have to wait a bit.
The point I want is where the new weekly correction trend line is created.
The reason is that it is a reversal area with the possibility of rising and falling.
good luck.

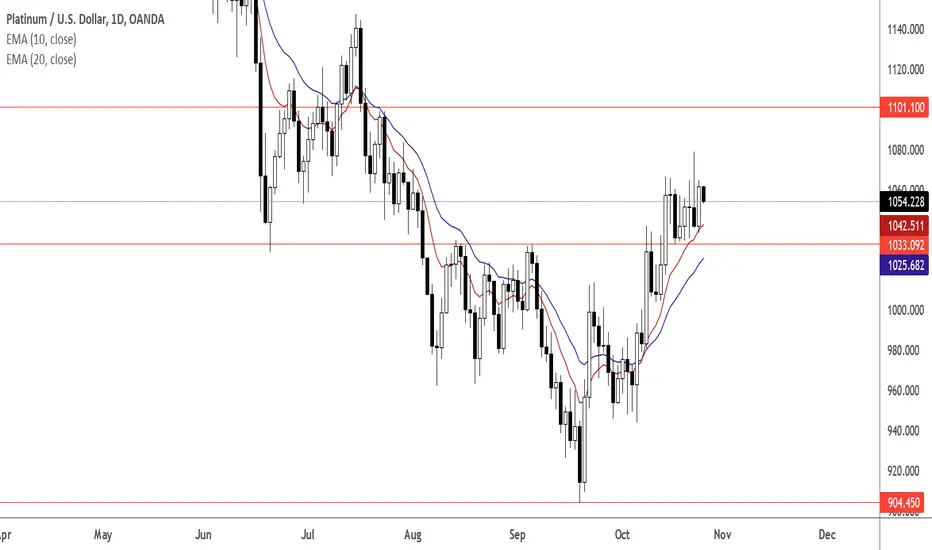
PLATINUM - DAILY BULLISH CHANNEL UPTRENDPlatinum - XPTUSD trending up very nicely on monthly and even daily timeframe. Clean bullish channel uptrend with strong support.
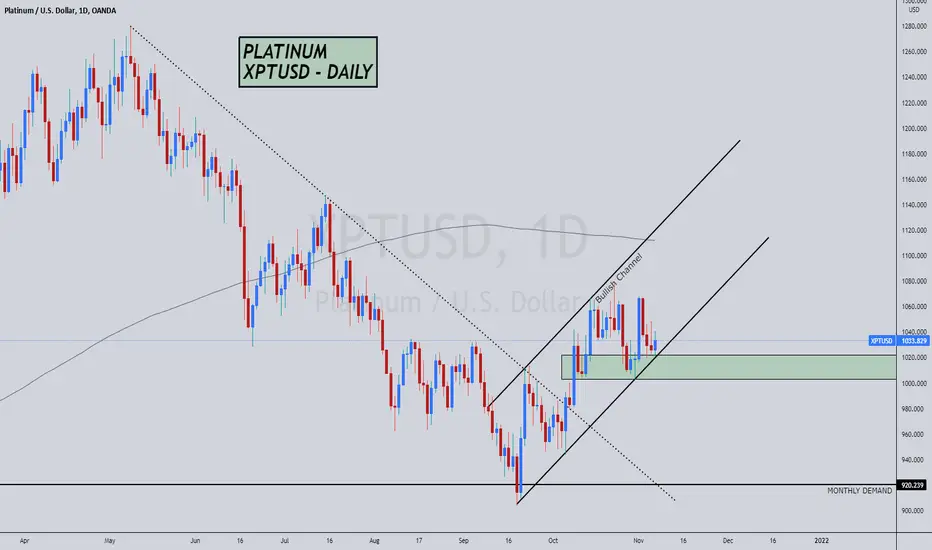
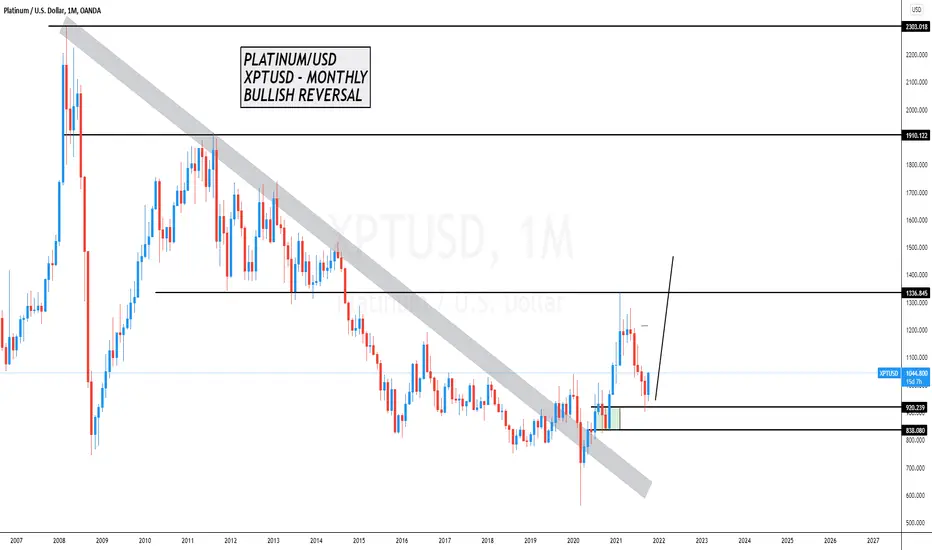
PLATINUM - XPT - MONTHLY TRENDING UP BIG UPSIDEPlatinum - XPTUSD - monthly chart is trending up very nicely after pulling back down for a correction in the past few months. I'm anticipating a continuation of the bullish trend for platinum in the coming months.

PLATINUM moving higher 🦐PLATINUM on the daily chart broke the perfect descending channel and now testing a daily resistance.
According to Plancton's strategy if the price will break and close above we can set a nice long order.
–––––
Follow the Shrimp 🦐
Keep in mind.
🟣 Purple structure -> Monthly structure.
🔴 Red structure -> Weekly structure.
🔵 Blue structure -> Daily structure.
🟡 Yellow structure -> 4h structure.
⚫️ Black structure -> <4h structure.
Here is the Plancton0618 technical analysis , please comment below if you have any question.
The ENTRY in the market will be taken only if the condition of the Plancton0618 strategy will trigger.

XPT USD BUY (PLATINUM - US DOLLAR)Hi there.
Price is forming a continuation pattern to the upside.
Wait for the price to complete the pattern and watch strong price action for buy.

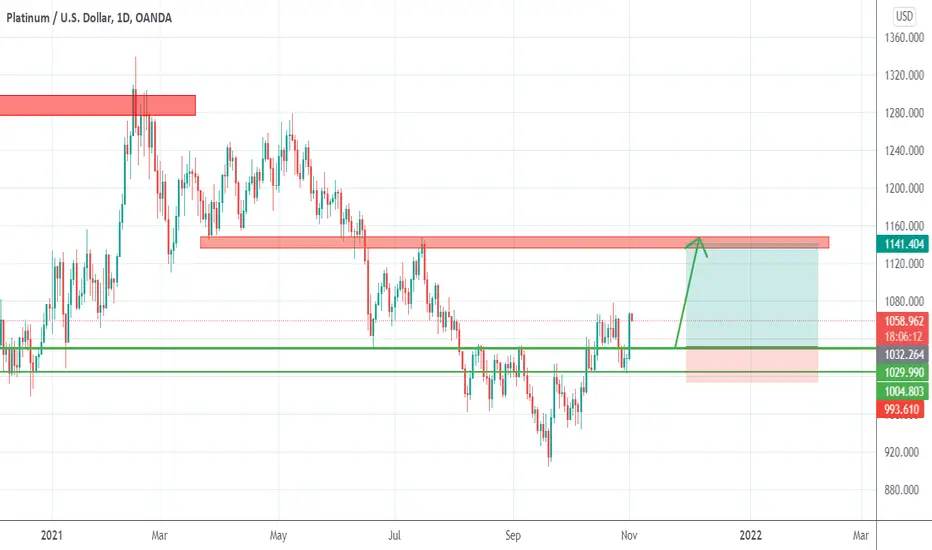
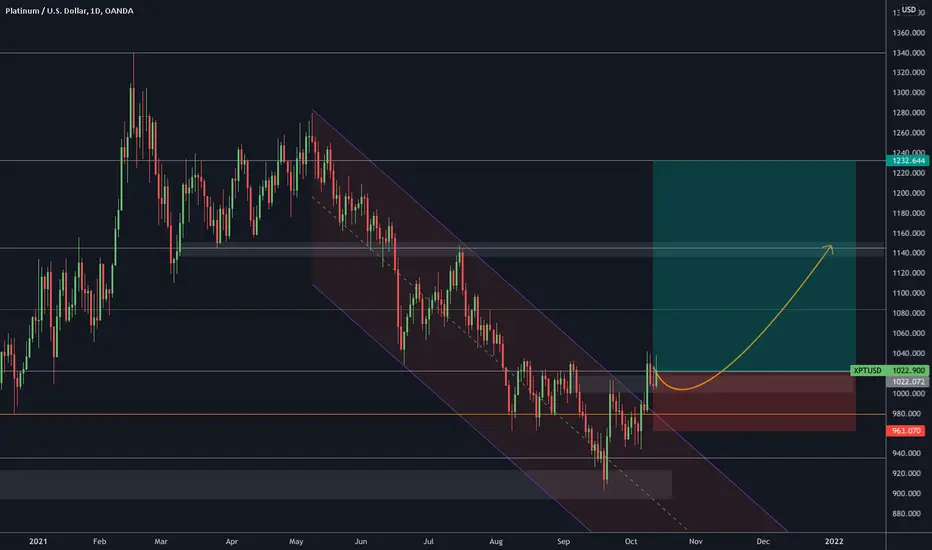
Platinum can rise to 1150 zoneAfter dropping under 1000 figure, Platinum has managed to recover and now is trading at 1058
I expect a new leg up from XptUsd and 1030 zone could be a good place to buy for a rise to 1150
Platinum back under 1k zone would negate this scenario
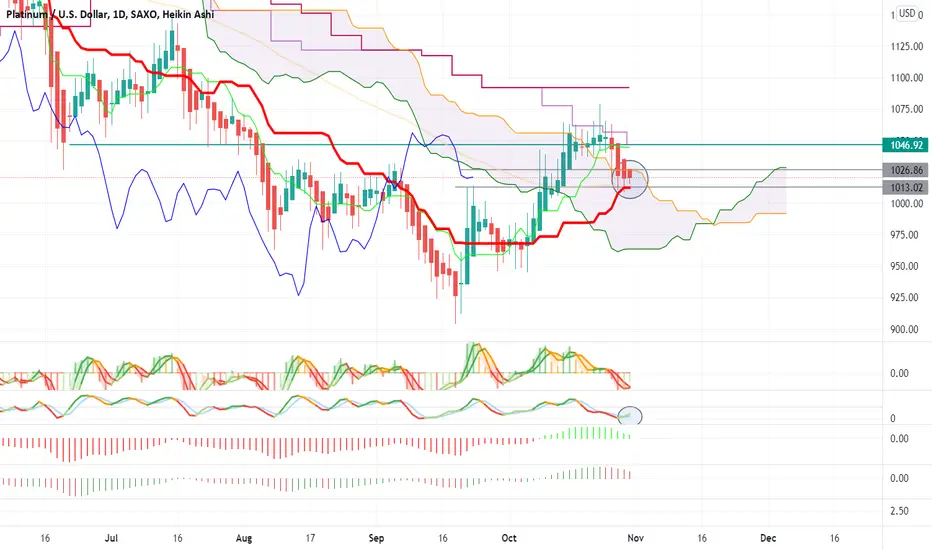
Short term bullish supportShort term it seems a good risk/reward to buy in the 1013-1024 support zone. Momentum seems to be reversing too.
For a longer term trend trade in bigger size it must close above 1047.
PLATINUM XPTUSD SHORT TRADE SETUPAll information provided in this video. Please do keep in mind that this is just a weekly correction.
The overall bias on the monthly and weekly is to the upside
Thank you and trade safe

#Platinum taking on a resistance line looking V V bullishPlatinum looking pretty solid folks! Nice run now trying to negotiate an important subchannel resistance line.\
See how the lines tell teh story? You see? Magic!

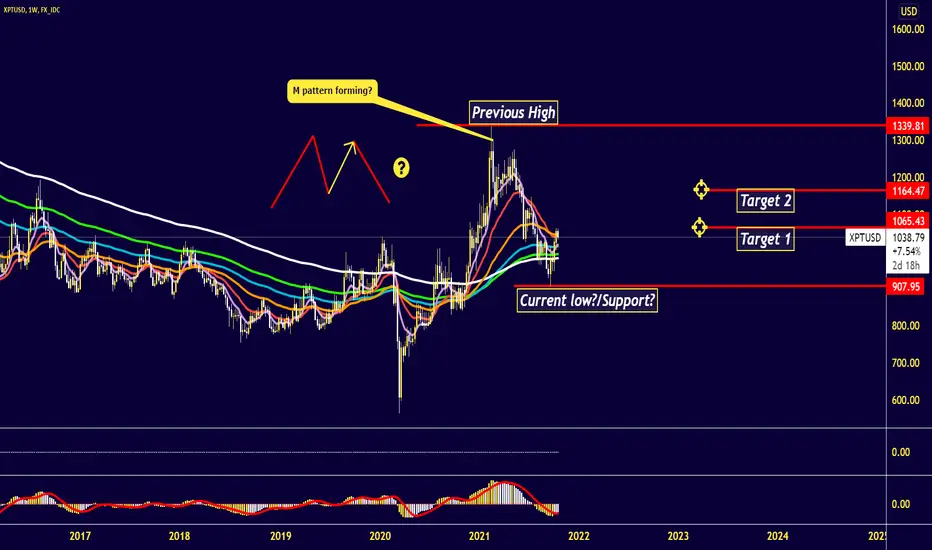
Platinum (XPTUSD)I believe that we are currently retracing the previous high. The current low area seems like a higher low on the weekly. That Mac D looks like its attempting to lose momentum and should eventually cross to the upside! I want either 38% or 61% of previous high. I won't hold forever. Just as long as I can to squeeze some juice from this nice valuable metal. Platinum is a well respected metal used throughout several industries. Platinum is used extensively for jewellery. Its main use, however, is in catalytic converters for cars, trucks and buses. This accounts for about 50% of demand each year. Platinum is very effective at converting emissions from the vehicle’s engine into less harmful waste products. Platinum is used in the chemicals industry as a catalyst for the production of nitric acid, silicone and benzene. It is also used as a catalyst to improve the efficiency of fuel cells. The electronics industry uses platinum for computer hard disks and thermocouples. Platinum is also used to make optical fibres and LCDs, turbine blades, spark plugs, pacemakers and dental fillings. Platinum compounds are important chemotherapy drugs used to treat cancers.
source: rsc.org
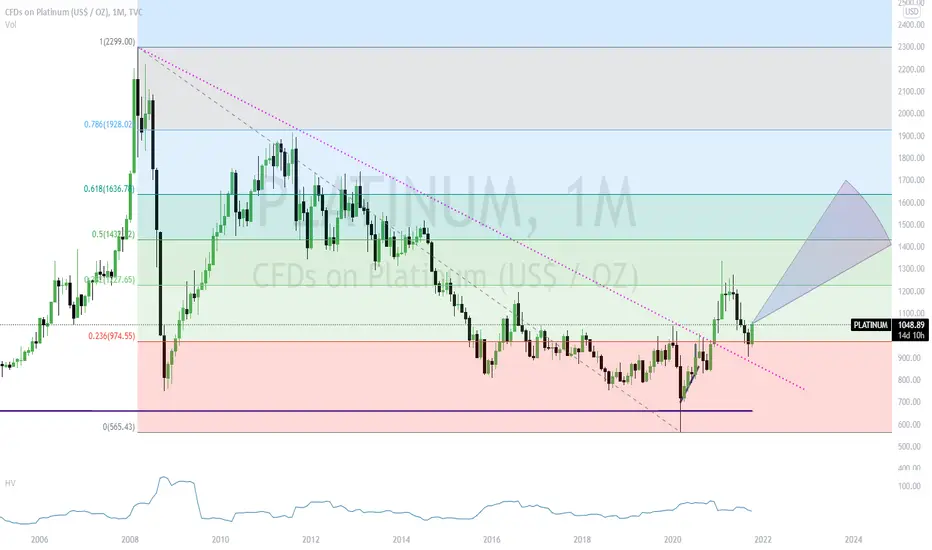
Platinum target 1400 to 1650 (long-term)Platinum has bounced from support and retested the dotted line after a break out. This shows that the descending line is now support. Should go up from here, we'll see.
Not investment advice.
PLATINUM - XPTUSD MAKING A BULLISH COMEBACKPlatinum - xptusd looking bullish on the monthly chart making new highs and leaving behind demand footprints. Im expecting further upside on this metal and will be looking to take longs on dips as the main trend for this metal is bullish imo.
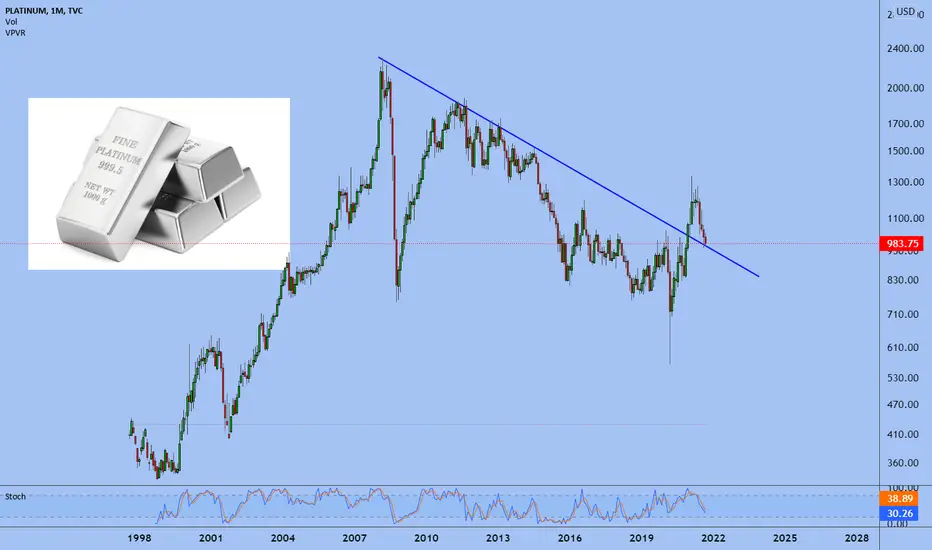
Platinum Platinum has recently broken through 14-year resistance. It is a strong bullish signal. Now platinum is going to test this support level.
Best regards, EXCAVO
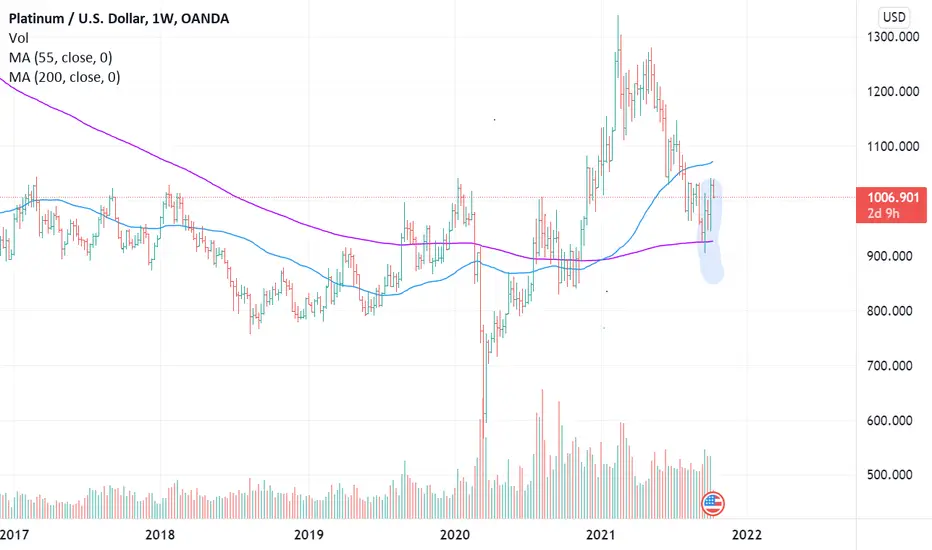
Bullion Basing?Bullion Basing?
While the rest of the commodity markets have been grabbing the headlines lately, you would have been forgiven for forgetting about the precious metals markets, however these now need to go back on your radar as we suspect that they are in the throes of basing. While we need more evidence to confirm, we would at least suggest that these deserve more attention.
More specifically Platinum, Palladium and Silver. Palladium and Platinum have recently stabilised at their respective 200-week moving averages and platinum a couple of weeks ago even charted a key week reversal. A key week reversal is a trend reversal pattern – in fact these tend to work well so I would upgrade that statement to these are one of the more important reversal patterns to watch out for. In a downtrend, the price hits a new low but then closes ABOVE the previous week’s highs.
The reason why I watch specifically the 55 week and 200 week moving averages and in fact watch the 55 and 200 daily and monthly period ones as well, is that as a 35 year veteran I have noticed that markets tend to mean revert to their long term moving averages particularly when markets are volatile. I have seen many times that markets move to and reverse from these moving averages and used in a simplistic way; while above these moving averages the trend is up, while below we can assume a negative tone.
Also 55 weeks is virtually one-year and 200-week equates to approximately 4-years and they act as a medium- and long-term barometer of trend. So why not 50 or 52 week – because 55 is a Fibonacci number and I am a big fan of Fibonacci.
en.wikipedia.org
But when we see Platinum perform a key week reversal AND break above its 55-day ma AND Palladium reverse ahead of its 200-week ma AND silver reverse ahead of a multi-year pivot it is time to pay attention
Disclaimer:
The information posted on Trading View is for informative purposes and is not intended to constitute advice in any form, including but not limited to investment, accounting, tax, legal or regulatory advice. The information therefore has no regard to the specific investment objectives, financial situation or particular needs of any specific recipient. Opinions expressed are our current opinions as of the date appearing on Trading View only. All illustrations, forecasts or hypothetical data are for illustrative purposes only. The Society of Technical Analysts Ltd does not make representation that the information provided is appropriate for use in all jurisdictions or by all Investors or other potential Investors. Parties are therefore responsible for compliance with applicable local laws and regulations. The Society of Technical Analysts will not be held liable for any loss or damage resulting directly or indirectly from the use of any information on this site.