How to effectively start learning the systemThe path from "zero" to "Top Investor" requires knowledge of how our brain learns the fastest. This is part of the knowledge of the path of success in trading.
The best traders started from scratch - they knew nothing. One of the critical moments of their development was when they began to understand the system. It was often preceded by various events, moments of resignation, discouragement, parting ways with the market and subsequent returns.
Many trading systems are based on recognizing formations (price and candlestick), recognizing signals from indicators. In other words - you need to see a certain number of examples to be able to correctly identify signals when they will draw in real time in the market.
Usually this process goes as follows:
observation on the historical chart, when we see the signal and the subsequent course of the movement,
observation of what the signal looks like without what happened next,
observation of the signal in real time,
learning how to make a decision to enter the market on the drawing signal.
If you want to speed up this process as much as possible - then know that the fastest to develop (and the fastest to reach the level of independent, correct identification) are people who have seen a lot of examples.
When you look at the perspective of what I wrote - it's pretty obvious, right?
If so, why do 90% of books describing systems contain only a few or a dozen graphic examples? I have seen 120 or so such books. The pinnacle of modesty was one (about a fairly popular system), which contained only nine screenshots. Nine!
With such a number of examples, do you think you can learn anything enough to risk your money on this system? I'm sure you won't.
No one can succeed in this way. Our brain needs to see a lot of examples - preferably in the most market-like conditions. Only then will it correctly solve the tasks posed by the market situation.
This is simply how our brain works, and if we want to follow the path of development quickly, we should respect these laws.
Introduction to rapid learning of systems
Imagine that you have a system and you know it very well. It is easy to understand and apply. The signals are clear. Their identification leaves no doubt. As a result, trading becomes simpler and more rewarding for you.
Every day when you sit down to trade you have at hand a document in which you have briefly written down the next steps of analysis you perform on the market before taking a position. This document is called "Market Analysis."
On the second sheet, "List of trades," you have written down the set-ups you trade. Your market activity boils down to doing some simple analysis and then setting an alert and waiting for one of the setups to be drawn.
If you had any doubts you still have another powerful document at your disposal - detailed descriptions and analyses of 100+ signals, which you can always refer to in case of even slight doubts. "System Manual.
You look at the market from a long perspective, if even one, two or three entries do not pay, the next ones will more than make a profit. You are not in a hurry, you have a plan that you follow without haste. Looking at the growing account you begin to realize that your earlier dreams were too modest, you will be able to afford more.
Nice description of your possible future, right? Then let's make it a reality.
I described above three documents: "Market Analysis", " List of Trades" and "System Manual". And here is the easiest way to get into possession of such:
1. if you are lucky - you will get such documents from someone who teaches you the system. However, this is rare. In most cases you will not have them for two reasons:
some vendors don't think they are needed ("it's enough for me to show the system") and that's OK, their right
some system vendors know they can't provide them, because either their systems are a scam or a short-lived ephemera. Then such a document would work against them. Without a system manual, however, it is difficult to achieve any success, it is virtually impossible.
2 You can prepare such a document yourself The plus side of this solution is that you will learn a lot with it, and there is not much work involved. The second plus is - that with it you will learn the system much faster. So let's move on to a description of how to prepare such materials yourself.
Step 0.
Take a book or training on the system you have. Perhaps you are already a more experienced trader and have a system "in your head" and it is, for example, a modified version of some other system. In this case, the preparation of the mentioned documents will give you a lot: it will clearly reduce the stress before and during the trading and will clearly increase your profits.
Step 1.
Analysis. If your system requires you to analyze markets before entering - list one by one what you are analyzing and how. Strive to make the criteria you use objective. Example "is condition X met or not".
Entries. Write down all the types of entries your system has. If it is an indicator system and you have one type = signal from the system, describe exactly what should point to which indicator.
Fundamentals. If the system requires some additional situation, for example, some information about the instrument ("fundamental" data) then write that down too. What information is needed, what values the fundamental indicators must take.
Position management rules. Write down the rules for entries, position management and exits.
Itd.
Note what the goal here is: I would like you to have a complete description of OBJECTIVE criteria for entries, position management and exits. So that nothing will depend on your mood, your vision, or your "intuition".
Having such detailed descriptions - you will know at any time:
1. what you should currently focus your attention on.
2. What decision to make based on the reading of what you see.
This is very important, because if you enter the market with money and emotions are turned on - you will be compounding losses and cutting profits, as most beginners do (why they do this I will describe later). And you have NO CHANCE of achieving success.
With money in the market and under pressure - if you don't have objective, independent criteria, your decisions will be bad and it's only a matter of time when someone will take your money away from you.
Step 2.
Once you have the rules of analysis written down (the first sheet) and entries, exits and position management (the next pages, 2-3 at most) then analyze about 30 historical signals.
1 "Reverse" the market on your platform, for example, by a few months.
2. Open the platform with news from the markets of that day. If you have not taken them into account before - add what you do when the strongest movements/news are approaching (most day traders pull back from the market then).
3. Analyze the market according to your documents.
4. Take screenshots of entry and exit signals.
5. Answer the questions:
a. What readings did the indicators have?
b. What did the set-ups look like?
c. Where exactly did we enter the market?
d. At which point did we exit?
e. What did the indicators look like at the time you managed the position?
6. Make notes of your observations in an additional section "What I learned today".
If you do 2 analyses a day according to your written rules, in 30 days you will have as many as 60, and that's a lot - your understanding of how the system works will be very good.
There are two types of investors in the world, those who make money and those who are providers of capital to the market. If you put work into your education you have a good chance to be in the first group, if not - you will definitely be in the second.
PLNUSD trade ideas
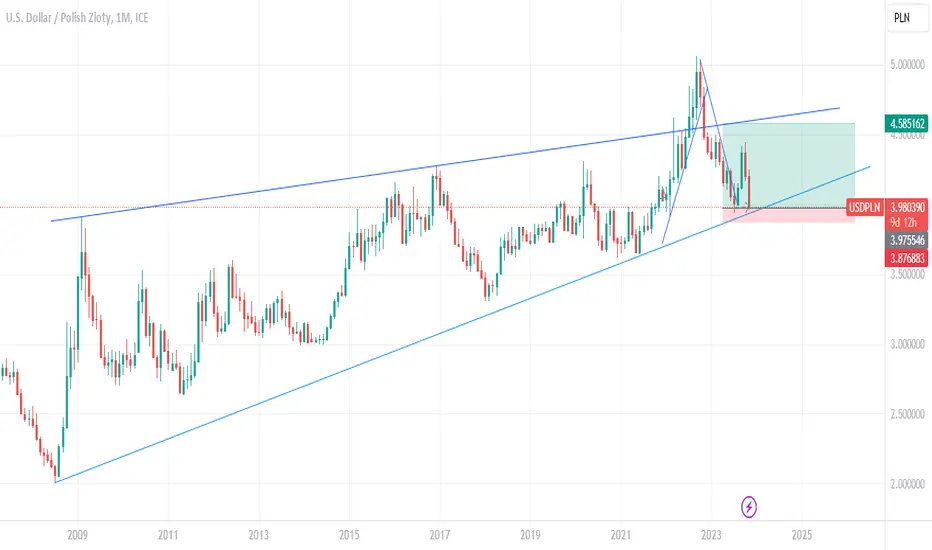
Long position on USDPLNLong position on USDPLN based on M1 and lower timeframes as we reached lower area of up trend channel formed from 2008
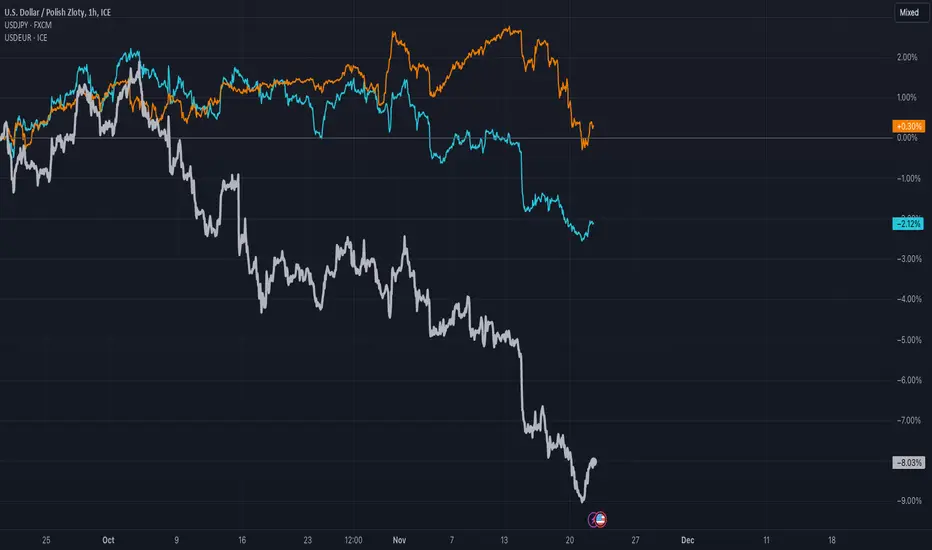
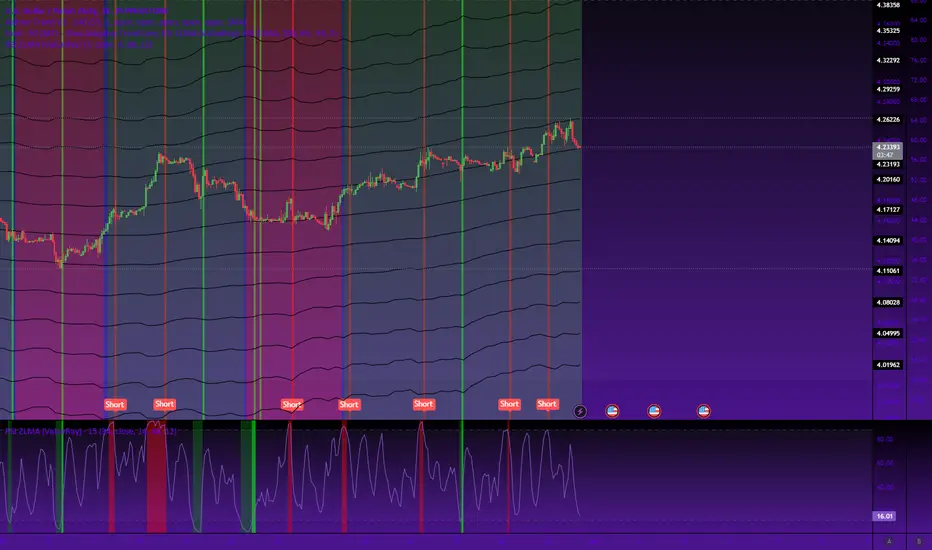
USDPLN 4h sellPolish currency strengthening after govt election and still is getting stronger what is confirmed in TA. USDPLN just printed nice bearish candle still being under 200EMA and that's for me is a bearish signal. Its not an advise its only my opinion.
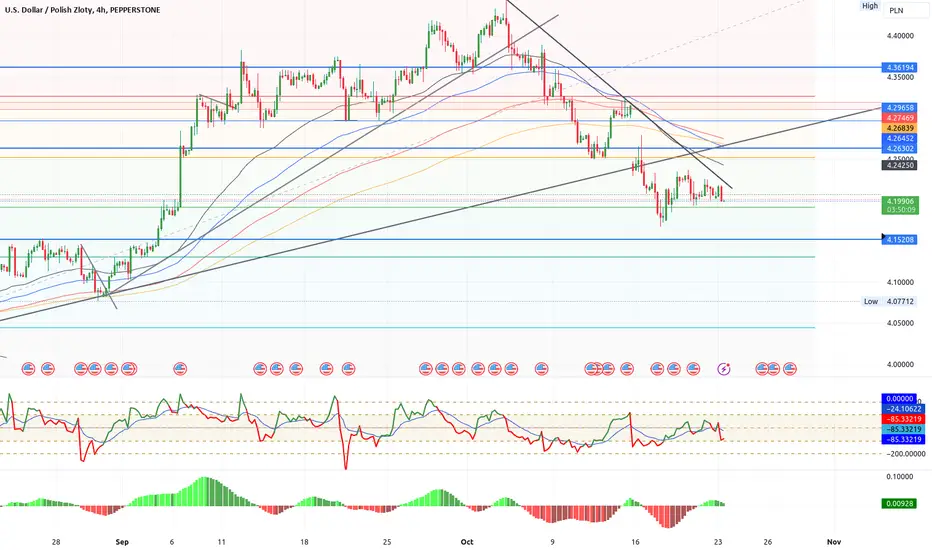
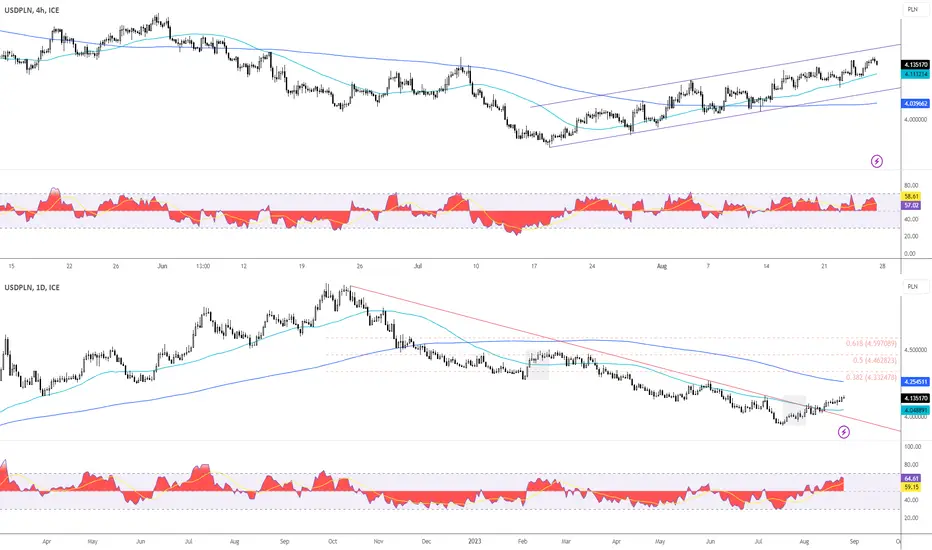
USDPLN Breakthrough: Rally Ahead or Resistance at Play?The rising USD against PLN has finally broken through its descending trendline. This strength in the dollar can be attributed to rising bond yields (amid an unmoved Federal Reserve) and the prevailing economic challenges in Poland and the European Union (recessions).
On a technical note: The USDPLN pair has successfully broken out of a descending trendline on the daily timeframe that was evident since October 2022. Post breakout, a retest of this trendline occurred and the pair has since persisted in its upward journey. When zooming in to the 4-hour chart, the upward trend remains unblemished. However, a key observation here is our current position relative to the 'overbalance' level, which stems from February's bullish correction phase. Should the USDPLN manage to breach this overbalance threshold, we could be looking at potential resistance in the 4.27 - 4.33 region. This zone not only houses the 200-day moving average but also coincides with January's previous low and the 38.2% Fibonacci retracement level.
#USDPLNAnalysis #ForexTrends #BondYieldImpact #TechnicalBreakout #FiboWatch #CurrencyTrading #EuropeanEconomyInsights
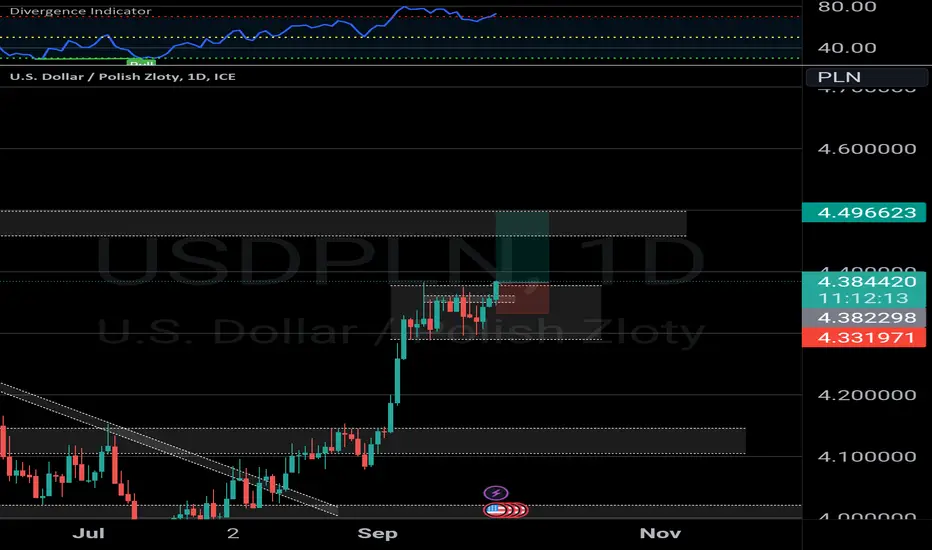
Ride the trend to the upsideI was gone for quite some time, will post more charts now. Here's what I see for this pair. The MM needs to complete the move with one remaining swipe to the upside.

💡USD/PLN Long opportunity Hi traders. On this pair we are currently seeing a breakout. If the breakout holds we are able to take a position going long. USD Is showing signs of strength across most currencies.
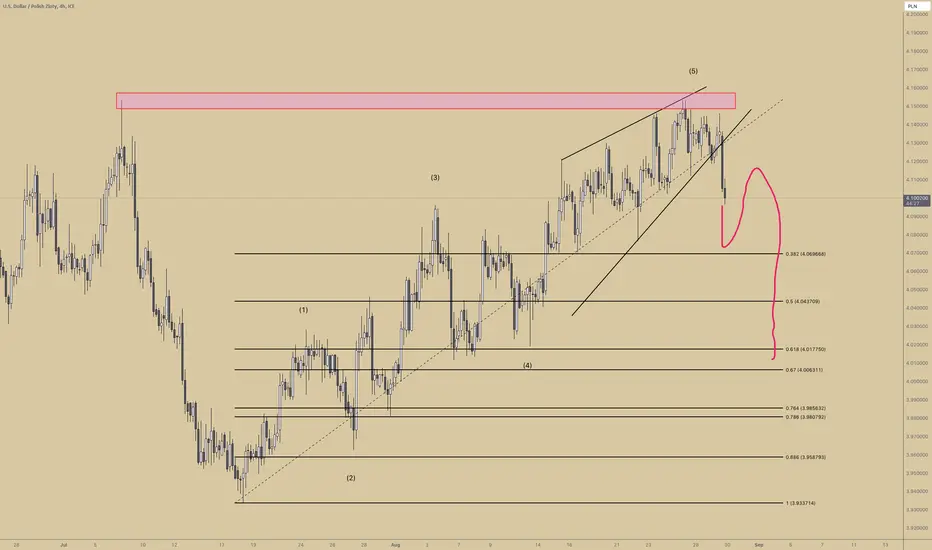
USDPLN can this go lower ?USDPLN created a nice double top and is now on track to the 38.2% FIB, let's see if we get a pullback from there to give the shorts a discount to go short again. My take profit target would be the bottom of wave 4.
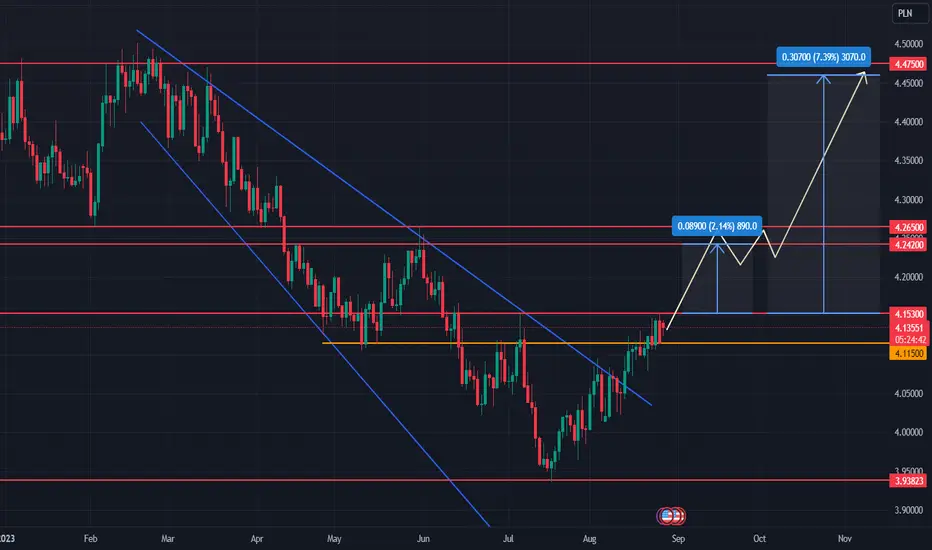
Trading Signal: FOREX Buy Dollars Sell PLN (USDPLN) breakout froUSDPLN pair broke out from downtrend 2 weeks ago and continues to go up.
Entry Point: Consider entering a long (buy) position in USDPLN once the price breaks first resistance at 4.15300 marked on a chart.
Stop Loss: Place a stop-loss order at 4.11500.
Take Profit Targets:
Target Price 1: Set the first target price at 4.24200-4.26500 between two first resistance.
Target Price 2: Set the first target price at 4.4600 below major resistance.
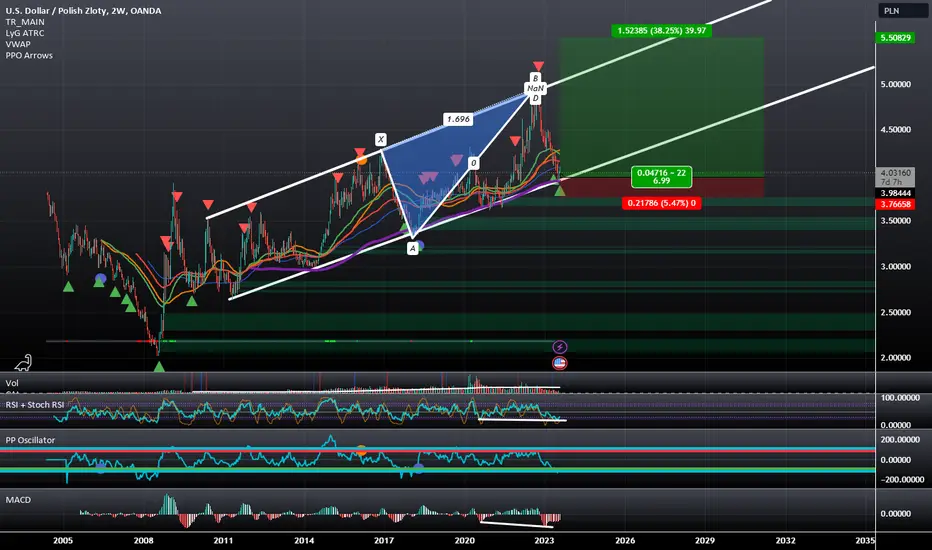
USDPLN: Hidden Bullish Divergence at Channel Demand LineUSDPLN on the Higher timeframes has generated some PPO arrows and Hidden Bullish Divergence at the Demand line of an Upwards Slopping Channel, which also happens to align with the 200 SMA. If it can hang on from here, I think it will make a run back up towards the top of the channel.
Weekly chart is oversold Now with the oversold conditions at hand down the road a long position can be forecasted from this point on

USDPLN - Bearish - Fib and TrendlineFrom trend line in Daily chart it signaled that bearish trend might continue as price is testing Fib 0.382 level and may continue to move downward and breaks LL 3 level.

USDPLN: Seizing the Bullish Momentum🚀📈 USDPLN: Seizing the Bullish Momentum! 📈🚀
📊 Technical Analysis: USDPLN, the forex currency pair, is currently exhibiting a picture-perfect bullish trend on the 1-hour chart! 📈 The price action is riding the waves of a strong and steady bullish trend line. 📈📈 Additionally, the Momentum Indicator RSI shows no signs of divergence, confirming the sustainability of the bullish sentiment. 🚀💹
💹 Trade Plan:
📌 Long Entry: 4.015097 📈
🛑 Stop Loss: 3.992900 🛑
🎯 Take Profit: 4.037315 🎯
📊 Rationale: The technical indicators align beautifully, paving the way for a long trade on USDPLN. We've entered at 4.015097 to capitalize on the ongoing bullish momentum. With the stop-loss set at 3.992900, we are effectively managing risk and ensuring protection against unforeseen market movements.
🎯 Take Profit Target: Our take-profit level is set at 4.037315, aiming to capture potential gains as the bullish trend continues. This level marks a significant resistance area where the price might encounter selling pressure.
📈 Trade Responsibly: Always remember the importance of responsible trading. Only trade with funds you can afford to lose, and maintain a sound risk management strategy. Stay informed about market developments to make well-informed decisions. 🚀💪
🔍 Chart Indicators:
📌 Bullish Trend Line
📌 No RSI Divergence
💡 Stay Technical, Stay Informed! 💡
#USDPLN #ForexTrading #BullishTrend #TechnicalAnalysis #TradeResponsibly #BullishMomentum #TradingView #HappyTrading #MoneyBag 💼💰

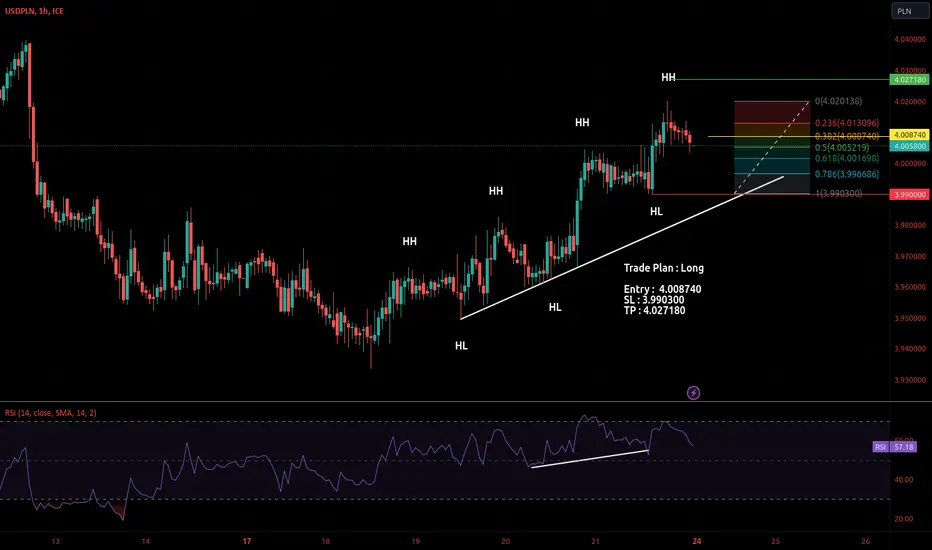
USDPLN : Bullish Outlook 📈🚀 USDPLN: Bullish Outlook for Monday Trading! 🚀📈
💡 Technical Analysis: The USDPLN forex currency pair is showcasing a perfectly bullish trend on the 1-hour chart!
📈 The price action is forming higher highs and higher lows, supported by a strong bullish trend line.
📈📈 Additionally, the Momentum Indicator RSI exhibits no signs of divergence, reinforcing the robust bullish momentum. 🚀💹
📝 Trade Plan: Preparing for a LONG position on USDPLN as the market opens on Monday.
📌 Entry: 4.008740 🚀
🛑 Stop Loss: 3.990300 ⛔
🎯 Take Profit: 4.027180 🎯
📊 Rationale: The technicals suggest a highly opportune moment to go LONG on USDPLN. The entry at 4.008740 aligns with the ongoing bullish trend, while the stop-loss at 3.990300 ensures prudent risk management, guarding against unexpected price movements.
🎯 Take Profit Target: Our take-profit level is set at 4.027180, aiming to capitalize on the continuation of the bullish trend. This level represents a potential resistance area where the price may encounter some selling pressure.
💼 Manage Your Trades: As an astute trader, always remember to employ proper trade management techniques. Adjust your position size according to your risk tolerance, and stay updated with market developments.
🔍 Chart Indicators:
📈 Bullish Trend Line
🚀 No RSI Divergence
⚠️ Disclaimer: This analysis is for educational purposes only and not financial advice. Trading foreign exchange carries inherent risks, and past performance is not indicative of future results. Always conduct your research and consult with a qualified financial advisor before making any trading decisions.
Happy trading! 🚀🌟 #Forex #TradingView #BullishTrade #CurrencyPair #TradeResponsibly #BullishMomentum #ForexAnalysis #USDPLN #Bullish #ForexTrading #TechnicalAnalysis #TradePlan 📉📊💹
USDPLN LongOn the USDPLN currency pair a trading opportunity to buy is building. I would look for the first purchases at a price around 4.24 and if this level does not hold, then only at a price of 3.98. I would manage the exact entries from a lower time frame only when the price approaches these levels.

USD/PlLNHello friends, in this chart with such a structure, I have a bearish view and it is suitable for futures trading

USDPLN Resistance levels, Weekly EMA 200- LONGHello fellow traders,
This idea is based on the fact the price has reached 4.10 being the lowest for a long time and as it's also on the weekly EMA200 it's a good place for the price to have a turning point at least to the Fib level of 0.382 at 4.25
This is not a trading advise it's just an idea so trade carefully, place your bets with s/l being at your own nerve resistance level :D good luck!

USD?/PLN Support BulllThe USD/PLN currency pair is currently hitting a crucial support level, signaling a potentially significant opportunity for those looking to capitalize on the market's movements. This announcement brings with it a multitude of possibilities for traders seeking to enhance their portfolios and make informed trading decisions.
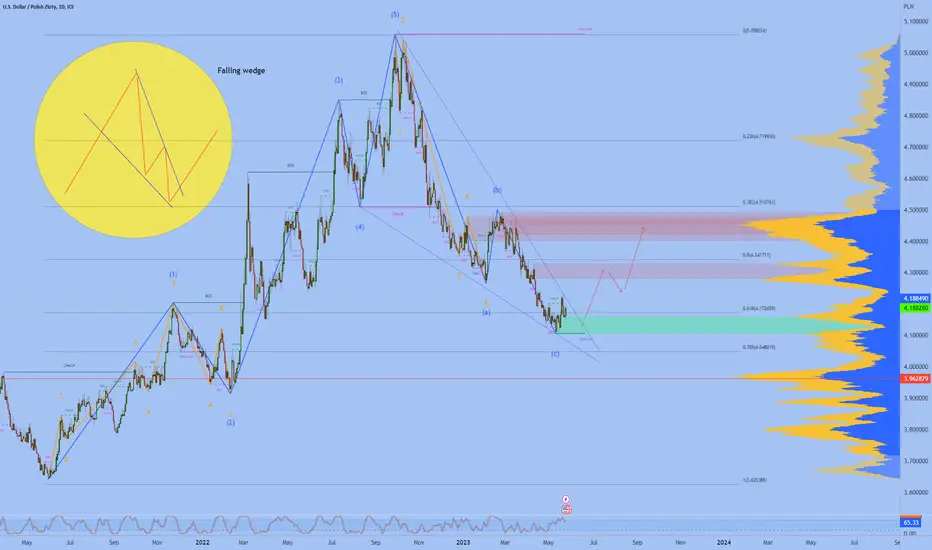
USDPLNBook scenario, a correction within a falling wedge pattern, with an upward impulse after the correction ends. On larger timeframes the trend is up
4.25$ SupportDollar once again hit 4.25$ level which was resistance from 2016 to february 2022 when price went above and this way created support which was tested in may/june 2022, january/february 2023 and right now. It seems solid so I would expect 5$ level retest in the near future and that way creating double bottom on current support. But if price will go below 4.25 and the volumen will be significant it can fall down. On 12th April US CPI level is going to be published and on 14th April PL CPI. Having up-to-date information, I do not plan to open a position earlier than next week.

USDPLN 1H - ABCD PatternAnalysis:
USDPLN is currently in a bearish trend. Price is printing a potential ABCD pattern. If the price breaks below 4.256599 which is level B, it will be a sign of bear trend continuation. In this case we can enter in a short trade. For this trade the stop loss will be level C at 4.308155.
------ Trade ------
Type: Short
Entry: 4.256599
Stop Loss: 4.308155
TP1: 4.205043
TP2: 4.153487

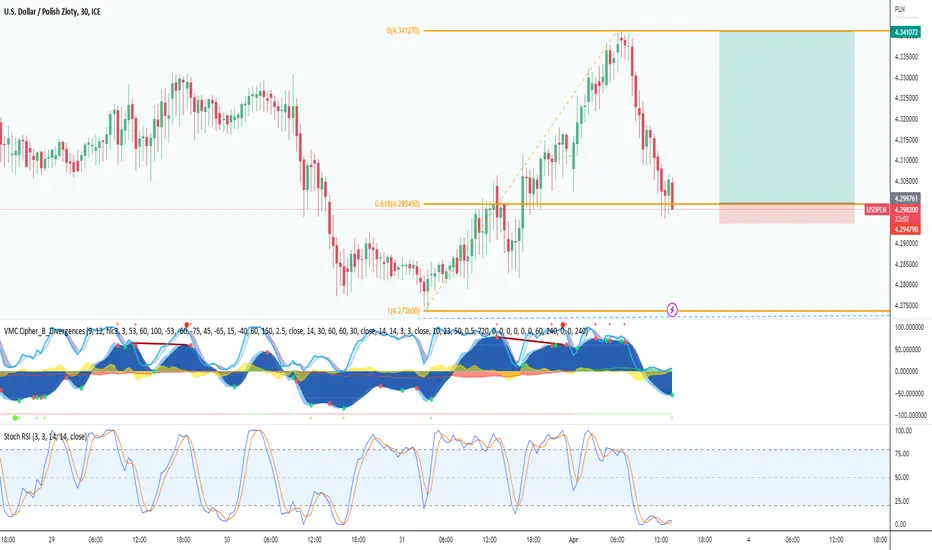
Long tradeBounce from .618 Fib and on macro support.
Bullish div on RSI and bullish dot on MC indicator.
USDPLN BEARISHUSDPLN Pair is in Bearish trend printing LH and LLs in 1HTF. At last LH inverted Hammar is there, drop is expected
